Abstract
Subway fans play significant roles in subway system such as ventilation, smoke discharging and cooling. Nowadays, fast and effective condition monitoring method of subway fan is very important for the safety and comfort in subway system. However, as one of the most important monitoring tool, fan vibration signals are strongly interfered by piston winds condition during train arrival-depart, such effects will cause many unnecessary false alarm and deteriorate the fault detection performance. To overcome this problem, this study proposes a novel condition monitoring method of subway fan under piston wind condition. Piston wind detection method and feature extraction method two key techniques for CMM-PWD method. The piston wind detection method is based on similarity estimation and a new similarity criterion is proposed in this paper. For feature extraction, cyclostationary analysis is exploited for the cyclic feature extraction. The proposed approach is verified by the piston wind experiments and bolt looseness experiments of fans which are widely used in subway ventilation system.The proposed frequency amplitude response assurance criterion (FARAC) has better performance than the conventional methods such as the correlation coefficient and frequency response assurance criterion (FRAC). The results show that the piston wind is accurately detected by proposed method, and fan fault feature is effectively extracted. Furthermore, the proposed method has great potential to deal with other background interference detection of rotating machinery.
Keywords: Condition monitoring, subway fan, piston wind effect, similarity estimation, feature extraction
1. Introduction
Subway fan is widely used in ventilation system, which plays a significant role in ventilation, eliminating smoke and cooling. Thus, subway fan’s condition monitoring and fault diagnosis are essential to guarantee safe operation of ventilation system. However, train passing causes unsteady airflows in subway stations and tunnels. This phenomenon is called piston effect, which is a challenge for fan condition monitoring and fault diagnosis. Since decades, many researchers have focused on the issue of piston effect in subways stations and tunnels. Peng et al. uses experimental and computational fluid dynamics (CFD) method to analyze the unsteady air flow in subway station and tunnel [1]. The effects of different kinds of airflow field in the ventilation were analyzed by simulation method [2]. González and team members present a numerical methodology based on a dynamic mesh technique to properly simulate the influence of piston effect in the ventilation system of subway tunnels [3]. Huang et al. study the characteristics of train-induced unsteady airflow in a subway tunnel, which uses the dynamic layering method for the moving boundary [4]. Kim et al. [17] analyze the unsteady three-dimensional flow in the subway tunnel caused by train, and experimental and computational studies have been conducted [5]. Monitoring, modeling, and characterizing single-speed ventilation fans were proposed by Qin et al. [6]. Wang et al. create and validate the theoretical model of the platform piston wind wall jet through three methods: mathematical theory modeling, field measurements and scale model test [7]. But, there are few studies on the fault diagnosis of fan condition by taking the piston wind effect into account. The piston wind effect will cause many unnecessary false alarm and deteriorate the fault detection performance.
Subway fan is a typical rotating machinery, for which, fault diagnosis methods have been studied by many researchers [8,9]. Feature extraction method is the most important part of fault diagnosis [10,11]. In order to extract the fault features of the vibration [12] or acoustic signal, many methods have been proposed in the literature, such as short time Fourier transform (STFT), wavelet transform, empirical mode decomposition (EMD), Kurtogram, Infogram and Cyclostationarity, etc. STFT decomposes a time domain signal into a 2D time-frequency representation, but it’s restricted by a trade-off between time resolution and frequency resolution. The wavelet transform introduces a scaling factor which can change the time and frequency resolution, but its performance relies on the selection of mother wavelet. Wang et al. use wavelet approach to evaluate fault quantitatively of gear under varying load conditions [13]. EMD is an adaptive decomposition method, which has been developed and widely applied in machine fault diagnosis. Recent applications of EMD to fault diagnosis of rotating machinery are summarized in terms of the key components by Lei et al., such as rolling element bearings, gears and rotors [14]. Keegan et al. present a new approached based on EMD, designated as wavelet-bounded empirical mode decomposition (WBEMD) [15]. But the EMD easy gets the problem of model-mixing. The kurtogram is a fourth-order spectral analysis tool, which can be used for detecting and characterizing nonstationarities signal [16]. The vibration/acoustic signals of rotating machinery has typical modulation property [17,18]. Infogram significantly extends the domain of applicability of the kurtogram, in particular to the situations corrupted with impulsive noise or the relaxation time of the transients is low compared to their repetition rate [19]. Cyclostationarity is one of the key characteristics rotating machinery signals, which involves in many statistical typology signals. Antoni presents the detail cyclostationary analysis and applications in various rotating machinery [20,21]. In this study cyclostationary anlysis method is applied in feature extraction, which combines with the piston wind detection method.
In the present study, the condition monitoring method under piston wind effect (called CMM-PWE) is proposed. The proposed method not only realizes the detection of piston effect and feature extraction, but also can be implemented for real-time condition monitoring. This paper is structured as follows: in section 2, a description of the proposed method is given. The piston wind detection method is based on similarity estimation, and the detail background of similarity method is presented. The second-order cyclostationary analysis method is utilized in feature extraction, and a brief introduction is also presented in this section. Section 3 introduces experiment setup for the validation of the proposed method. Section 4 presents experiment results and illustrates how to detect the piston wind effect and how to extract fault feature. Finally, section 5 concludes the paper.
2. Method
The proposed CMM-PWE method will be illustrated in the following three parts. The first part discusses the proposed method. The proposed similarity estimation method is introduced in the second. The third part explains the cyclostationary analysis theory and how the method could be applied for feature extraction.
2.1 Condition monitoring method under piston wind effect (CMM-PWE)
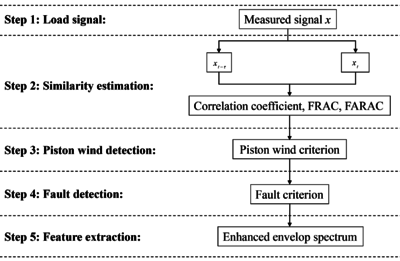
In this proposed CMM-PWE method, the piston wind will be detected before fault detection and feature extraction. Due to the piston wind just affect the measured vibration signal for a short time, so the piston wind can be seen as interference rather than any fault. For this reason, the measured signal can be free of fault detection and feature extraction when piston wind occurs. The Figure 1 summarizes the proposed procedure for condition monitoring method under piston wind effect.
|
| Figure 1. The technical route of proposed condition monitoring method under piston wind effect |
The technical route of proposed condition monitoring method under piston wind effect is illustrated in Figure 1. The detail algorithm of the technical route is expressed as follows.
Step 1: The subway fan vibration signal is sampled using data acquisition system and the acceleration sensors are placed on the fan.
Step 2: Two time series and segments are extracted from the vibration signal . and are expressed as Eqs.(1)-(2)
|
(1) |
|
(2) |
where is the time delay of each time series segment, which is set by similarity estimation method, denotes the instant time of signal and denotes the sampling points time.
The similarity is calculated between and . And three kind of similarity estimation method are introduced in next Subsection 2.2. If the two segments are not similar to each other, it seems that the signal itself is accidentally changed and can be seen as sudden signal, which may be caused by piston wind, other interferences and faults.
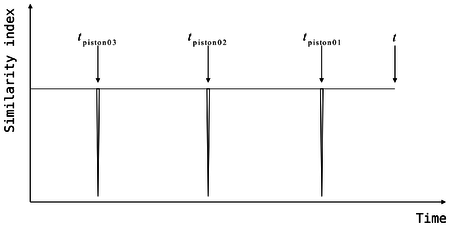
Step 3: In this step, one criterion is put forward to determine whether piston wind occurs. is the maximum piston wind lasting time, which is set based on subway station actual condition. , and are the piston wind occurring, disappearing or fault moments respectively. is the most recent time of low similarity index. is the second last time of low similarity index. is the third last time of low similarity index. The relationship of characteristic factors can be shown in Figure 2.
|
| Figure 2. , and relationship |
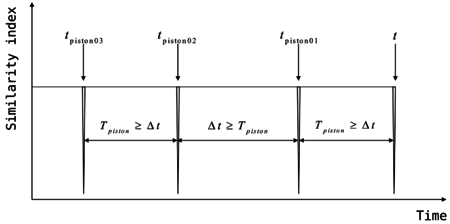
The piston wind detection criterion is expressed as Eqs.(3)-(5), and the working condition is shown in Figure 3
|
(3) |
|
(4) |
|
(5) |
|
| Figure 3. Piston wind working condition |
According to Eq.(5) and Figure 3, it shows that piston wind sudden signal has been occurred. The Eq.(3) shows that the sudden signal last time is longer than standard length . And the Eq.(4) shows that the new sudden signal last time is shorter than standard length , so the sudden signal can be seen as interference of piston wind.
Step 4: In this step, one standard criterion is put forward as Eqs.(5) and (6), to determine whether subway fan’s fault occurs
|
(6) |
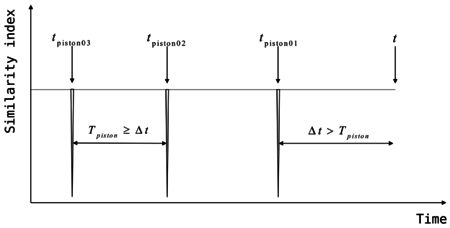
According to Eq.(5) and Figure 4, it shows that the piston wind sudden signal has been detected. The Eq.(6) shows that the sudden signal last time is longer than standard length , so the sudden signal can be seen as faults signals.
|
| Figure 4. Fault working condition |
Step 5: If subway fan fault occurs, cyclostationary analysis is applied for feature extraction.
For transient signal with piston wind, this proposed method could reduce false alarm and guarantee fault features extraction properly. The proposed method includes two key techniques: similarity estimation and feature extraction.
2.2 Similarity estimate
Similarity is one of the best ways to measure the difference between the vibration signals before and during piston wind. Various types of similarity methods can be used in this application [22]. These similarity methods include distance-based measures, dynamic time warping, correlation-based measures, etc. In addition, there are many other specific similarity measures for specific applications. For the similarity measures mentioned above, the correlation coefficient is the most frequently used for time series signals in sound and vibration applications, which is defined as Eq.(7)
|
(7) |
where is the covariance between signals and , , denote the standard deviations of the corresponding signals. The correlation coefficient can quantify the linear relationship between two signals.
Beside in time domain, the frequency response assurance criterion (FRAC) is extensively used in frequency domain [23], which is defined as Eq.(8)
|
(8) |
where and are the power spectrum density (PSD) of signal and , and are the lower and upper frequency limits of power spectrum density and usually take the full frequency band of spectrum. The symbol ‘*’ denotes the complex conjugate. This method is used as a measurement of the linear relationship between two spectrum data.
Correlation coefficient and FRAC were developed as probabilistic and statistical measures, which have been successfully applied in numerous applications. However, researchers have found that correlation-based measures do not always provide sensible results in some cases with deterministic transient signals. The correlation-based similarity measures take into account both the magnitude and shape of signals simultaneously, which may cause the poorly performance. So that some researcher proposed the M–S similarity measure which separately consider the magnitude similarity and the shape similarity [24].
Compared with the above signal similarity estimations, this study proposes the spectral amplitude similarity which only considers the magnitude similarity. The frequency amplitude response assurance criterion (FARAC) is defined as follows
|
(9) |
where and are the PSD amplitudes of signal and , and are the lower and upper frequency limits of PSD.
In this paper, the performance of the correlation coefficient FRAC and FARAC are verified in Section 4.
2.3 Feature extraction
Nowadays, it is widely accepted that vibration signals during fans operation are perfectly fitted to the theory of cyclostationary processes. In general, cyclostationary signals have statistical properties that vary cyclically with time. For rotating machine, its second–order statistics is usually periodic, which can be used as an index for fault diagnosis.
Whether stationary or cyclostationary, the signal can be identified from the state of its autocorrelation. From a mathematical point of view, it is expressed as follows
|
(10) |
where is the delay between two observations, denotes the instant time, is the cyclic period time. By the property of , stationary and cyclostationary second order can be shown as follows
|
(11) |
where is the cyclic period, and the basic cyclic frequency is expressed as follows
|
(12) |
The autocorrelation function is periodic and it can be expressed as a Fourier series.
|
(13) |
The Fourier transforms, with respect to , gives the function of the spectral correlation density (SCD) as follows
|
(14) |
To reveal the coherence coefficients in details, thus cyclic spectral coherence (CSC) function is employed by normalizing the CSD image as follows:
|
(15) |
where represents the CSC image. To extract the cyclic frequency components, the enhanced envelop spectrum (EES) is the results of CSC values summed up along the continuous frequency axis, and normalized by the signal energy as:
|
(16) |
where represents the EES function which is a figure display directly the cyclic components distribution.
Subway fan is typical rotating machinery, and the monitoring signals belong to cyclotationarity signal. In this study, cyclostationary analysis method is used as feature extraction method for subway fan vibration signals.
3. Experiments
To verify the effectiveness of proposed piston wind detection and feature extraction method, two experiments are carried out as follows.
3.1 Axial flow fan experiment description
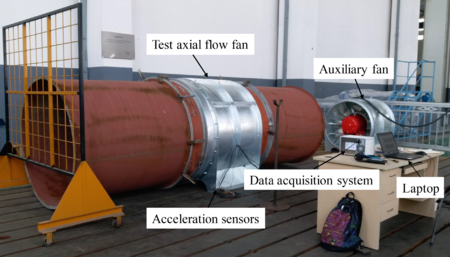
In this section, the proposed method is verified by axial flow fan under piston wind and fault experiment rig. The picture of the test rig is shown in Figure 5, which mainly includes three parts: (1) test axial flow fan, (2) auxiliary fan, (3) data acquisition (DAQ) system. The auxiliary fan is used to supply wind for axial flow fan to simulate the piston wind, which has the same working condition as the test axial flow fan does. The DAQ system includes a data acquisition system (USB-4432, NI Inc.), two acceleration sensors (LW186548, LW186548, PCB Inc.). The sampling frequency (Fs) is set as 5120Hz in all the experiments. The test fan rotational speed is 3000 r/min and the characteristic shaft frequency is 50Hz. The detail information of acceleration sensors is provided in Table 1, and the axial flow fan detail information is provided in Table 2.
|
| Figure 5. The piston wind effect test rig. |
| Sensor numbers | Accelerator 1 | Accelerator 2 |
|---|---|---|
| Sensitivity | 50.18(mV/g) | 51.55(mV/g) |
| Parameters | Air flow rate | Total pressure | Speed | Power | Voltage |
|---|---|---|---|---|---|
| Values | 108000m/h | 900Pa | 3000r/min | 45kW | 380V |
For axial flow fan experiment, it includes the piston wind experiment and bolt looseness experiment. The piston wind experimental procedure includes four steps as follows:
- Start up the test axial flow fan;
- Start up the auxiliary fan;
- Power off the auxiliary fan;
- Power off the test axial flow fan.
The bolt looseness experiment procedure includes four steps as follows:
- Start up the test axial flow fan;
- Loosen one of four bolts on the test axial flow fan;
- Power off the test axial flow fan;
- Fixed fan bolt.
3.2 Jet fan experiment description
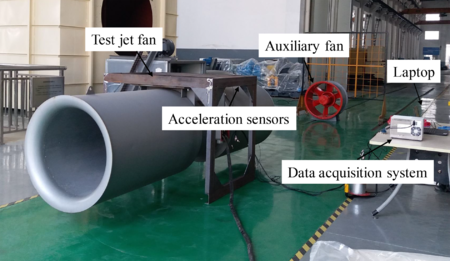
In this section, the proposed method is validated using vibration signals of jet fan and an experiment rig has been set up. The picture of the test rig is shown in Figure 6, which also includes three parts: (1) test jet fan, (2) auxiliary fan, (3) data acquisition (DAQ) system. The information of jet fan is shown in Table 3. The DAQ system is the same as that in axial flow fan experiment. In addition, this experiment rig has one difference from the former one. The test jet fan has different fixing method from the axial flow fan. One suspension device is designed, which can simulate the suspending condition. The test fan rotational speed is 3000 r/min and the characteristic shaft frequency is 50Hz. For jet fan experiment, it also includes two sections that the piston wind experiment and bolt looseness experiment. The detail procedures are the same as that in axial flow fan experiment.
 ] ]
|
| Figure 6. The bolt looseness test rid |
| Parameters | Air flow rate | Total pressure | Speed | Power | Voltage |
|---|---|---|---|---|---|
| Values | 30500m/h | 540Pa | 3000r/min | 7.5kW | 380V |
4. Results and discussion
4.1 Experiments for axial flow fan=
The performance of the piston wind detection method described in previous section is investigated using monitoring data. For similarity estimate methods, correlation coefficient (), frequency response assurance criterion (FRAC) and proposed frequency amplitude response assurance criterion (FARAC) are calculated. Through axial flow fan and jet fan experiments, the best method among them will be obtained.
4.1.1 Case 1: Axial flow fan with piston wind
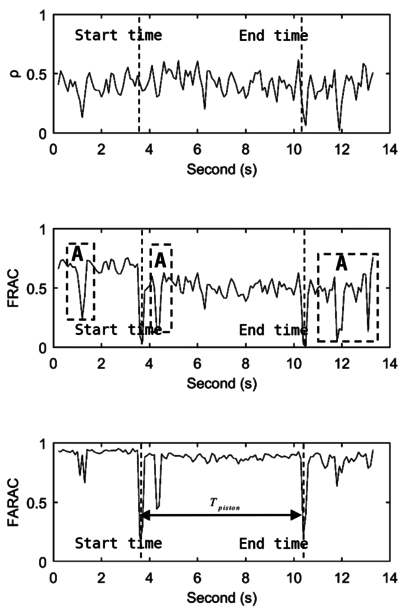
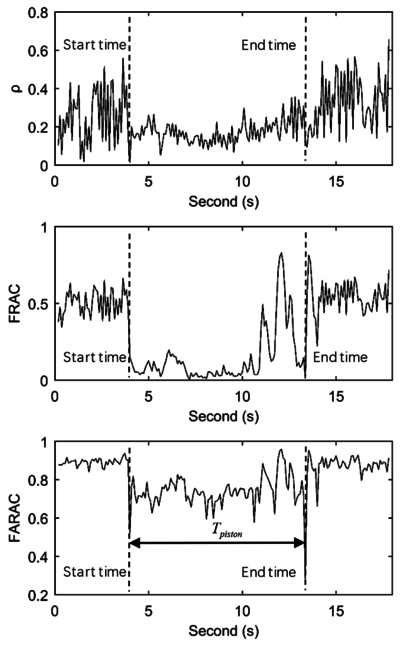
For axial flow fan with piston wind, the correlation coefficient (), FRAC, and FARAC are calculated and shown in Figure 7. The correlation coefficient () performance is very poor, which can not detect the start time and end time of piston wind. FRAC has a better performance than correlation coefficient, but it is usually fault detection that there are some confused low similarity index time as shown region A. The proposed FARAC exactly detects the start time and end time of piston wind effect, and the piston wind last time is shown in the figure. In addition, the FARAC shows the stable and effective performance.
|
| Figure 7. Method comparison in axial flow fan with piston wind: , FRAC and FARAC |
4.1.2 Case 2: Axial flow fan with bolt looseness
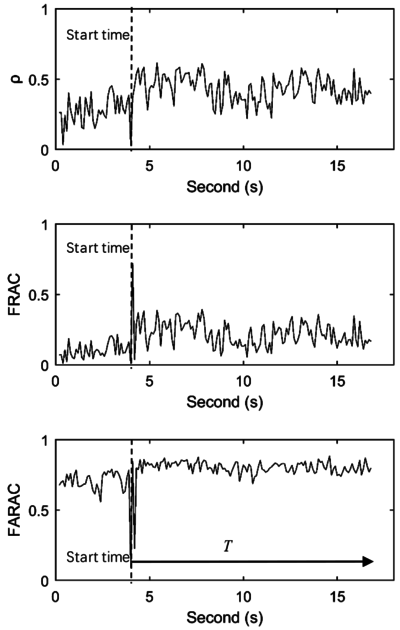
Besides the piston wind, fault detection is another key issue. In axial flow fan fault experiment, the bolt looseness is set up. Based on the similarity estimate method, the fault is detected. The vibration data is acquired from acceleration sensors in axial flow fan fault experiment. Correlation coefficient (), FRAC and proposed FARAC are calculated and shown in Figure 8. Correlation coefficient () and FRAC show very poor performance that both method can’t detect the start time exactly. From the FARAC detection and the sudden signal last time, the axial flow fan can be detected with fault by proposed method. From the results, similarity indexes have some fluctuation in start and end time, which caused by the instability of the flow.
|
| Figure 8. Method comparison in axial flow fan with bolt looseness: , FRAC and FARAC |
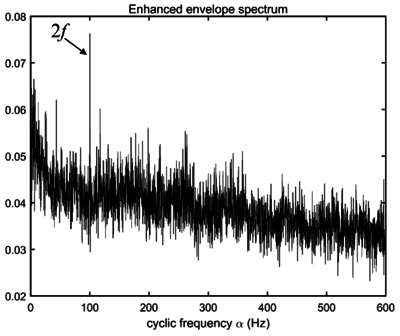
The bolt looseness fault can be detected by proposed FARAC method. However, for fault diagnosis, fault feature can be used as criterion for detail fault diagnosis. The axial flow fan normal working condition enhanced envelop spectrum (EES) is shown in Figure 9, which can be calculated by Eq.(16). In EES, labeled cyclic frequency is the characteristic frequency axial flow fan in normal working condition, in which is the shaft frequency.
|
| Figure 9. Enhanced envelop spectrum of axial flow fan in normal working condition |
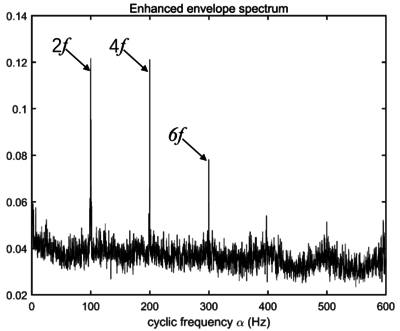
The EES of bolt looseness is shown in Figure 10. It shows that the labeled cyclic frequencies alpha= , , are the characteristic frequencies of axial flow fan in bolt looseness fault. Compared with the EES of normal condition in Figure 9, the bolt looseness fault with axial flow fan can be effectively diagnosed by cyclic feature extraction.
|
| Figure 10. Enhanced envelop spectrum of axial flow fan in bolt looseness fault |
4.2 Experiments for jet fan
Feature extraction method is an important part of proposed method, which can be used for fault diagnosis. The performance of the feature extraction method described in previous section is investigated using measured data in this section.
4.2.1 Case 1: Jet fan with piston wind effect
In addition to the axial flow fan, jet fan is another important equipment in ventilation system. Due to the suspending installation, piston wind has more serious effect than axial flow fan. Correlation coefficient (), FRAC and proposed FARAC are calculated and shown in Figure 11. From the results, correlation coefficient and FRAC show poor performance. Both method can not detect start time and end time exactly. During the piston wind condition, correlation coefficient and FRAC also have worse performance than the proposed FARAC. Whereas, by the proposed FARAC, the piston wind can be detected exactly and also can be got.
|
| Figure 11. Method comparison in jet fan with piston wind: , FRAC and FARAC |
4.2.2 Case 2: Jet fan with bolt looseness
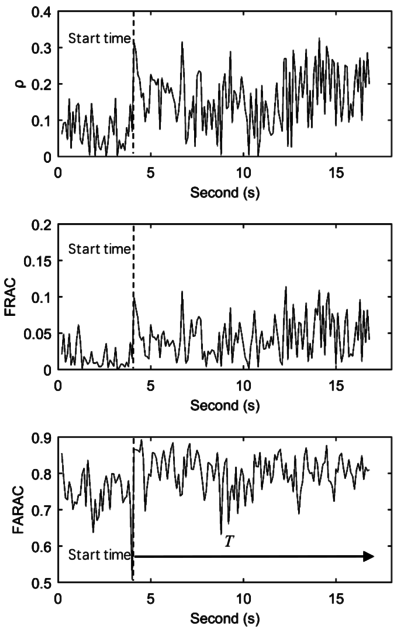
For jet fan fault detection, correlation coefficient (), FRAC and proposed FARAC are calculated and shown in Figure 12. Both correlation coefficient () and FRAC can’t detect the bolt looseness start time. But proposed FARAC can detect it exactly. From the start time, duration time satisfies , the bolt looseness is detected by proposed method.
|
| Figure 12. Method comparison in jet fan with bolt looseness: , FRAC and FARAC |
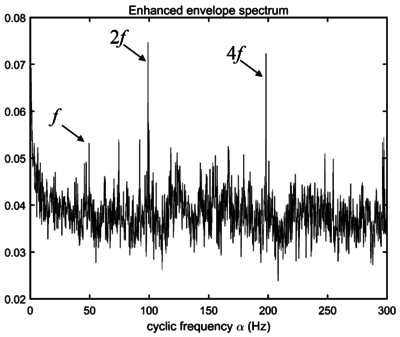
For jet fan, the EES of normal working condition is calculated by Eq.(16) and shown in Figure 13. It shows that the labeled cyclic frequencies alpha= , and can represent the characteristic frequencies of jet fan in normal working condition.
|
| Figure 13. Enhanced envelop spectrum of jet fan in normal working condition |
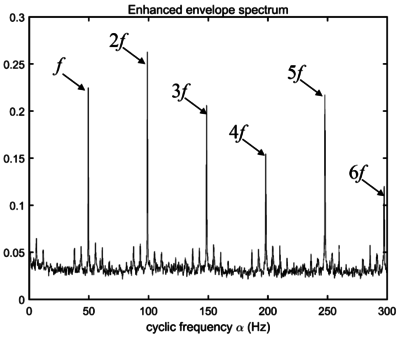
For the jet fan in bolt looseness fault, the EES is calculated and shown in Figure 14. The labeled cyclic frequencies alpha= , , , , and are charactristic frequencies for jet fan in bolt looseness fault. Compared with the EES of normal condition in Figure 13, the bolt looseness fault with jet fan can be effectively diagnosed by cyclic feature extraction. In addition, the cyclic frequencies of bolt looseness fault for jet and axial flow fans are different to each other. Moreover, cyclic feature extraction can be extended for fault diagnosis.
|
| Figure 14. Enhanced envelop spectrum of jet fan in bolt looseness fault |
5. Conclusions
In this paper, a feature extraction method of subway fan under piston wind effect is proposed. Similarity estimate method and cyclostationary analysis are two key techniques for CMM-PWD method. The presented method is validated through in lab-scale experiments of axial flow fan and jet fan. For piston wind detection, the proposed frequency amplitude response assurance criterion (FARAC) has better performance than the conventional methods such as the correlation coefficient and frequency response assurance criterion (FRAC). For fan feature extraction, the cyclostationary analysis was employed to inspect the railway fan fault. Moreover, two typical experiments of fan bolt looseness are set up to verify the proposed CMM-PWD method. Results show that the magnitudes of the cyclic frequency components are able to reveal the spectral characteristics of subway fans, and such magnitudes keep the similar trends with potential faults. The proposed method provides an alternative way to realize the fast and effective condition monitoring of railway fans under piston wind effect, which can be extended to detect other background interference and typical faults.
Acknowledgements
The authors gratefully acknowledge the financial supports of the National Key R&D Plan of China (No. 2016YFF0203300), the Plan of Guidance and Cultivation for Young Innovative Talents of Shandong Province. Authors appreciate valuable helps for the experiment support from the Zhejiang Shang Feng Gao Ke Co.Ltd.
References
[1] Xue P., You S., Chao J., Ye T. Numerical investigation of unsteady airflow in subway influenced by piston effect based on dynamic mesh. Tunn. Undergr. Sp. Technol., 40:174–181, 2014. https://doi.org/10.1016/j.tust.2013.10.004.
[2] Eftekharian E., Dastan A., Abouali O., Meigolinedjad J., Ahmadi G. A numerical investigation into the performance of two types of jet fans in ventilation of an urban tunnel under traffic jam condition. Tunn. Undergr. Sp. Technol., 44:56–67, 2014. https://doi.org/10.1016/j.tust.2014.07.005.
[3] López González M., Galdo Vega M., Fernández Oro J.M., Blanco Marigorta E. Numerical modeling of the piston effect in longitudinal ventilation systems for subway tunnels. Tunn. Undergr. Sp. Technol., 40:22–37, 2014. https://doi.org/10.1016/j.tust.2013.09.008.
[4] Huang Y.D., Gao W., Kim C.N. A numerical study of the train-induced unsteady airflow in a subway tunnel with natural ventilation ducts using the dynamic layering method. J. Hydrodyn., 22:64–172, 2010. https://doi.org/10.1016/S1001-6058(09)60042-1.
[5] Kim J.Y., Kim K.Y. Experimental and numerical analyses of train-induced unsteady tunnel flow in subway. Tunn. Undergr. Sp. Technol., 22:166–172, 2007. https://doi.org/10.1016/j.tust.2006.06.001.
[6] Ni J.Q., Liu S., Lopes I.M., Xie Q., Zheng P., Diehl C.A. Monitoring, modeling, and characterizing single-speed ventilation fans for an animal building. Build. Environ., 118:225–233, 2017. https://doi.org/10.1016/j.buildenv.2017.03.036.
[7] Wang L., Tao H., Du X., Dai R., Huang C. Theoretical modeling of the platform piston wind wall jet using field measurements and model testing. Tunn. Undergr. Sp. Technol., 45:1–9, 2015. https://doi.org/10.1016/j.tust.2014.08.002.
[8] Zarei J., Tajeddini M.A., Karimi H.R. Vibration analysis for bearing fault detection and classification using an intelligent filter. Mechatronics, 24:151–157, 2014. https://doi.org/10.1016/j.mechatronics.2014.01.003.
[9] Pezzani C., Bossio G., De Angelo C. Winding distribution effects on induction motor rotor fault diagnosis. Mechatronics, 24:1050–1058, 2014. https://doi.org/10.1016/j.mechatronics.2013.09.008.
[10] Song Y., Liu J., Chu N., Wu P., Wu D. A novel demodulation method for rotating machinery based on time-frequency analysis and principal component analysis. J. Sound Vib., 442:645–656, 2019. https://doi.org/10.1016/j.jsv.2018.11.024.
[11] Song Y., Liu J., Cao L., Chu N., Wu D. Robust passive underwater acoustic detection method for propeller. Appl. Acoust., 148:151–161, 2019. https://doi.org/10.1016/j.apacoust.2018.12.024.
[12] Chang C.F., Chen J.J. Vibration monitoring of motorized spindles using spectral analysis techniques. Mechatronics, 19:726–734, 2009. https://doi.org/10.1016/j.mechatronics.2009.02.009.
[13] Wang X., Makis V., Yang M. A wavelet approach to fault diagnosis of a gearbox under varying load conditions. J. Sound Vib., 329:1570–1585, 2010. https://doi.org/10.1016/j.jsv.2009.11.010.
[14] Lei Y., Lin J., He Z., Zuo M.J. A review on empirical mode decomposition in fault diagnosis of rotating machinery. Mech. Syst. Signal Process., 35:108–126, 2013. https://doi.org/10.1016/j.ymssp.2012.09.015.
[15] Moorea K.J., Kurt M., Eriten M., McFarlan D.M., Bergman L.A., Vakakis A.F. Wavelet-bounded empirical mode decomposition for measured time series analysis. Mech. Syst. Signal Process., 99:14–29, 2018. https://doi.org/10.1016/j.ymssp.2017.06.005.
[16] Antoni J. Fast computation of the kurtogram for the detection of transient faults. Mech. Syst. Signal Process., 21:108–124, 2007. https://doi.org/10.1016/j.ymssp.2005.12.002.
[17] Kim H., Koo B., Sun X., Yoon J.Y. Investigation of sludge disintegration using rotor-stator type hydrodynamic cavitation reactor. Sep. Purif. Technol., 240:116636, 2020. https://doi.org/10.1016/j.seppur.2020.116636.
[18] Sun X., Liu J., Ji L., Wang G., Zhao S., Yoon J.Y., Chen S. A review on hydrodynamic cavitation disinfection: The current state of knowledge. Sci. Total Environ., 737:139606, 2020. https://doi.org/10.1016/j.scitotenv.2020.139606.
[19] Antoni J. The infogram : Entropic evidence of the signature of repetitive transients. Mech. Syst. Signal Process., 74:73–94, 2016. https://doi.org/10.1016/j.ymssp.2015.04.034.
[20] Antoni J. Cyclostationarity by examples. Mech. Syst. Signal Process., 23:987–1036, 2009. https://doi.org/10.1016/j.ymssp.2008.10.010.
[21] Antoni J., Xin G., Hamzaoui N. Fast computation of the spectral correlation. Mech. Syst. Signal Process., 92:248–277, 2017. https://doi.org/10.1016/j.ymssp.2017.01.011.
[22] Serrà J., Arcos J.L. An empirical evaluation of similarity measures for time series classification. Knowledge-Based Syst., 67:305–314, 2014. https://doi.org/10.1016/j.knosys.2014.04.035.
[23] Shin K., Lee S.-H. Machinery fault diagnosis using two-channel analysis method based on fictitious system frequency response function. Shock Vib., 2015:1–7, 2015. https://doi.org/10.1155/2015/561238.
[24] Shin K. An alternative approach to measure similarity between two deterministic transient signals. J. Sound Vib., 371:434–445, 2015. https://doi.org/10.1016/j.jsv.2016.02.037.
Document information
Published on 03/07/20
Accepted on 24/06/20
Submitted on 25/05/20
Volume 36, Issue 3, 2020
DOI: 10.23967/j.rimni.2020.06.004
Licence: CC BY-NC-SA license
Share this document
Keywords
claim authorship
Are you one of the authors of this document?