Abstract
A questionnaire study was conducted to investigate the soundscape preferences of the sonic environment in Cairo. Participants, who were Cairo residents, were questioned about their appraisal of familiar urban soundscapes in a close- and open-ended format questionnaire.
Psycholinguistic data analysis of verbal descriptions expressed by respondents was conducted to identify the relevance of semantic categories of environmental sounds and quantitative soundscape aspects for the urban sonic environment of Cairo. Results confirmed a direct relevance of the linguistic semantic auditory judgment and of the outputs of the quantitative close-ended questions. Cairenes were also found to express their sonic environment linguistically based on physical properties rather than semantic features and values.
Analyzing the relative annoyance increase (RAI ) of the close-ended part, overall positive RAI values for all sound categories reveal how sensitive to noise Cairo residents are. Results further showed that at an RAI value of approximately 27%, sound category perception transforms from positive to negative.
Keywords
Acoustics ; Soundscape ; Sound preference
1. Introduction
Parallel to the random increase in population densities and the lack of adequate strategic city planning, the rethinking of urban spaces from an ecological viewpoint is necessary (Selle, 1992 ). Noise poses a multitude of health and safety concerns on such aspects as productivity, comfort, and functionality. Sound quality is considered a key contributor to the development and enhancement of the ecological/sustainable quality of open urban spaces (Mostafa Refat, 2013 ; Kang, 2006 ; Brown and Muhar, 2004 ).
The quality of our surrounding sound environment, that is, the soundscape, is largely dependent on the social circumstances and perception of listeners, which determine who gets to hear what (Schaudinischky, 1976 ; Thompson, 2002 ; Corbin, 1999 ; Truax, 2001 ; Dubois, 2000a ; Gaver, 1993 ).
Soundscape, also called acoustic landscape, is a combination of the physical environment, which is represented in terms of acoustical scientific characteristics of sound waves, and a social environment dimension, which is represented by human perception of sound. Soundscape occurs when one perceives the surrounding sonic environment with his/her hearing, where a sound is a basic element in the “scape” (Schafer, 1994 ). The human perception of sound is a subjective process that relies on cognitive processes, in which sound and noise are the determining factors (Dubois et al., 2006 ). Numerous studies have been conducted to assess the subjective evaluation of background noise (Berglund et al ., 2001 ; Schulte-Fortkamp, 2002 ; Schultz, 1978 ; Schultz, 1982a ; Botteldooren and Verkeyn, 2002 ; Job, 1988 ). These studies evaluate soundscape elements in terms of sound levels. Conversely, considerable work was developed to assess the aural esthetic qualities that reflect listener satisfaction (Yang and Kang, 2005a ; Yang and Kang, 2005b ) as well as to assess individual sounds (Westerkamp, 2000 ). The physical effect of sound on human health has also attracted the attention of numerous researchers (Berglund et al ., 1999 ; Schulte-Fortkamp, 2002 ; Schultz, 1982b ), who assessed the dependence of noise and other physical health factors, particularly considering the ever-increasing community noise since the industrial revolution.
Studies related to sound preferences in urban areas are rather limited. However, related research shows that sound preferences from the perspective of listeners is affected by factors related to physical and social aspects (Southworth, 1969 ; Berglund et al ., 2001 ; Sémidor, 2006 ). Environmental psychologists revealed that the attributes of social/cultural factors and the second group of explicit attributes of physical surroundings are related to and directly affect human perception of sound (Robert, 1997 ; Bell et al ., 1996 ).
In this study, the sound preference of the inhabitants of Cairo, Egypt was systematically examined based on a series of large-scale surveys. Factors influencing inhabitant preference evaluation were also examined. Results are expected to be useful for suitable soundscape design and for enhancing sonic perception in urban public spaces. In the future, the data will be used to formulate input variables for a soundscape prediction model based on artificial neural networks (Yu and Kang, 2005a ; Yu and Kang, 2005b ; Yu and Kang, 2006 ).
2. Current noise annoyance in Greater Cairo
This study examines the noise preference of residents of Greater Cairo, the capital of Egypt and the fourth largest city in the world. Noise problems arose in Egypt in the late 1970s because of population increase stemming from internal immigration, accelerated growth, and the increasing number of vehicles, which added to the overcrowded streets (Ali and Tamura, 2001a ; Ali and Tamura, 2001b ; Ali and Tamura, 2002 ; Reports of Minster of Egyptian Transportation about road traffic in Greater Cairo, 2001 ) 996 population was estimated to be 18 million. The urban built-up areas are used as tourist centers; commercial, administrative, cultural, and educational institutions; business establishments; governmental offices; and hotels. These areas consequently create dense and mixed work patterns. The old districts in Cairo exhibit a high density of population, estimated to be approximately 150,000 persons/km2 .
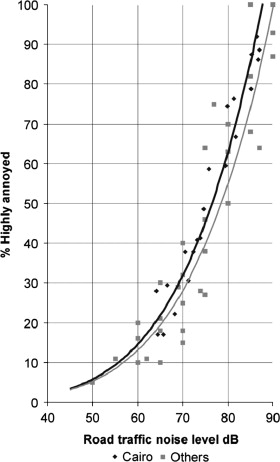
In previous studies (Ali and Tamura, 2001a ), the annoyance of greater Cairo populations was compared among 11 surveys, including London Streets, Paris Streets, U.S. Streets, Swiss Roads, and others (Schultz, 1982a ; Miguel and Garcia, 1998 ). Annoyance in Cairo was found to be slightly higher than that in other cities. Patterns extracted from the surveys in Greater Cairo generally agree with annoyance in other surveys conducted in other cities. A strong relationship was observed between the percentage of respondents who felt “highly annoyed” and the increase in road traffic noise level, as shown in Figure 1 .
|
|
|
Figure 1. Comparison of annoyance in Cairo with annoyance found in other studies including the Schultz study (in London Street, Paris Street, U.S. Street, Swiss road, and others) and in Pamplona, Spain. |
Results from Figure 1 show that people living in Greater Cairo became more sensitive to nuisance than those living in any other city. A sound preference study is revealed to be important in such a dense, crowded, and highly active environment.
3. Methodology
Recent research outlines how soundscape can have an improved effect at the local level (Tjeerd et al., 2013 ) and how urban planners can design for health and pleasant experiences. The effect of audiovisual components merged with street urban sounds was recently examined by Jeon et al. (2013a) . An experiment was conducted to investigate the effect of water features and vegetation on preferences and environmental qualities. The effect was evaluated using a numerical scale and 12 pairs of adjectives. The experiment showed that bird sound was the most preferred among the natural sounds, whereas the sound of water features was found to degrade the soundscape quality. A soundwalk procedure (Jeon et al ., 2013a ; Jeon et al ., 2013b ) was conducted on a group of 30 [15 architects and 15 acousticians] participants. Results revealed that soundscape perceptions and preference were dominated by openness, visual images, and acoustic comfort.
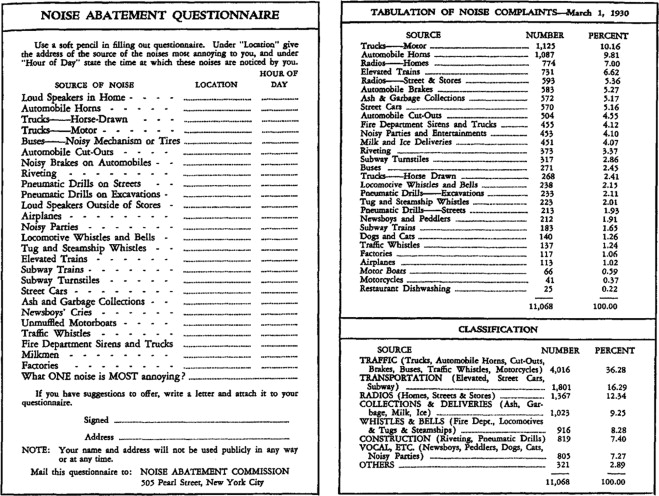
Soundscape research started early. In 1930, the Noise Abatement Commission of New York made clear that the soundscape of the city is no longer dominated by sounds of animals and humans but by noise from new modern technology sources (Brown et al. (1930) ). Edward Brown et al. conducted a noise survey in 1930. This survey was distributed via the metropolitan newspaper. Responses submitted by readers confirmed that the vast majority of noises that plagued New Yorkers were caused by modern technological inventions. The survey results are shown in Figure 2 .
|
|
|
Figure 2. Questionnaire distributed in 1930 via the metropolitan newspaper. |
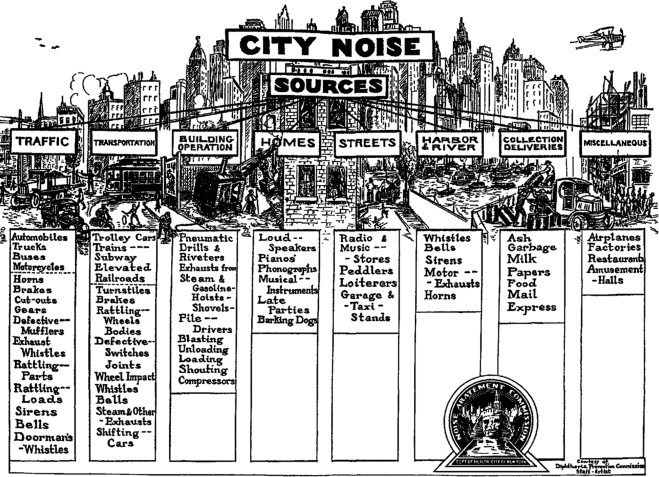
Edward Brown et al. (1930) categorized city noise sources according to the presence and location of the noise source, as well as activity performed. Thus, the categories came in the form of traffic, transportation, building operation, homes, streets, harbor and river, collection and deliveries, as well as miscellaneous sources. In 1930, Brown presented in his work a pictorial presentation of noise sources, as shown in Figure 3 .
|
|
|
Figure 3. Edward Brown et al., Soundscape of the modern city, New York Department of Health 1930. |
In 1977, Murray Schafer (1994) introduced a card catalog of noise sources presented through a framework in which information was gathered about past soundscapes through ear witness accounts by some volunteers. Schafer then constructed an extended card catalog that describes the soundscape in terms of literary, anthropological, and historical aspects. This categorization is shown in Table 1 .
| Natural sounds | Sounds of water | Oceans, seas and lakes |
| Rain | ||
| Rivers and brooks | ||
| Steam | ||
| Ice and snow | ||
| Sounds of air | Wind | |
| Sounds of earth | Trees | |
| Sounds of birds | Sparrow | |
| Sounds of insects | Flies | |
| Sounds of seasons | Spring | |
| Human sounds | Sounds of voices, body | Speaking |
| Sounds and societies | Town, urban, factories, domestic sounds, parks | – |
| Mechanical sounds | Machine, aircraft, constructions | – |
| Silence and quiet | – | – |
| Sound as indicators | Bell, horns, telephones |
In addition to its physical characteristics, noise may also be classified in several other ways, which leads us to reflect on some perceptual relations and gives rise to several questions. Why do people feel more annoyed when they hear the ringing of a telephone compared with the sound of a flute at the same volume and frequency spectrum? Why do people feel calm and relaxed when they hear the sound of birds in comparison with the sound of a siren with similar physical properties? Why do people appreciate sea sound more than mechanical noise even while they have similar physical properties?
These questions outline the considerable importance of the semantic properties of sound. These properties refer to the function of sound and its meaning and impact. These sounds are translated through channels of perceptual awareness accumulated by people over years of experience. In considering the various opinions and feelings held by different individuals toward similar sounds, classifying sounds according to esthetic qualities is essential.
Human perception of sounds can be easily affected by their personal experiences, working environments, and regional background. Thus, giving a definite suggestion on the esthetic classification of soundscapes is difficult. Although the study of this problem is considered to be too subjective to yield meaningful results, evaluating the effect of this problem on local inhabitants in various regions is necessary in this case. However, the present study is mainly focused on people living in Cairo, which is considered one of the noisiest and most overcrowded capitals worldwide.
The formulation of the questionnaires implemented in this study is adapted to this situation. Most questionnaires are closed on a number of specific known adjectives, which makes the differences difficult to assess.
Open-ended questionnaires were used in the psycholinguistic approach developed by the French National Railways Company. Such questionnaires were developed to address subjective appreciation. Results were then based on an analysis of words and free comments made by travelers (Mzali et al., 2000 ).
Verbal description analysis was conducted by Catherine Guastavino (2006) . The work included a psycholinguistic analysis to identify semantic categories of environmental sounds and relevant sound quality criteria for urban soundscapes. The analysis of the open-ended questionnaire revealed the salience of human sounds interpreted as indicators of human activities and are therefore meaningful constituents of urban soundscapes. Thus, the questionnaire used in this study will constitute two parts: a close-ended question part and an open-ended question part.
3.1. Questionnaire construction and analysis
Cairene residents who participated in the study cover a multitude of professionals with different experiences. As directly approaching the people involved is not a requirement, the questionnaires are administered online.
Questionnaires were completed anonymously and comprised two parts. The first part with closed questions intended to identify the population and preferences for Cairo urban noises as well as to assess the global sonic environmental comfort.
The participants approached with the questionnaire were from a range of social groups in terms of age, gender, occupation, educational level, and residential status (local or non-local with living experience in Cairo). A database was consequently established, with social attribute variables, including age ranges (1:18 to 24, 2:25 to 34, 3:35 to 44, 4:45 to 54, 5:55 to 64, and 6:65+ ), gender (male and female ), education (1, school; 2, under graduate; 3, post-graduate; 4, Masters; and 5, Ph.D. ), place of residence (1, on a main busy road and 2, inside a calm residential neighborhood ), living on which floor (1:0 to 2, 2:3 to 5, 3:6 to 8, 4:9 to 11, and 5, above 11), and living in which Cairo district (category according to district names ). A summary of the database is shown in Table 2 .
| Factors | Classification and scale |
|---|---|
| Age | (1) 18 –24; (2) 25 –34; (3) 35 –44; (4) 45 –54; (5) 55 –64; (6) 65+ |
| Gender | (1) Male (2) Female |
| Education Level | (1) School; (2) Under graduate; (3) Graduate; (4) Postgraduate; (5) Master; (6) Ph.D. |
| Years living in Cairo | (1) 0 –5; (2) 6 –10; (3) 11 –15; (4) above 15 |
| Living where | (1) On a main busy road; (2) Inside a calm residential neighborhood |
| Living on which floor | (1) 0 –2; (2) 3 –5; (3) 6 –8; (4) 9 –11; (5) above 11 |
| Living in which Cairo district | Category according to district names |
In the first close-ended part, the participants were invited to select the factors or criteria that, in their opinion, needed particular improvement or are mostly causing nuisance. The noise sources are divided according to the categorization of city noise sources by Edward Browns et al. (1930) . The various noise sources examined in the questionnaire are listed in Table 3 .
| Cairo urban noise classification | |||||
|---|---|---|---|---|---|
| People | Nature | Traffic | Transportation | Collective deliveries | Construction sites |
| Voices | Wind | Automobiles | Airplanes | Garbage | Pneumatic drills |
| Children | Water | Trucks | Trains | Food | |
| Footsteps | Natural | Buses | Subways | Mechanical operations | |
| Human sounds | Elements | Motorcycles | Elevated bridges | ||
| Neighbors | Rain | Horns | Shouting | ||
| Pedestrians | Parks | Brakes | Compressors | ||
| Cellular phones | Birds | ||||
| Angry people | |||||
| Market | |||||
| Cafe | |||||
Noise sources are classified under six main categories according to the nature, type, and activity. The six categories are people, nature, traffic, transportation, collective deliveries, and construction sites.
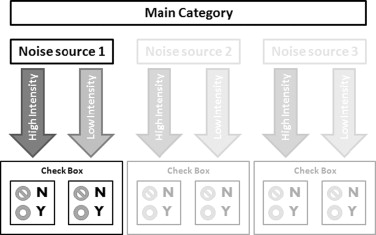
The subjective loudness of the noise activity is also examined. The questions are laid out such that the participant can discriminate whether the type of noise is acceptable at both low and high intensities, at low intensities only, or of both scenarios are unacceptable. Thus, some sounds can be acceptable if the level is low. In some cases where the type of sound is semantically perceived, sounds can be acceptable at both high and low levels. The selection process is shown in Figure 4 .
|
|
|
Figure 4. Decision flow in the closed ended question of the questionnaire. |
According to the above criteria, the participants were asked to select their choices based on their experience and perception of different noises categorized in the first part of the questionnaire. Results are expected to reflect the opinion of Cairo residents about their own soundscape based on their perception and on the effect of the local sonic environment.
The second part of the questionnaire addressed acoustic comfort and adopts open-ended questions (i.e., to be answered with a written sentence or short statement). The participants were invited to express their opinion on the preferable nature of their sonic environment and origin of perceived noises, as well as to enumerate the most uncomfortable noise sources. The following questions were asked:
What would be the ideal urban soundscape from your point of view?
What do you find pleasant/unpleasant in your urban sonic environment?
In your urban environment, are there high-pitched [treble]/low-pitched [bass] sounds? If so, describe these sounds.
Do you perceive background noise in urban environments? If so, under which circumstances? How would you describe such noise?
In urban areas, are you sensitive to transportation noise? Describe the characteristics of such noise.
How would you describe the future of Cairo’s soundscape? Describe the characteristics of this soundscape.
Two lines for free comment were provided for the participants to express acoustic comfort and discomfort issues linguistically. A psycholinguistic analysis of spontaneous verbal descriptions was conducted to identify semantic categories of environmental sounds and relevant sound quality criteria for urban soundscapes.
The questionnaire was hosted by a survey engine over the internet and distributed through social networks. A large number of responses were collected and analyzed.
4. Results
4.1. First part: Close-ended questions
The statistical analysis of participants is shown in Table 4 .
| Factors | Classification and scale | Percentage (%) |
|---|---|---|
| Age | (1) 18–24; | 48.89 |
| (2) 25–34; | 20.74 | |
| (3) 35–44; | 14.81 | |
| (4) 45–54; | 6.67 | |
| (5) 55–64; | 6.67 | |
| (6) 65+ | 2.22 | |
| Gender | (1) Male | 52.59 |
| (2) Female | 47.41 | |
| Education level | (1) School; | 0.00 |
| (2) Under graduate; | 38.52 | |
| (3) Graduate; | 11.11 | |
| (4) Postgraduate; | 14.81 | |
| (5) Master; | 11.85 | |
| (6) Ph.D. | 23.70 | |
| Years living in Cairo | (1) 0–5; | 10.37 |
| (2) 6–10; | 8.15 | |
| (3) 11–15; | 1.48 | |
| (4) above 15 | 80.00 | |
| Living where | (1) On a main busy road; | 41.48 |
| (2) Inside a calm residential neighborhood | 58.52 | |
| Living on which floor | (1) 0–2; | 39.26 |
| (2) 3–5; | 42.22 | |
| (3) 6–8; | 13.33 | |
| (4) 9–11; | 2.96 | |
| (5) above 11 | 2.22 | |
| District | Percentage of people living | |
| Nasr City, Heliopolis | 44.44 | |
| New Urban Developments [i.e. New Cairo, 6 of October, El Sherouk, etc.] | 17.04 | |
| Mohandeseen, Dokki | 8.15 | |
| West Elbalad | 4.44 | |
| Maadi | 5.18 | |
| Shoubra | 2.96 | |
| Ain Shams AlSharqia (Gesr El Sues) | 2.22 | |
| Mokattam | 1.48 | |
| Other districts | 14.06 | |
The sample of participants is in the middle age groups, and more than 70% of the sample is between 18 and 34 years old, which indicate that the respondents possess sufficient intellectuality and maturity to judge and rarely suffer from any hearing losses that can affect the study. The participant sample is equally distributed between males and females. Moreover, 100% of the people answering the questions are educated, which enables them to understand, analyze, and judge their surrounding sound environment. The districts in which more than 70.36% of the participants live are located on the east banks of the Nile River, which runs through the middle of Cairo. The east part houses the main Cairo airport and thus has higher densities of air traffic volumes, such that people can judge aircraft noise.
The following question was asked about the various noise sources listed in Table 3 .
Please indicate whether you perceive the following sounds if heard in your environment :
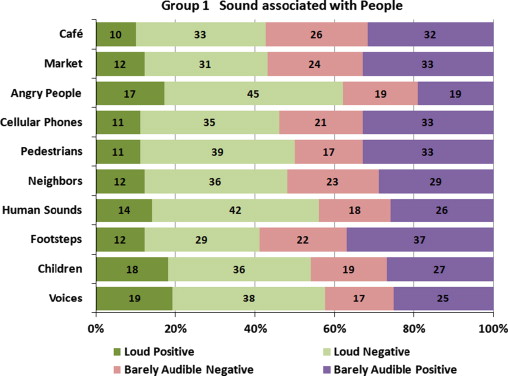
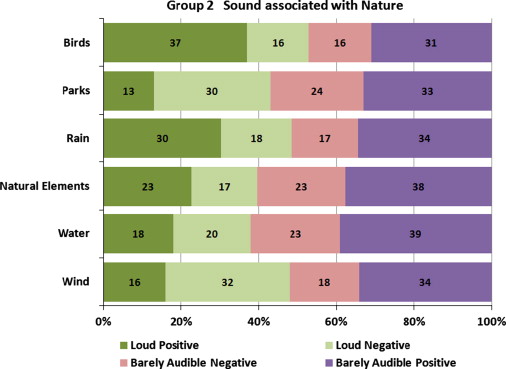
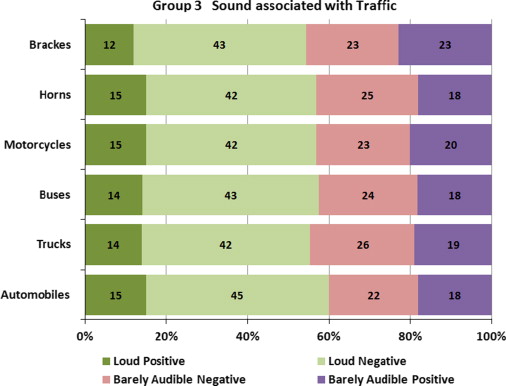
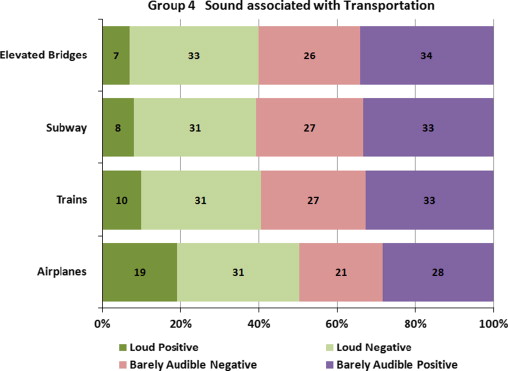
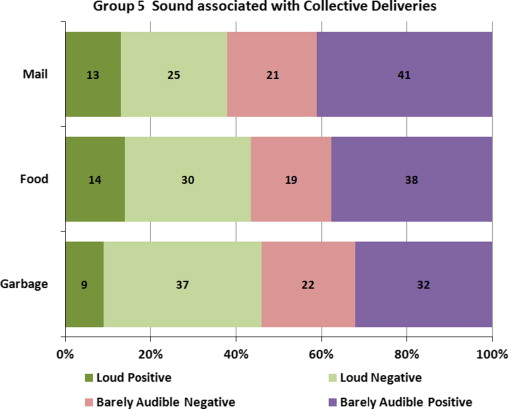
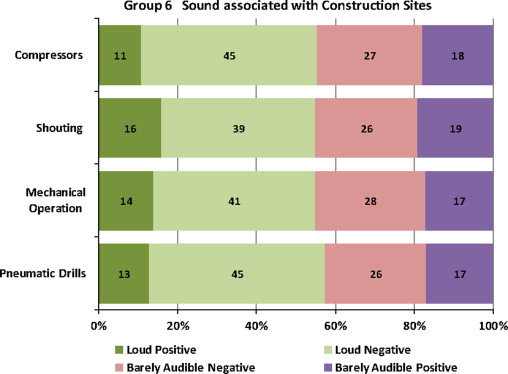
The questionnaire results are shown in Figure 5 , Figure 6 , Figure 7 , Figure 8 , Figure 9 ; Figure 10 for all the six sound groups.
|
|
|
Figure 5. Questionnaire results for sound associated with peoples. |
|
|
|
Figure 6. Questionnaire results for sound associated with nature. |
|
|
|
Figure 7. Questionnaire results for sound associated with traffic. |
|
|
|
Figure 8. Questionnaire results for sound associated with transportation. |
|
|
|
Figure 9. Questionnaire results for sound associated with collective deliveries. |
|
|
|
Figure 10. Questionnaire results for sound associated with construction sites. |
For loud categories, most sound groups were perceived as negative, except for sounds associated with nature. This result shows that all artificially generated sounds are not preferred by Cairo residents. An important finding is that sounds associated with human stimulations or those that facilitate the recall of visual interaction and allocation of position had a positive preference when barely audible at low sound intensities. Groups of sounds generated by people, nature, transportation, and collectives and deliveries show that people in Cairo tend to feel safer when such types of sounds can be heard and allocated without annoyance. The reason for this effect is either to allocate nearby human activities or to detect patterns of transportation and early arrival of deliveries, which is part of the Egyptian semantics and character.
The goal behind examining the effect of the noise level on the perception of Cairo residents is to assess to which extent the desirable sound is transformed to noise (undesirable sound), and vice versa. This assessment will reveal some important characteristics of various sounds within the sonic environment of Cairo and consequently reflect the perception of local people.
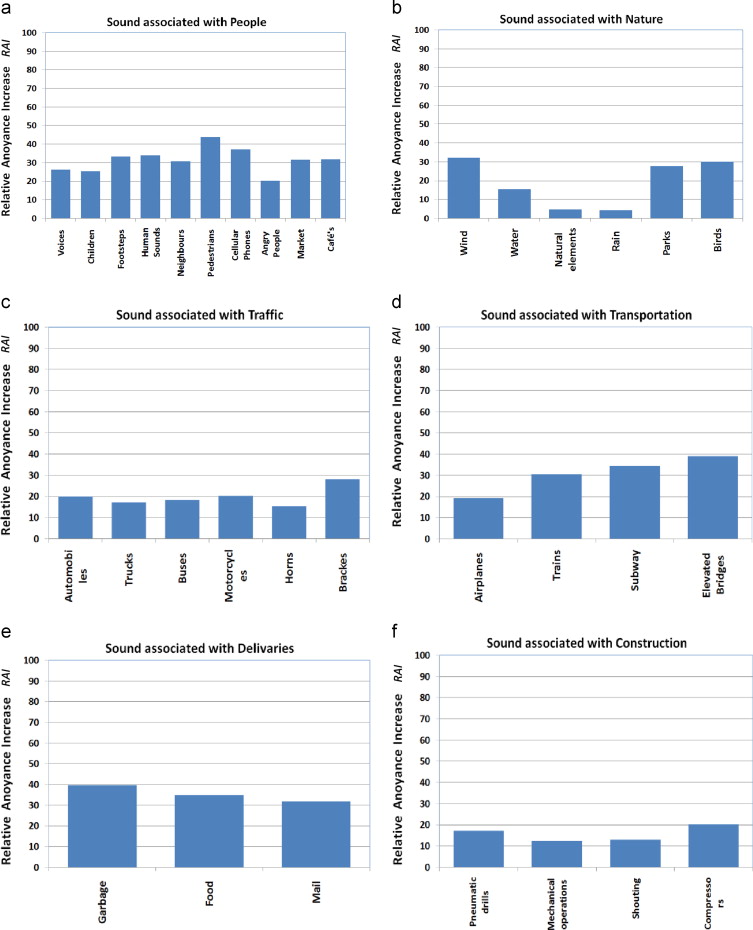
Figure 11 shows the relative annoyance increase (RAI ). The RAI represents the percentage increase of annoyed people with increasing intensity, normalized to the percentage of people annoyed by the same sound when barely audible.
|
|
|
Figure 11. Relative annoyance increase for various sound sources. |
The overall positive RAI indicates the sensitivity of Cairo residents, as shown in Figure 1 , where the percentage of highly annoyed people in Cairo is always greater than that in other cities. Thus, a higher percentage of people perceive higher sound intensities as a negative response, even for sounds for which barely audible intensity was regarded as positive.
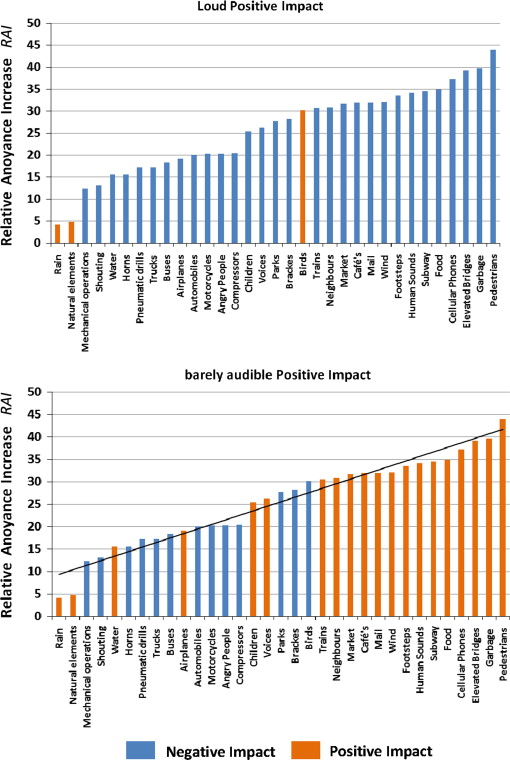
Figure 12 shows the RAI in increasing order for all types of urban sounds. The figure on top indicates sounds that had a positive effect on Cairo residents. These sounds are clearly stimulated by natural elements, such as rain, birds, and so on. Based on the analysis, Cairenes perceive nature sounds as friendly and in rhythmic harmony. Higher values of the RAI can be found for sound sources with a barely audible positive perception, which is in accordance with the changing nature of perception or the switching from positive to negative perception. The trend line in the figure on the bottom shows that an RAI of approximately 27% and higher, which represents a perception change from positive to negative. This assumption depends on the number of samples analyzed and the accuracy of the questionnaire data. Thus, further work is needed to justify this finding.
|
|
|
Figure 12. The examined sound in increasing RAI order, in terms of positive impact for loud and barely audible intensities. |
4.2. Second part: Open-ended psycholinguistic analysis
In this part, the participant responses to the open-ended questions are analyzed in terms of the linguistic representation of the soundscape of Cairo residents. Mental representations of urban soundscapes cannot be easily analyzed quantitatively. One way to study these aspects is through analyzing verbal reports, which enables the assessment of how people express their sensory experiences. However, the lack of basic lexicalized terms, particularly for non-native English speakers, and a priori established categories for acoustic phenomena, leaves the relationship between cognitive representations and linguistic expressions unclear. Thus, language descriptors are agreed to be a spontaneous descriptor of sound and noises (Dubois, 2000b ). An objective linguistic analysis of complex words and statements, rather than a mere lexical analysis of isolated words, will be employed by the author to identify positive and negative effects as well as to identify whether linguistic statements in open-ended questions are in accordance with quantitative close-ended question part of the questionnaire.
The most outstanding responses will be categorized in terms of source and soundscape-related answers. Some of the answers are shown in Table 5 .
| Source related | Soundscape related |
|---|---|
| What would be the ideal Urban Sound-scape from your point of view? | |
|
|
| What do you find pleasant/unpleasant in your urban sonic environment | |
|
|
| In your urban environment, are there high-pitched [treble]/low-pitched [bass] sounds? If so, describe them | |
|
|
| Do you perceive background noise in urban environments? If so, under which circumstances? How would you describe it? | |
|
|
| In urban areas, are you sensitive to transportation noise? Describe its characteristics? | |
|
|
| How would you describe the future of Cairo’s Soundscape? Describe its characteristics? | |
|
|
The ideal soundscape was primarily described in terms of technical solutions, based on peoples knowledge, such as sound-proof structures, noise-oriented planning, or moving away to quieter outskirts. This result reflects the Cairene awareness of the acts and remedies that should be considered to mitigate high noise levels in the great capital. The representation is rather based on perceptual abstracts than on the semantic properties of sounds. The most common linguistic devices in the transportation category were denominations of the sources (“cars, motorcycles, and horns”), nominal groups constructed on sources (“sound of a car”), or the generic term “traffic” (“traffic noise”). Source descriptor lexicalized terms were used to describe human sounds (“voices” and “children playing”); this source confirms the lack of basic terms for expressing environmental sounds.
In the appraisal process of sound sources from the participant answers, linguistic expression was analyzed by considering enunciation and syntactic devices and not directly inferred from an intrinsic value of lexical items, such as when a negative construction was used (“without cars” or “less traffic”).
People do perceive background noise and can characterize the noise content and components. However, most responses are related to the contextual aspects or soundscape, such as when participants get accustomed to the continuing rhythm of background noise. Some people can ignore this soundscape. Negative judgments concerning the sources were inferred using descriptors of negative impact, such as the use of “pressing the horn in your ear” as an expression of a high volume of undesirable sound. Similarly, the use of positive terms of phrases was interpreted as pleasantness and positive judgments.
Agreement was found between negative and positive responses in the linguistic expressions of the open- and close-ended parts of the questionnaire, which supports the accuracy of participant responses in part one.
5. Conclusions
The analysis of the first close-ended questionnaire revealed that sources related to natural elements and not artificially generated are given a positive effect score by Cairo residents. This positive scoring is generally observed for sounds at low intensity and for selected natural sounds at high intensity, such as rain, birds, and other natural elements. Natural sounds that are related to negative semantic and emotional experiences, such as wind, were found to score negative results.
The RAI for sources that scored negative and positive effects at barely audible intensities was analyzed at high intensities. Results revealed that for all categories of sources, a positive RAI value was given. This positive scoring reflects the high sensitivity to annoyance that the Cairo residents have, particularly in relation to other cities. This finding is in accordance with previous work conducted in this area.
As regards the transfer of status from positive to negative response, a RAI value of 27% was given. Further investigations should be conducted to verify the aforementioned finding because of dependencies on questionnaire accuracy.
The analysis of the open-ended questions showed that auditory events and soundscapes are linguistically expressed through peoples memory of events and semantic experiences. These linguistic expressions are used to describe sounds reflecting interactions between people and their surrounding environments and how these events shape peoples perception.
Furthermore, the data on the verbal statements collected outline the fact that sounds are processed based on perceptual abstracted ones (physical properties), rather than semantic features, which suggests a shift from cognitive representations to physical descriptions of sounds for Cairo residents.
The second part of the questionnaire focuses on the linguistic representation of perceptual memory, rather than the processing of soundscapes. Results from the second part of the questionnaire are consistent with those of the first part. This condition outlines the importance and accuracy of semantic features associated with sound sources.
Moreover, results suggest that sounds reflecting human presence and activities related to natural elements are preferable and intimate components of the urban soundscape of Cairo. Thus, the ideal urban soundscape reflects natural life.
These subjective attributes of the soundscape serve a determining function in qualitative and quantitative judgments. Therefore, further investigation is needed to identify cognitive categories of sounds and relevant semantic features within each of the source categories.
References
- Ali and Tamura, 2001a Ali, S., Tamura, A., 2001a. Diagnostic study for traffic noise problems in Greater Cairo, Egypt. In: Proceeding of Inter-Noise, 27–30 August, The Hague, The Netherlands, pp. 1177–1181.
- Ali and Tamura, 2001b Ali, S., Tamura, A., 2001b. Road traffic & traffic noise problems in Greater Cairo, Egypt: characteristics, countermeasure taken and future plans. In: Proceeding of 17th International Congress on Acoustics. 4–6 September, Rome, Italy.
- Ali and Tamura, 2002 S. Ali, A. Tamura; Road traffic noise mitigation strategies in Greater Cairo, Egypt; Appl. Acoust., 63 (2002), pp. 1257–1263
- Bell et al., 1996 A.P. Bell, C.T. Greene, D.J. Fisher, A. Baum; Environmental Psychology; (4th ed.)Harcourt Brace College Publishers, Fort Worth (1996)
- Berglund et al., 2001 B. Berglund, C.A. Eriksen, M.E. Nilsson; Exploring the perceptual content in soundscapes; E. Sommerfeld, R. Kompass, T. Lachmann (Eds.), Fechner Day, Pabst Science Publishers, Lengerich (2001)
- Berglund et al., 1999 B. Berglund, T. Lindvall, D.H. Schwela; (1999) Guidelines for community noise. World Health Organization Report
- Botteldooren and Verkeyn, 2002 D. Botteldooren, A. Verkeyn; Fuzzy models for accumulation of reported community noise annoyance from combined sources; J. Acoust. Soc. Am., 112 (2002), pp. 1496–1508
- Brown et al., 1930 Edward F. Brown, et al.; City Noise; Department of Health, New York (1930)
- Brown and Muhar, 2004 A.L. Brown, A. Muhar; An approach to the acoustic design of outdoor space; Environ. Plan Manag., 47 (2004), pp. 827–842
- Catherine Guastavino, 2006 Catherine Guastavino; The ideal urban soundscape: investigating the sound quality of French cities; Acta Acust. United Acust., 92 (2006), pp. 945–951
- Corbin, 1999 A. Corbin; Village Bells: Sound and Meaning in the 19th-Century French Countryside; Papermac, London (1999)
- Dubois, 2000a D. Dubois; Categories as acts of meaning: the case in olfaction and audition; Cogn. Sci. Q., 1 (2000), pp. 35–68
- Dubois, 2000b D. Dubois; Categories as acts of meaning: the case of categories in olfaction and audition; Cogn. Sci. Q. (2000), pp. 35–68
- Dubois et al., 2006 D. Dubois, C. Guastavino, M. Raimbault; A cognitive approach to urban soundscape: using verbal data to access everyday life auditory categories; Acta Acust. United Acust. (2006), pp. 945–951
- Gaver, 1993 W. Gaver; What in the world do we hear? An ecological approach to auditory event perception; Ecol. Psychol. (1993), pp. 1–29
- Jeon et al., 2013a Jeon, Joo Young Hong, Jin Yong; Designing sound and visual components for enhancement of urban soundscapes; J. Acoust. Soc. Am., 134 (2013), pp. 2026–2036
- Jeon et al., 2013b Jin Yong Jeon, Joo Young Hong, Pyoung Jik Lee; Soundwalk approach to identify urban soundscapes individually; J. Acoust. Soc. Am., 134 (2013), pp. 803–812
- Job, 1988 R.S.F. Job; Community response to noise: a review of factors influencing the relationship between noise exposure and reaction; J. Acoust. Soc. Am., 83 (1988), pp. 991–1001
- Kang, 2006 J. Kang; Urban Sound Environment; Taylor & Francis Incorporating Spon, London (2006)
- Miguel and Garcia, 1998 A. Miguel, A. Garcia; A social survey on the effect of environment noise on the residents of Pamplona, Spain; Appl. Acoust. (1998), pp. 245–253
- Mostafa Refat, 2013 Ismail Mostafa Refat; Quiet environment: acoustics of vertical green wall systems of the Islamic urban form. 2; Front. Archit. Res., 2 (2013), pp. 162–177
- Mzali et al., 2000 Mzali, M., Dubois, D., Polack, J.-D., Letourneaux, F., Poisson, F., 2000. Nice, In: Proceedings of the 2000 Internoise Congress.
- Reports of Minster of Egyptian Transportation about road traffic in Greater Cairo, 2001 Reports of Minster of Egyptian Transportation about road traffic in Greater Cairo, 2001. 18/1/2001 and 28/6/2001, Al-Ahram Newspaper (Egyptian Newspaper).
- Robert, 1997 G. Robert; Environmental Psychology: Principles and Practice; (2nd ed.)Allyn and Bacon, Boston (1997)
- Schafer, 1994 R.M. Schafer; The Soundscape: Our Sonic Environment and the Tuning of the World; Destiny Books, Rochester (VT) (1994)
- Schaudinischky, 1976 H.L. Schaudinischky; Sound, Man and Building; Applied Science Publishers, London (1976)
- Schulte-Fortkamp, 2002 B. Schulte-Fortkamp; The meaning of annoyance in relation to the quality of acoustic environments; Noise Health, 4 (2002), pp. 13–18
- Schultz, 1978 TJ. Schultz; Synthesis of social surveys on noise annoyance; J. Acoust. Soc. Am., 64 (1978), pp. 377–405
- Schultz, 1982a T.J. Schultz; Community Noise Rating; Applied Science Publishers, London (1982)
- Schultz, 1982b Schultz, T.J., 1982b. Community Noise Rating. England, Applied Science.
- Selle, 1992 Selle, K., Vom sparsamen umgang zur vision offener räume. Werkbericht der Arbeitsgruppe Bestandsverbesserung. , Hannover und Dortmund; 1992: Werkbericht, vol. 29.
- Sémidor, 2006 C. Sémidor; Listening to a city with the soundwalk method; Acta Acust. United Acust., 92 (2006), pp. 959–964
- Southworth, 1969 M. Southworth; The sonic environment of cities; Environ. Behav., 1 (1969), pp. 49–70
- Thompson, 2002 E. Thompson; The Soundscape of Modernity: Architectural Acoustics and the Culture of Listening in America; MIT Press, Vol. Press, Cambridge (MA, London) (2002), pp. 1900–1933
- Tjeerd et al., 2013 C.Andringa Tjeerd, Miriam Weber, Sarah R. Payne, J.D. (Dirkjan) Krijnders, Maxwell N. Dixon, Robert v.d. Linden, Eveline G.L. de Kock, J. Jolie, L. Lanser; Positioning soundscape research and management; J. Acoust. Soc. Am., 134 (2013), pp. 2739–2747
- Truax, 2001 B. Truax; Acoustic Communication; (2nd ed.)Ablex Publishing, Norwood (NJ) (2001)
- Westerkamp, 2000 H. Westerkamp; Sound excursion: plano pilato, Brasilia. Soundscape; J. Acoust. Ecol., 1 (2000), pp. 20–21
- Yang and Kang, 2005a W. Yang, J. Kang; Soundscape and sound preferences in urban squares; J. Urban Des., 10 (2005), pp. 69–88
- Yang and Kang, 2005b W. Yang, J. Kang; Acoustic comfort evaluation in urban open public spaces; Appl. Acoust., 66 (2005), pp. 211–229
- Yu and Kang, 2005a Yu, L., Kang, J., 2005a. Soundscape evaluation in city open spaces using artificial neural network. UIA XXII World Congress of Architecture, Istanbul.
- Yu and Kang, 2005b Yu, L., Kang, J., 2005b. Neural network analysis of soundscape in urban open spaces. In: Proceedings of the 149th Meeting of the Acoustical Society of America, Vancouver Canada.
- Yu and Kang, 2006 Yu, L., Kang, J., 2006. Integration of social/demographic factors into the soundscape evaluation of urban open spaces using artificial neural networks. In: Proceedings of Internoise '06, Honolulu, USA.
Document information
Published on 12/05/17
Submitted on 12/05/17
Licence: Other
Share this document
Keywords
claim authorship
Are you one of the authors of this document?
