Abstract
A series of experiments were conducted to study the effect of leading-edge roughness on the state of the boundary layer of a wind turbine blade section using multiple hot-film sensors. The experiments involved static and dynamic tests, where airfoil motion was of plunging type oscillation. The application of surface grit roughness simulates surface irregularities that occur on the wind turbine blades.
The measurements showed that increasing the angle of attack results in movement of transition locations toward the leading edge. Surface roughness moved the transition point toward the leading edge and caused early trailing edge turbulent separation, which resulted in reducing the effectiveness of the airfoil. Boundary layer instability frequencies were dominated through the transition.
Keywords
Boundary layer transition ; Plunging ; Roughness ; Reduced frequency ; Wind turbine
Nomenclature
PSD- Power spectral density
TS- Tollmien Schlichting
SD- Standard deviation
- Airfoil chord (cm)
- Distance from the leading edge of the airfoil (cm)
- Plunging displacement (cm)
- Amplitude of the plunging motion (cm)
- Dimensionless plunging amplitude,
- Plunging frequency (Hz)
- Free stream velocity (m/s)
- Reduced frequency,
- Pressure coefficient
- Time (s)
- Period of oscillation
- Dimensionless time,
- Angle of attack (deg)
- Mean incidence angle (deg)
- Amplitude of the pitching motion (deg)
- Angular frequency (rad/s)
- Equivalent motion
1. Introduction
Accurate determination of the boundary-layer response to the unsteadiness produced by the forced motion of an airfoil requires additional investigation into basic flow phenomena, including unsteady transition, separation, reattachment and laminarization processes that play a major role in aeronautical applications. Potential performance enhancements to the maneuvering of aircraft, rotorcraft, and wind energy machines continue to prompt an intense study of unsteady boundary-layers. Clarified understanding of unsteady boundary-layer transition results in the controlling of dynamically separated flow that can estimate laminar/turbulent properties of a flow field, which have an important influence on skin friction, and, hence, on system performance [1] , [2] and [3] .
The blades of wind turbines experience large time dependent variations in angle of attack due to yaw, with respect to oncoming wind, control input angles, blade flapping, shear in the ambient wind, ambient turbulence, structural response and wake inflow [4] , [5] and [6] . Previous investigations, both experimental and numerical, have identified significant aspects of unsteady boundary-layer separation, especially unsteady boundary-layer reversal associated with dynamic stall [7] , [8] , [9] and [10] . Far greater results were obtained for pitching rather than plunging airfoils [11] , [12] and [13] . However, large parts of the angle of attack changes that rotor blades encounter are due to variations in flapping and elastic bending of the blade, which is modeled by the forced plunging type motion [14] . There are some differences between the effect of unsteadiness on the development of the boundary layer of the two types of motion: pitching and plunging. Note that in the plunging motion, the pitch rate is not present, hence, only the induced angle of attack plays an effective role. Although the effects of accelerated flow and pressure–gradient-lag on boundary layer development are the same for both motions, the leading edge jet effect is of an opposite kind, delaying separation for the pitching, and promoting it for plunging oscillations [15] and [16] . Thus, the accurate design of wind turbine blades needs prediction and consideration of the unsteady boundary-layer characteristics of the plunging type motion.
Furthermore, dirt and contamination accumulate on the wind turbine blade when it operates in the field. The main sources of contamination are insect compacts, ageing, sand impacts, and contaminated rain. The existence of contamination strongly affects the rotor performance. When insects, smog and dirt accumulate along the leading edge of the blade, power output can drop up to 40% of its clean value [6] . Surface roughness destabilizes the laminar boundary layer and weakens the turbulent boundary layer, in regard to the adverse pressure gradients. The corresponding effects on airfoil lift and drag depend on the particular types of pressure distribution developed by the airfoil. The so-called laminar airfoils are particularly sensitive to roughness, because the improved airfoil performance is obtained by tightly controlling the boundary layer behavior. Any deviations of the boundary layer from its intended behavior, such as that due to roughness, can result in significant deterioration in performance [17] and [18] .
In some studies, the qualitative behavior of the boundary layer characteristics was measured using hot-film sensors [19] . The heat transfer or the voltage output level of the hot film sensor gives a direct recognition of the state of the boundary layer over it. However, Hodson [20] and Zhang [21] used the un-calibrated hot-film data to provide semi-quantitative information about the state of the boundary layer. In their study, the quasi-wall-shear stress was defined as:
|
|
( 1) |
where is the output voltage of the hot-film sensor, and is the offset voltage, zero-flow voltage of the air temperature encountered during the test. In the present study, the author used this definition to investigate the boundary layer state from the outputs of the hot-film sensors.
To gain a better understanding of the boundary-layer response to flow unsteadiness, this study is focused on unsteady boundary-layer measurements on an oscillating airfoil model in the plunging mode. The state of the boundary layer of a plunging airfoil at subsonic regime is measured using multiple hot-film sensors. The effect of leading edge roughness on the transition behavior is investigated using both time domain and frequency domain analysis. The measurements of the surface pressure distribution on this model and the corresponding aerodynamic loads in the plunging motion were conducted in previous investigations [22] , [23] and [24] . In this study, some details about boundary-layer transition in the plunging airfoil are investigated, since there are limited amounts of data available for this type of motion, especially in the range of Reynolds numbers between and , which are applicable to wind turbines.
2. Experimental apparatus
The experiments were conducted in a subsonic wind tunnel in Iran. It is a closed return type tunnel, has a test section of 80 cm×80 cm×200 cm and operates at speeds from 10 to 100 m/s. The inlet of the tunnel has a 7:1 contraction ratio with four large, anti-turbulence screens and a honeycomb in its settling chamber to reduce tunnel turbulence to less than 0.1% [25] .
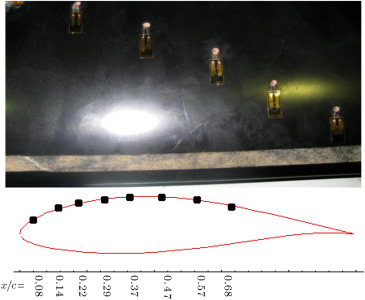
The model has a 25 cm chord and an 80 cm span, and is the critical section of a 660 kW turbine blade under construction in Iran. The hot-films used are a special version of the flush-mounting DANTEC probe, glue-on type. The sensor is deposited on a KaptonTM foil with a thickness of about 50 μm, and placed inside the fitted hole on the surface of the model in order to minimize the influence of probe thickness on transition. The sensor has a dimension of 0.9 mm×0.1 mm and is connected to a gold-plated lead area. Eight hot-films were located along the chord at an angle of 20%, with respect to the model span, to further minimize disturbances from the upstream span (Figure 1 ). Data are obtained using a Constant Temperature Anemometer (CTA). Each CTA data was transformed to the computer through 64 simultaneous channels, a 12-bit Analog-to-Digital (A/D) board capable with an acquisition rate of up to 1200 kHz. Raw data were then digitally filtered by a low-pass filtering routine. Un-calibrated hot-film data were used to define the quasi-wall-shear stress and provided semi-quantitative information about the state of the boundary layer development.
|
|
|
Figure 1. Model with surface roughness and location of the hot films. |
To study the possible extent of performance loss due to surface roughness, standard commercial grit (number 4 with average thickness of 0.031 mm) was used to simulate surface contamination. Surface roughness was applied at , using 12 mm (about 5% of the chord) double sticky tape along the airfoil span (Figure 1 ). The reason is that roughness height should be in the order of boundary layer thickness to have an effect upon transition. The surface roughness was placed at near the leading edge, in order that it could be contained completely within the boundary layer thickness [18] . By varying the angle of attack, location of the stagnation point varied about 5% of the chord. Hence, the growth of boundary layer thickness in the vicinity of the leading edge was estimated for various angles of attack tested here, and the surface roughness was placed in this location.
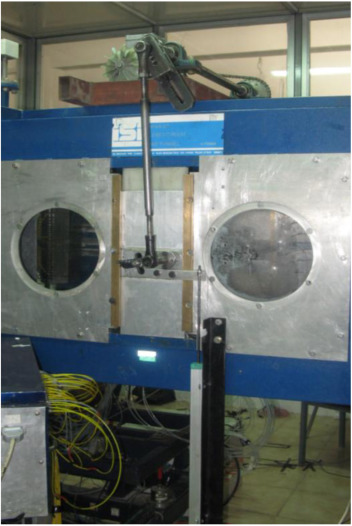
The plunging system for the present experiments incorporates a crankshaft to convert the circular motion of the motor to a reciprocal motion, which is transferred to the model by means of rods (Figure 2 ). The pitch rotation point is fixed at about the wing quarter chord. The plunging displacement was varied sinusoidally as .
|
|
|
Figure 2. Plunging oscillation system. |
The experiments were conducted at a free stream velocity of 30 m/s, corresponding to the Reynolds number of 0.42×10⁶ , and at oscillation amplitude of . The reduced frequencies were varied from 0.05 to 0.11, which are the effective reduced frequencies for this section of a wind turbine blade when operating in the field. The static angles of attack were varied from −5° to 23°.
3. Results and discussion
To identify the boundary layer transition on the airfoil, experiments were carried out for both static and dynamic conditions in the plunging mode. The effects of leading edge roughness on the state of the boundary layer and transition point were studied.
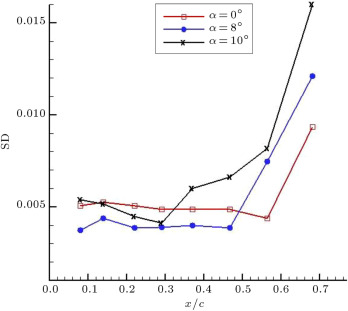
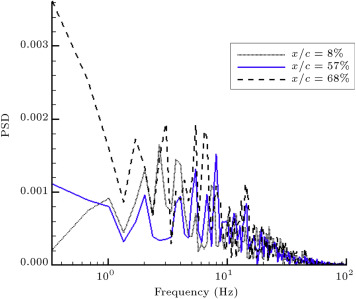
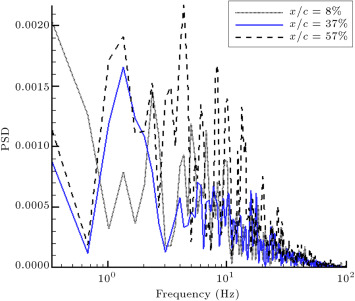
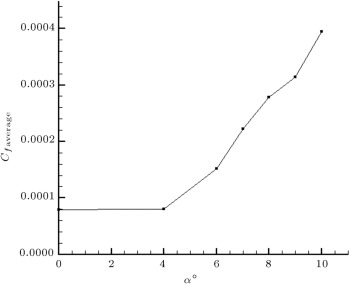
In the transition region, the disorder of the boundary layer is more than that of the other regions. The standard deviation of the hot-film signal is a suitable parameter to indicate the level of disorder. It will usually rise significantly as transition occurs and then fall to a lower state under fully turbulent conditions, but still well above the laminar level [12] , [26] and [27] . Figure 3 shows Standard Deviation (SD) of the hot film outputs for three static angles of attack, of 0°, 8° and 10°. It can be seen that at angle of attack of 0°, a sudden rise in the SD, which identifies the transition of the boundary layer to turbulent, is occurred for the last channel, . The region before this point, , shows a low level of SD, which represents the laminar boundary layer. This result can also be seen from the frequency domain analysis. For (Figure 4 (a)), the power spectral of the hot film outputs shows that the amplitudes of the spikes and the area beneath the PSD diagram, which means the growth in the energy level of the boundary layer, at , is higher than the previous locations. This clearly indicates that the boundary layer instability frequencies are present around this location, while, ahead of it, the flow is still laminar. From Figure 3 , it is seen that by increasing the angle of attack, the rise in SD moves upstream toward the leading edge. At , the first rise in SD occurs around and moves toward at an angle of attack of 10%. After these locations, the flow becomes turbulent and the SD data shows higher values. The power spectral of Figure 4 (b), for , shows that near the leading edge, at , the flow is still laminar. At , the level of the energy grows and boundary layer transition occurs. After this location, , the flow becomes turbulent and the spikes show high amplitudes. Variation of the averaged quasi skin friction coefficient with angle of attack is indicated in Figure 5 . The skin friction coefficient, , is defined as:
|
|
|
Figure 3. Standard deviations of hot-film outputs. |
(a) .
(b) .
Figure 4
Power spectral of hot film sensors.
|
|
|
Figure 5. Variation of quasi friction coefficient with angle of attack. |
|
|
( 2) |
It can be seen that with increasing the angle of attack, the skin friction coefficient increases. It means that as the angle of attack increases, disturbances and transition location move toward the leading edge. This, hence, results in increasing the skin friction drag of the airfoil, because a larger portion of the airfoil surface is covered with turbulent flow.
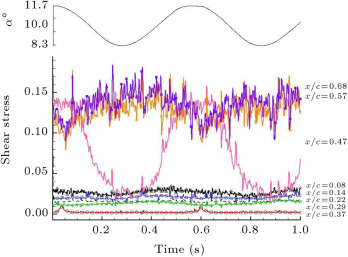
In Figure 6 , dynamic oscillatory results for the clean case are shown for three reduced frequencies of 0.05, 0.08 and 0.11, and for a mean angle of attack of 10°, near the static stall region for this airfoil. The static stall angle of attack for this particular airfoil is about 11° [22] , [23] , [24] and [28] .
(a) .
(b) .
(c) .
Figure 6
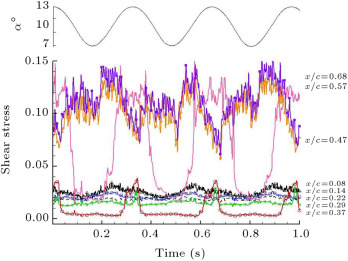
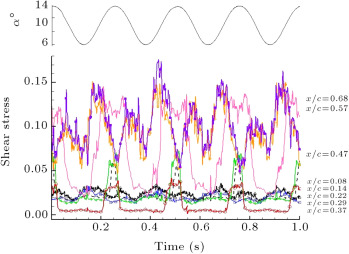
Time history of quasi-wall-shear stress.
It should be noted that in the plunging motion, the plunging displacement can be transformed into an equivalent angle of attack using the potential flow transformation formula, , where is in radians and , the plunging amplitude, has been nondimensionalized, with respect to the model semi-chord. The mean angle of attack is, of course, added to the equivalent angle [29] .
Variations of the quasi-wall-shear stresses calculated from the un-calibrated hot-film signals for an oscillation period of 1 s, are shown in Figure 6 . The corresponding equivalent angle of attack is shown on the top of each plot. On the right side of each trace, the positions of the hot-film sensors are indicated. For the lowest reduced frequency case, , the equivalent angle of attack varies from 8.3° to 11.7°, and for the highest one, , the angle of attack varies from 6° to 14°. It is seen that for all reduced frequencies, the quasi shear stress variations at locations of and 14% follow the variations of the equivalent angle of attack and their magnitudes are low. It represents laminar flow during entire oscillation cycles in this region. For (Figure 6 (a)), the laminar region is extended up to around 30% of the chord, . As the reduced frequency increases, the laminar flow region becomes restricted to the leading edge of the model. Furthermore, in this region, shear stress decreases toward the trailing edge, due to the thickening of the boundary layer. The shear stress at shows combinations of the laminar–turbulent flow (Figure 6 (a)). The values of shear stress vary from laminar to turbulent as the equivalent angle of attack increases during one oscillating cycle. As the equivalent angle of attack decreases, the flow becomes laminar. The flow at the last two channels, and 68%, is turbulent, since the magnitude of shear stress is higher than other channels (Figure 6 (a)).
For higher reduced frequencies, and (Figure 6 (b) and (c)), it is seen that from through , combinations of the laminar–turbulent flow exist. Further, from Figure 6 (b) and (c), it can be deduced that for the last two channels located at and 68%, a combination of turbulent-separated flow exists. In this region, at the lower equivalent angles of attack, the flow is turbulent. However, as the angle of attack increases, the quasi shear stress decreases, which represents the separated flow.
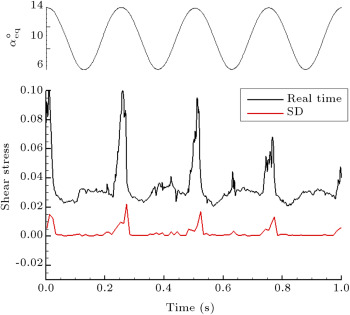
The location of transition can be better estimated from the local standard deviation variations. When the flow becomes turbulent, from the high fluctuations in the SD, the corresponding equivalent angle of attack can be detected. Figure 7 shows an example of the SD variations for the channel located at and for . From this figure, one can detect the flow transition over this hot-film location, , during the plunging motion. For example, it seems that the flow in the vicinity and over this hot-film is laminar for to , corresponding to , down to , and again up to . However, when the model reaches an angle of attack of , up to maximum and down to , transition occurs and the flow becomes turbulent. A similar process continues for another plunging cycle.
|
|
|
Figure 7. An example of standard deviation of hot-film output, and . |
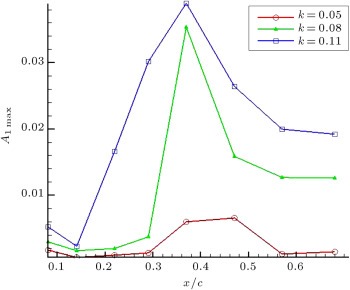
From Figure 8 , variation of the first mode of PSD along the chord is shown for all reduced frequencies. As seen, the onset of the unsteady boundary layer transition promotes to the leading edge with increasing reduced frequency. Furthermore, the amplitude of this mode, hence, the energy level of the boundary layer, increases with increasing the reduced frequency. This is attributed to the accelerated flow, pressure–gradient-lag and leading-edge jet effects in the unsteady motions.
|
|
|
Figure 8. First mode of PSD distribution along the chord. |
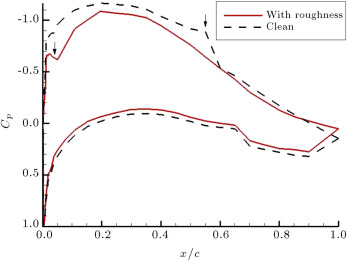
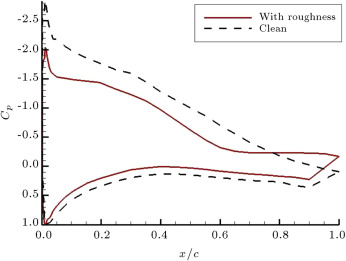
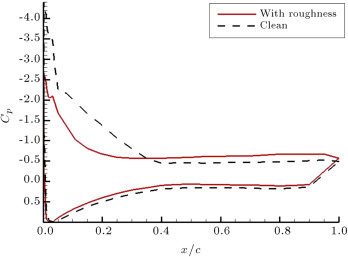
The effect of leading edge roughness on the pressure distribution around the airfoil is presented in Figure 9 . The results are shown for three different static angles of attack: 5°, 10°, and 18°. The data clearly shows that the flow transits as it passes over the roughness and becomes turbulent over the rest of the model. As indicated by an arrow in Figure 9 (a), at , the transition point moves from for the clean model to for the one with roughness. At higher angles of attack, it can be seen that the separated region over the model with roughness is more extensive than that of the clean one (Figure 9 (b) and (c)). Furthermore, the absolute value of the on the upper surface of the model with roughness is less than that of the clean one for all angles of attack, which results in a reduction in the lift value.
(a) .
(b) .
(c) .
Figure 9
Effect of leading edge roughness on pressure distribution in static tests.
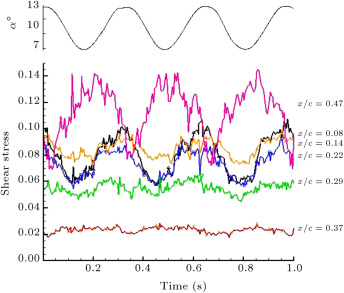
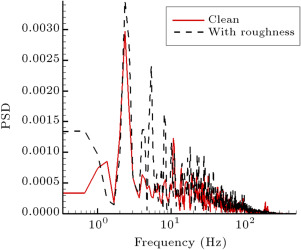
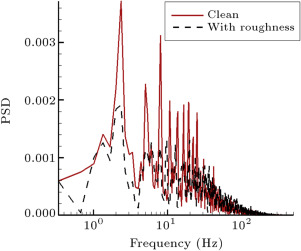
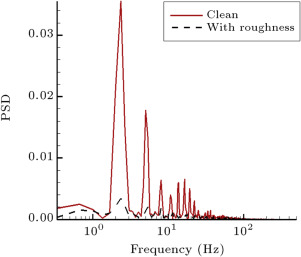
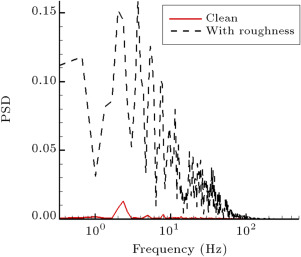
Figure 10 shows composite dynamic plots of the quasi-wall-shear stresses for the rough model, for and . It can be seen that there is no sign of laminar flow in any channels. Because the flow transits to turbulent as it passes over the roughness, even the hot-film signal for the channel located at shows turbulent flow during the entire oscillating cycle. The magnitude of the shear stresses, hence, the skin friction drag of the airfoil, increases in the rough model, with respect to the clean one. In contrast with the static case, toward the trailing edge, the turbulent boundary layer does not separate from the surface due to oscillation. Figure 11 compares the PSD of some hot film signals for both rough and clean models. For the locations near the leading edge (Figure 11 (a)), it is seen that the amplitudes of spikes for the rough case are higher than those of the clean cases. It is confirmed that the flow has become turbulent on these channels for the rough model, while it is still laminar for the clean one. The data for the channels located at and (Figure 11 (b) and (c)) reveal that for the clean model, the amplitudes of the spikes are amplified, with respect to the rough model, and the spikes have their maximum amplitudes at for the clean case. The reason for this phenomenon is the growth of boundary layer instability due to boundary layer transition. In the last channel (Figure 11 (d)), it is seen that the energy level of the boundary layer for the rough model is greater than for the clean one. This is due to the greater growth of the turbulent boundary layer in the rough case.
|
|
|
Figure 10. Time history of quasi-wall-shear stress for the model with roughness, . |
(a) .
(b) .
(c) .
(d) .
Figure 11
Variations of the power spectral of hot film sensors, .
4. Conclusions
To simulate surface contamination on a wind turbine blade, the effect of leading-edge roughness on the state of the boundary layer, in both static and plunging oscillation, was studied. Surface roughness moved the transition point toward the leading edge and the flow transits to turbulent as it passes over the roughness. The skin friction drag of the airfoil increases in the rough model, with respect to the clean one. In the static case, the roughness causes an early trailing edge turbulent separation, which results in reducing the effectiveness of the airfoil. In a plunging case, the turbulent boundary layer does not separate from the surface, due to the oscillating energy of the boundary layer. Frequency domain analysis showed that through transition, boundary layer instability frequencies were dominated by the growth of the energy level of the boundary layer.
References
- [1] Pascazio, M., Autric, J.M., Favier, D. and Maresca, C. “Unsteady boundary-layer measurement on oscillating airfoils—transition and separation phenomena in pitching motion”, AIAA paper, 34th Aerospace Sciences Meeting and Exhibit , Reno, NV (1996).
- [2] S.J. Schreck, W.E. Faller, H.E. Helin; Pitch rate and Reynolds number effects on unsteady boundary-layer transition and separation; Journal of Aircraft, 35 (1) (1998), pp. 46–52
- [3] Brodeur, R. and van Dam, C.P. “Transition prediction for a two dimensional Navier–Stokes solver applied to wind-turbine airfoils”, AIAA-2000-0047 (2000).
- [4] Robinson, M.C., Galbraith, R.A., McD, , Shipley, D. and Miller, M. “Unsteady aerodynamics of wind turbines”, Paper 95-0526, 33rd Aerospace Sciences Meeting , Reno, NV (1995).
- [5] Leishman, J. “Challenges in modeling the unsteady aerodynamics of wind turbines”, AIAA 2002-0037, 21st ASME Wind Energy Symposium and 40th AIAA Aerospace Sciences Meeting , Reno, NV (2002).
- [6] A.C. Hansen, C.P. Butterfield; Aerodynamics of horizontal-axis wind turbine; Annual Review of Fluid Mechanics, 25 (1993), pp. 115–149
- [7] Carr, L., McAlister, K. and McCroskey, W. “Analysis of the development of dynamic stall based on oscillating airfoil experiments”, NASA TN D-8382 (1977).
- [8] Schreck, S. and Luttges, M. “Occurrence and characteristics of flow reversal during the genesis of unsteady separated flows”, AIAA Paper 89-0142 (1989).
- [9] Visbal, M.R. “On some physical aspects of airfoil dynamic stall”, American Society of Mechanical Engineers Symposium on Non-Steady Fluid Dynamics , Toronto, Canada (1990).
- [10] Ghia, K., Yang, J., Osswald, G. and Ghia, U. “Study of the role of unsteady boundary layer reversal in the formation of dynamic stall vortex”, AIAA Paper 92-0196 (1992).
- [11] Knight, D. and Choudhuri, P. “2-D unsteady leading edge boundary layer reversal on a pitching airfoil”, AIAA Paper 93-2977 (1993).
- [12] S.J. Schreck, W.E. Faller, H.E. Helin; Pitch rate and Reynolds number effects on unsteady boundary-layer transition and separation; Journal of Aircraft, 35 (1) (1998), pp. 46–52
- [13] Kim, Dong-Ha and Chang, Jo-Won “Reynolds number effects on unsteady boundary layer for an oscillating airfoil”, AIAA 2009-3501, 27th AIAA Applied Aerodynamics Conference (2009).
- [14] Tyler, C.J. and Leishman, J.G. “Analysis of pitch and plunge effects on unsteady airfoil behavior”, Presented at the 47th Annual Forum of the American Helicopter Society (1991).
- [15] Ericson, L.E. “Moving wall effects on dynamic stall can be large-fact or fiction”, AIAA-91-0430, 29th Aerospace Sciences Meeting , Nevada, Reno (1991).
- [16] M.R. Visbal; High-fidelity simulation of transitional flows past a plunging airfoil; AIAA Journal, 47 (11) (2009), pp. 2685–2697
- [17] RPJOM Rooij, W.A. Timmer; Roughness sensitivity considerations for thick rotor blade airfoils; Journal of Solar Energy Engineering, 125 (2003), pp. 468–478
- [18] Kerho, MF “Effect of large distributed roughness near an airfoil leading-edge on boundary-layer development and transition”, “Ph.D. Thesis”, University of Illinois at Urbana-Champaign (1995).
- [19] T. Lee, S. Basu; Measurement of unsteady boundary layer developed on an oscillating airfoil using multiple hot-film sensors; Experiments in Fluids, 25 (1998), pp. 108–117
- [20] Hodson, H.P. and Howell, R.J. “Unsteady flow: its role in the low pressure turbine”, 9th International Symposium Unsteady Aerodynamics, Aeroacoustics and Aeroelasticity of Turbomachines , Lyon (2000).
- [21] Zhang, X.F., Mahallati, A. and Sjolander, S.A. “Hot-film measurements of boundary layer transition, separation and reattachment on a low Reynolds numbers”, 38th AIAA/ASME/SAE/ASEE Joint Propulsion Conference & Exhibit, AIAA 2002-3643 (2002).
- [22] M.R. Soltani, F. Rasi Marzabadi; Effect of plunging amplitude on the performance of a wind turbine blade section; The Aeronautical Journal, 111 (1123) (2007), pp. 571–587
- [23] M.R. Soltani, M. Seddighi, F. Rasi Marzabadi; Comparison of pitching and plunging effects on the surface pressure variation of a wind turbine blade section; Journal of Wind Energy (2008) http://dx.doi.org/10.1002/we.286
- [24] M.R. Soltani, F. Rasi Marzabadi; Effect of reduced frequency on the aerodynamic behavior of an airfoil oscillating in a plunging motion; Journal of Scientica Iranica, 16 (1) (2009), pp. 40–52
- [25] Dehghan, M. “A method for turbulence reduction in subsonic wind tunnels”, “Ph.D. Thesis”, Department of Aerospace Engineering, Sharif University of Technology (2009).
- [26] McGinley, C.B., Jenkins, L.N., Watson, R.D. and Bertelrud, A. “3-D high-lift flow-physics experiment–transition measurements”, 35th AIAA Fluid Dynamics Conference and Exhibit, AIAA 2005-5148 , Toronto, Ontario, Canada (2005).
- [27] Kachanov, Y.S. “Experimental studies of three-dimensional boundary layers”, AIAA Paper 96-1978 (1996).
- [28] Rasi Marzabadi, F. “Experimental study of transition on an airfoil in plunging motion”, “Ph.D. Thesis”, Department of Aerospace Engineering, Sharif University of Technology (2011).
- [29] Carta, F.A. “Comparison of the pitching and plunging response of an oscillating airfoil”, NASA CR-3172 (1979).
Document information
Published on 06/10/16
Licence: Other
Share this document
Keywords
claim authorship
Are you one of the authors of this document?
