Abstract
Internal solitary waves (ISW) often appear in the actual ocean and carry huge energy. In order to study the interaction between the ISW and the underwater objects, considering the variation law of the fluid density along the depth direction in the actual ocean, the numerical calculation model for the ISW and the submarine in the stratified fluid is established based on the Korteweg de Vres (KdV) theory and the RANS method. The load characteristics of the ISW on the submarine are studied by using the overset mesh technology and the VOF method. When the submarine passes through the ISW, the change of its buoyancy will cause a sharp change in the vertical load. The ISW-induced flow field will also affect the force on the submarine. The ISW-induced forces increase with the increase of the ISW amplitudes. When the submarine is completely below the peak of the waveform, the load is mainly affected by the flow field structure; the force amplitude is small, and the impact of the submergence depth is small.
Keywords: Internal solitary wave, submarine, numerical simulation, density change, load characteristics
Nomenclature
| ISW: | Internal Solitary Wave |
| KdV: | Korteweg de Vres |
| VOF: | Volume of Fluid |
| UDF: | User Defined Function |
| MCC: | Michaller Camassa and Choi theory |
| DARPA: | Defense Advanced Research Projects Agency |
| CFD: | Computational Fluid Dynamics |
| : | wave amplitude |
| : | wave phase speed |
| : | linear wave speed |
| : | characteristic wavelength |
| : | horizontal velocity |
| : | fluid density |
| : | turbulence kinetic energy |
| : | turbulence dissipation rate |
| : | sum of body forces |
| : | modified pressure |
| : | effective viscosity |
| : | turbulence viscosity |
| : | turbulence production |
| : | fluid layer thickness |
| : | damping coefficient |
| : | initial horizontal coordinate of the wave damping zone |
| : | total length of wave damping zone |
Subscripts
| 0 | initial |
| 1 | upper layer fluid |
| 2 | lower layer fluid |
1. Introduction
Internal solitary waves (ISWs) exist widely in the ocean [1]. The shear flow and turbulence generated by ISWs contribute to energy transmission and dissipation in the global ocean, but also have an impact on offshore engineering, biological activities and submarine operation, and become a disastrous marine environmental factor [2,3].
Scholars continue to study the influence of ISWs by means of situ measurements and remote sensing [4,5], theories research [6,7], laboratory experiments [8,9] and numerical simulations [10-12] et al. Numerical simulation is widely used in the study of ISWs due to its low cost and convenient parameter acquisition.
Lin et al. utilized different empirical coefficients and Morrison's equation to numerical study ISWs-induced load on cylinder at different depth [10]. Zou et al. studied the ISW-submerged floating tunnel interaction with various ISW amplitudes, submergence depth, cross-sectional shape of submerged floating tunnel and fluid density ratio [11]. Ding et al. used a 3D numerical wave tank to investigate the hydrodynamic and flow characteristics around a semi-submersible platform caused by ISW propagation [12]. Chen et al. simulated the moving and non-moving submarine load characteristics in the numerical flume with ISW [13].
In the actual marine environment, the seawater density changes with the depth. However, most of the current studies on ISWs adopt two-layer fluid system, without considering the variation of seawater density along the depth. According to the monitoring results, the occurrence of ISW is closely related to the change of seawater density along the depth [4].
In view of the harmness of ISW to submerged body and its wide existence, this paper utilizes CFD method to construct ISW numerical flume to study the influence of different ISW amplitudes and different depth of submerged body on the loading characteristics of submarine under the condition that seawater density changes continuously along the depth.
2. Simulation method
2.1 ISW wave theory
ISW propagation is affected by nonlinear and dispersive effects, which are commonly described by theoretical models such as KdV, eKdV, mKdV and MCC. The small-amplitude and weakly nonlinear and dispersive waves in shallow water are usually described by KdV theory.
For a density-stratified two-layer fluid, the density and thickness of the upper layer fluid are and respectively; in the lower layer fluid the density is and the thickness is . The KdV equation in a two-layer fluid is given by [14]:
|
|
(1) |
The ISW phase speed is given by:
|
|
(2) |
and the characteristic wavelength is given by:
|
|
(3) |
The fluid horizontal velocity of ISW in the upper layer is expressed as:
|
|
(4) |
and in the lower layer the velocity is given by:
|
|
(5) |
where , , , , , and is the ISW amplitude and is the linear wave speed.
2.2 Governing equations
The numerical simulation of ISW flow field is performed by turbulent model. The two-equation model was proposed by Jones and Launderti and has been widely used in engineering applications [11,12,15]. and are the turbulence kinetic energy and dissipation rate respectively. The governing equation is given below:
|
|
(6) |
|
|
(7) |
where is the sum of body forces; is the modified pressure, , is the effective viscosity accounting for turbulence and expressed as , is the turbulence viscosity, , is a constant, and in this paper.
The model introduces two new variables in the system of equations. and can obtained from the following transport equations:
|
|
(8) |
|
|
(9) |
where is the turbulence production due to viscous forces, , , and are constants and having the values: , , , and .
2.3 Numerical flume model
Numerical flume is a numerical simulation method used to simulate the formation, propagation, dissipation and interaction of waves with structures, accurately reflecting various phenomena in the test. The 3D ISW numerical tank is shown in the Figure 1 , including the working zone and the wave damping zone. The numerical tank is filled with two layers of fluids which is 5000m long, 200m wide and 500m height. The working zone is 4000m long and wave damping zone is 1000m. The heights of the two layers are and , respectively. The densities of the upper layer and lower layer fluids are and which are linearly increasing along the depth direction.

|
| Figure 1. Numerical flume sketch |
The velocity boundary conditions are used for numerical wave generation, and ISWs are introduced through the above KdV governing equation. Since numerical simulation cannot realize infinite length simulation, in order to be closer to the actual environment and to subside the influence of reflected waves on the working domain, artificial damping method is adopted. A wave damping zone of a certain length is set in front of the outlet boundary. The velocity is attenuated by the damping zone according to a certain law, so as to reduce the wave energy. A viscous damping source term is added to the momentum equation in the wave damping zone to achieve the purpose of wave dissipation. In the wave damping zone, the momentum equations are as follows:
|
|
(10) |
|
|
(11) |
where is the damping coefficient, and its relation along the propagation direction is given by:
|
|
(12) |
where a is the damping constant, is the [javascript:; horizontal coordinates] in the wave damping zone, is initial horizontal coordinate of the wave damping zone, is the total length of wave damping zone. The damping coefficient in the wave damping zone is linearly distributed.
The top boundary is taken as a “rigid lid” in all simulations. The bottom and right of the tank adopt solid wall boundary, the front and rear side walls of the tank are taken as symmetric boundaries. The velocity inlet method is used to numerically generate waves, and the boundary of the inlet is set by user defined function (UDF) to generate ISWs. The outlet employs the pressure outflow at the left side. The interface between two layers is tracked by VOF method.
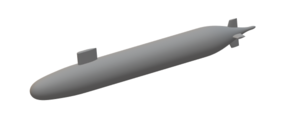
The DARPA (Defense Advanced Research Projects Agency) submarine model SUBOFF will be used to study load characteristics by ISW. The length of the main boat is 4.356m, and the maximum rotary diameter is 0.508m. The appendages include the control platform, the vertical stabilizer, and the horizontal stabilizer [16], as shown in Figure 2(a). The SUBOFF model is small in scale, so it is enlarged by 25.5 times for numerical simulation. The appendages of SUBOFF model are removed, as shown in Figure 2(b). The total length of the enlarged bare hull is 111m, the maximum rotary diameter 12.954m, and the gravity center of the submarine is located at 51m from the bow on its centerline.
| |
| (a) Schematic diagram of DARPA SUBOFF | |

| |
| (b) Schematic diagram of simplified SUBOFF model | |
| Figure 2. Schematic diagram of SUBOFF model | |
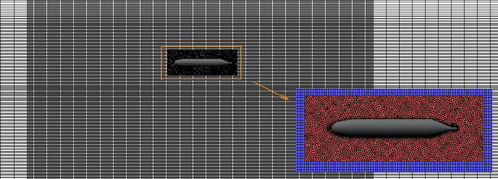
The center of the submarine is located 1500m from the inlet. The overset mesh technology is adopted to generate the mesh. The mesh of the simulation flume is taken as background grid with a structured grid amount of 5.31 million. The sub-domain of the submerged body is a square area of 160m×20m×60m, and the unstructured grid is used with a grid amount of 1.42 million, as shown in Figure 3. The flow field parameters are matched and coupled at the boundary of overlapping regions by interpolation.
|
| Figure 3. Grid distribution for the simulation domain |
3. Simulation results and discussions
3.1 Model validation
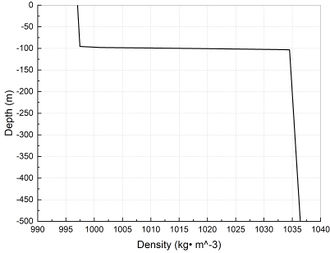
The variation of the fluid density along the depth of the numerical flume is shown in Figure 4. The density of the upper fluid and the lower fluid increased along the depth direction, and the density at the interface of the two fluids changed dramatically, forming a pycnocline. This density distribution more truly reflects the actual situation in the ocean.
|
| Figure 4. Density profile along the depth for simulation |
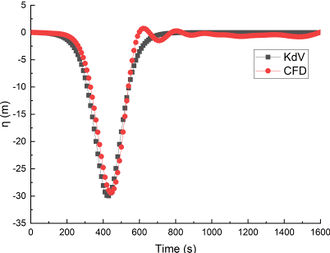
At the monitoring point m, the comparison of waveforms are shown in Figure 5. The results of the CFD simulation and the waveforms calculated by KdV theory are shown in a high coincidence. Therefore, the numerical simulation method adopted in this paper is reliable.
|
| Figure 5. Comparison of profiles of ISWs between theoretical and CFD simulation |
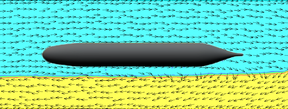
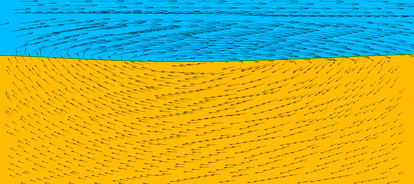
Figure 6 shows the velocity vector induced by ISWs. The fluid velocity above the wave surface is to the right, while that below the wave surface is to the left, and the trajectory forms a clockwise ellipse. When a concave ISW passes through a submerged body, it will traverse the two wave surfaces: the first wave surface near the exit (on the right of the Figure 6) and the second wave surface near the entrance (on the left of the Figure 6).
|
| Figure 6. Velocity vector induced by ISWs |
3.2 Load characteristics analysis
Previous studies have shown that the load characteristics of the submerged body subjected to the ISWs are basically the same whether the submerged body has speed or not. The main difference is that the action duration of the ISWs on the submerged body is shortened with the increase of the speed [13].Therefore, this paper only considers the force of the SUBOFF without speed.
In order to explore the influence of the SUBOFF at different depths when the ISWs pass through, ISW amplitudes and , and submergence depth of 15m, 30m and 45m are selected to simulate, and the simulation cases are shown in Table 1.
| Submergence depths (m) | |||
|---|---|---|---|
| ISW amplitude(m) | 15 | 30 | 45 |
| 20 | Case A21 | Case A22 | Case A23 |
| 30 | Case A31 | Case A32 | Case A33 |
The ISWs amplitudes of and satisfy the KdV theory which is . Their wavelength and wave speed are shown in Table 2. As the ISW amplitude increases, the wavelength and wave speed decrease.
| ISW amplitude (m) |
Wavelength (m) |
Wave speed c (m/s) |
|---|---|---|
| 20 | 576.55 | 4.90 |
| 30 | 470.75 | 4.69 |
(1) Effect of submergence depth
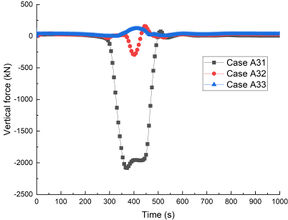
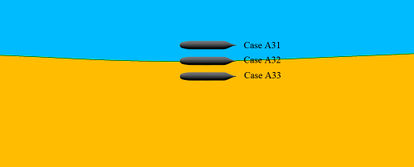
In order to investigate the influence of the submerged body at different depths when the ISW passes through it, the wave amplitude is and the submergence depths are 15m, 30m and 45m respectively, namely Case A31, Case A32 and Case A33. When the ISW passes through the SUBOFF location, the SUBOFF is located in the middle of the wave, the peak of the wave and below the wave respectively, as shown in Figure 7.
|
| Figure 7. Sketch diagram of SUBOFF submergence depth |
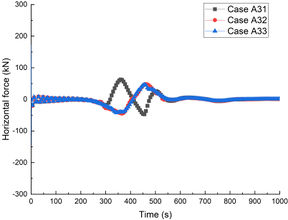
The forces and torques on the SUBOFF are shown in the Figure 8. As show in Figure 8(a) for the horizontal force, when s, the ISW first wave surface traversed through SUBOFF body. On the left side of the surface the fluid flowed to the right and on the right side of the surface the fluid flowed to the left. The forces on the SUBOFF began to change when the ISW passes through it. As Case A31 show, when SUBOFF passed through the first wave, SUBOFF was affected by fluid shear stress on both sides. The horizontal force increased firstly, then reached the peak and fall. When the second wave surface was achieved, the negative force reached the peak. Since both Case A32 and Case A33 did not cross the ISW surface, their forces were affected by the flow field below the wave surface, and the force direction of Case A32 and A33 was opposite to that of Case A31.
Figure 8(b) shows the vertical forces on the SUBOFF. Before the wave surface arrives, the gravity and buoyancy of the SUBOFF were in equilibrium, and the force in the vertical direction was 0. When s, the ISW first wave surface passed through SUBOFF body. The fluid density around the SUBOFF decreased which lead to buoyancy decline, so lead to the vertical force negative. When SUBOFF was completely in the upper fluid, the vertical force is about -2000 kN which reached a maximum in the negative direction. When the second wave surface was achieved, the SUBOFF buoyancy increased, so the total force decreased. When the second wave surface went away from the SUBOFF, the submerged body reaches equilibrium again.
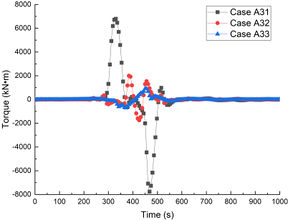
Figure 8(c) shows the torques on the SUBOFF. For the Case A31, when the wave surface passed through the submerged body, the torque changed dramatically. When the submerged body encountered the first wave surface and the second wave surface, the torque direction was opposite, which will cause the pitching motion of the submerged body. The maximum torque of Case A32 was 1/4 of that of Case A31, and the maximum torque value of Case A33 was about 1/2 of that of Case A32. It can be seen that as the submergence depth increased, the SUBOFF stayed away from the peak of the ISW, so the torque of Case A33 decreased.
In conclusion, when the submerged body passed through the ISW surface, the vertical force was 20 times of the horizontal force, and the torque value increased sharply. In actual conditions, the stability and motion attitude of the submerged body may suddenly change. When the submerged body lied below the wave peak, although the force was smaller than that when it crossed the wave surface, the change of force in horizontal and vertical direction cannot be ignored.
|
|
| (a) Horizontal force | (b) Vertical force |
| |
| (c) Torque | |
| Figure 8. Forces and torques on the SUBOFF at different submergence depths | |
(2) Effect of wave amplitude (cross the wave surface)
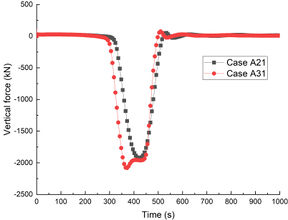
The above research shows that the force of the SUBOFF has the greatest influence when submerged body passes through the wave surface. Therefore, in order to investigate the influence of the ISW amplitude on the submerged body when submerged body cross the wave surface, the submergence depth is chosen to be 15m, and the wave amplitude are and respectively, namely Case A21 and Case A31.
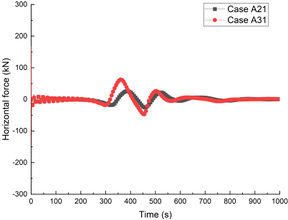
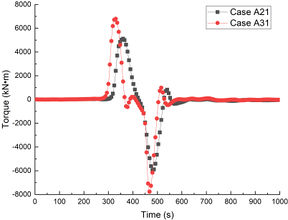
As shown in Figure 9, with the increase of the ISW amplitude, the peak values of the horizontal force and the vertical force both increased, and the horizontal force oscillated, while the vertical force increased little with the increase of the wave amplitude. The torque also increased with the increase of the ISW amplitude. Because the volume of the SUBOFF is unchanged, when the submerged body was completely located in the upper fluid, the magnitude of the buoyancy force change was the same. The reason for the force change caused by the increase of the wave amplitude was the change of the fluid flow structure. Therefore, when the ISW passed through the submerged body, the wave amplitude had obvious influence on the stability of the submerged body.
|
|
| (a) Horizontal force | (b) Vertical force |
| |
| (c) Torque | |
| Figure 9. Forces and torques on the SUBOFF with different wave amplitude | |
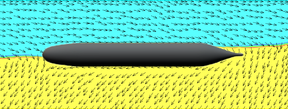
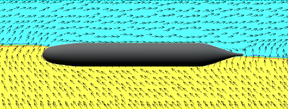
The velocity vectors around the SUBOFF of Case A31 at different time when it encounters the ISW is shown in Figure 10 . When s, the first wave surface of ISW was passing through the submerged body, and the underlying fluid flows significantly to the lower left. When s, the submerged body have passed through the first wave surface and is completely located in the upper layer fluid. At this time, the buoyancy force changed the most, which affected the vertical force. When s, the submerged body was passing through the second wave surface, and the underlying fluid flowed significantly to the upper left.
|
|
| (a) s | (b) s |
| |
| (c) s | |
| Figure 10. Velocity vectors around the SUBOFF when it encounters the ISW | |
(3) Effect of submergence depth (below the wave surface)
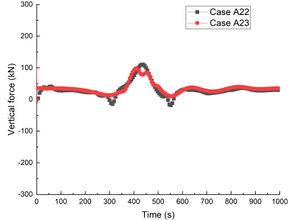
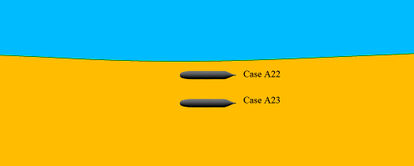
When the submerged body is completely below the ISW, in order to study the influence of the distance between the submerged body and the wave peak, the wave amplitude is selected as , and the submergence depths are 30m and 45m respectively, namely Case A22 and CaseA23, as shown in Figure 11.
|
| Figure 11. Sketch diagram of SUBOFF below the wave |
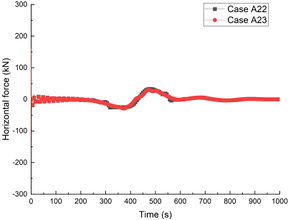
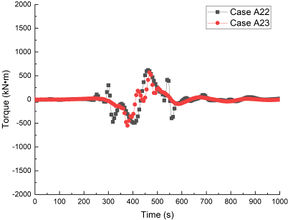
Figure 12 shows the forces and torques on the submerged body when the submerged body is completely below the ISW surface. Case A23 dived 15 meters deeper than Case A22, and its force was basically the same as that of Case A22. The increase of 15m depth had little effect on the force. Since the submerged body did not pass through the ISW, the buoyancy of the submerged body did not change, and the horizontal and vertical forces were mainly due to the change of flow field structure when it encountered the ISW. Therefore, the change of the forces on the submerged body only came from the contribution of ISW itself.
|
|
| (a) Horizontal force | (b) Vertical force |
| |
| (c) Torque | |
| Figure 12. Forces and torques on SUBOFF below the wave | |
4. Conclusions
In this paper, the velocity inlet method is used to numerically generate ISWs.The numerical ISW flume with two layers of fluid is established which considers the variation of fluid density along the depth, and the numerical simulation of the interaction between the submarine and ISWs is realized.
(1) When the submerged body encounters the ISW, the submerged body is subjected to the load generated by the ISW. The change of buoyancy contributes the most to the load change of the submerged body. The change of flow field has an impact on the load change of the submerged body, but the value is small compared with the buoyancy force.
(2) When the ISW passes through the submerged body, the vertical force is dominant, which is mainly caused by buoyancy; With the increase of the ISW amplitude, the force on the submerged body will increase, which mainly comes from the change of the flow field structure.
(3) In the fluid region affected by the ISW, the buoyancy of the submerged body does not change when the submerged body is under the internal solitary wave; For the submergence depth in this paper, the influence of the submergence depth on the force is small. Although the amplitude of the force change caused by the flow field is smaller than that of the buoyancy, it cannot be ignored.
References
[1] Guo C., Chen X. A review of internal solitary wave dynamics in the northern South China Sea. Progress in Oceanography, 121:7-23, 2014.
[2] Osborne A.R., Burch T.L. Internal solitons in the Andaman Sea. Science, 208(4443):451-460, 1980.
[3] Huang X., Chen Z., Zhao W., Zhang Z., Zhou C., Yang Q., Tian J. An extreme internal solitary wave event observed in the northern South China Sea. Scientific Reports, 6(1):30041, 2016.
[4] Orr M.H. Nonlinear internal waves in the South China Sea: Observation of the conversion of depression internal waves to elevation internal waves. Journal of Geophysical Research, 108(C3), 3064, 2003.
[5] Alford M.H., Lien R., Simmons H., et al. Speed and evolution of nonlinear internal waves transiting the south China sea. Journal of Physical Oceanography, 40(6):1338-1355, 2010.
[6] Cui J., Dong S., Wang Z. Study on applicability of internal solitary wave theories by theoretical and numerical method. Applied ocean research, 111:102629, 2021.
[7] Miles J.W. On internal solitary waves. Tellus 31(5):456–462, 1979.
[8] Chen C.Y., Hsu R.C., Chen H.H., Kuo C.F., Cheng M.H. Laboratory observations on internal solitary wave evolution on steep and inverse uniform slopes. Ocean Engineering, 34(1):157-170, 2007.
[9] Zhao B., Wang Z., Duan W., Ertekin R.C., Hayatdavoodi M., Zhang T. Experimental and numerical studies on internal solitary waves with a free surface. Journal of Fluid Mechanics, 899:A17-1-A17-27, 2020.
[10] Lin Z., Zan X. Numerical study on load characteristics by internal solitary wave on cylinder sections at different depth and its parameterization. Ocean Engineering, 219:108343, 2021.
[11] Zou P.X., Bricker J.D., Uijttewaal W.S.J. The impacts of internal solitary waves on a submerged floating tunnel. Ocean Engineering, 238:109762, 2021.
[12] Ding W., Ai C., Jin S., Lin J. 3D numerical investigation of forces and flow field around the semi-submersible platform in an internal solitary wave. Water, 12(1):208, 2020.
[13] Chen J., You Y.X., Liu X.D., Wu C.-S. Numerical simulation of interaction of internal solitary waves with a moving submarine. Chinese Journal of Hydrodynamics, 03(25):344-351, 2010.
[14] Ostrovsky L.A., Stepanyants Y.A. Do internal solitions exist in the ocean? Reviews of Geophysics , 27(3):293-310, 1989.
[15] Small R.J., Hornby R.P. A comparison of weakly and fully non-linear models of the shoaling of a solitary internal wave. Ocean Modelling (Oxford), 8(4):395-416, 2005.
[16] Groves N.C., Huang T.T., Chang M.S. Geometric characteristics of DARPA (Defense Advanced Research Projects Agency) SUBOFF models (DTRC model numbers 5470 and 5471). David Taylor Research Center, Bethesda, Maryland, 1989.
Document information
Published on 15/09/22
Accepted on 04/09/22
Submitted on 23/08/22
Volume 38, Issue 3, 2022
DOI: 10.23967/j.rimni.2022.09.002
Licence: CC BY-NC-SA license
Share this document
Keywords
claim authorship
Are you one of the authors of this document?
