Abstract
A new numerical model for the structural assessment of gravity dams by means of a semi-discrete approach is proposed. Gravity dams are massive structures, which their stability depends on the gravity loads applied to the structure. Mainly, its structural assessment is performed by means of a gravity approach. Sometimes, this approach is too conservative and mostly does not reflect the real structural behaviour of the dam. In this context, there is the need of models that are simplified enough to allow a simple and fast parametric analyses. The proposed model idealizes the dam as a set of rigid elements, where the damage and the deformation are concentrated in the contact sides between adjacent elements. Thus, the elements are rigid, but the material is considered as deformable. As the proposed model is semi-discrete, it can detect separation or sliding between elements. However, initial contacts do not change during the analyisis and a relative continuity among elements exists, in order to simplify the computational effort. The effective performance of the proposed model is demonstrated by numerical validation and by comparisons with some numerical models presented in the literature.
Keywords: Gravity dams, Semi-discrete model, non-linear behaviour, rigid body spring model, damage
1. Introduction
Gravity dams are massive structures, which their stability depends on the gravity loads applied to the structure [1]. Mainly, the structural assessment of gravity dams is performed by means of a gravity approach, where the resultant of all forces acting on the dam must lie in the third middle of the base. Generally, the hypothesis of no tension material is assumed [2]. Sometimes, this approach is too conservative and mostly does not reflect the real structural behaviour of the dam [2-4].
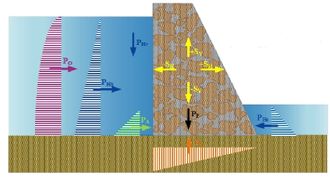
The gravity approach is based on the calculation of the [1]: a) Position of the resultant force, where the resultant force must lie in the middle third of the base; b) Inclination of the resultant force, in order to evaluate the shear forces and the possible sliding of the dam; and c) Compressive stresses, in order to avoid the crushing of the material. Figure 1 depicts the forces acting on the dam; where is the hydraulic pressure (v=vertical, h=horizontal and e=downstream), is the own weight, is the uplift pressure, is the earth pressure, is the seismic loads (vertical, horizontal) and is the hydrodynamic pressure.
|
| Figure 1. Forces acting on the dam |
There are several authors whom have proposed different analytical and numerical models. For example, Bennati and Lucchesi [5] proposed an analytical model for the minimal section of a masonry dam with triangular cross section; while Calayir et al. [6] used the Lagragian and Euleran approaches to study the earthquake response of gravity dams. The Finite Element Method has been widly used for the study of gravity dams by several authors [7-11]. Leclerc et al. [12] used the gravity mehod using rigid body equilibrium and beam theory to perform stress analyses, compute crack lengths and safety factors. Recently, some authors [13-15] have used the Discrete Element Method (DEM), which it is suitable to model discontinuous media.
In general, the Finite and Discrete Element Models requires a lot of resources and expertise to obtain reliable results [16]. In this context, there is the need of models that are simplified enough to allow a simple and fast parametric analyses, but they should also take into account the peculiar behavior of the material. Few simple models to study of gravity dams can be found in the literature [12,16]. Therefore, the study of gravity dams by using simple models is still an open problem. Consequently, in this paper a new simplified numerical model for the structural assessment of gravity dams by means of a semi–discrete approach is presented.
2. Semi-discrete approach
A Semi-Discrete Element Model (SDEM) is proposed to study the structural behaviour of gravity dams, in which the dam is idealized as an ensamblage of rigid elements. Three devices (springs) connect the common side between two rigid elements or restrained sides, in the spirit of Rigid Body Spring Models (RBSM) [17-19].
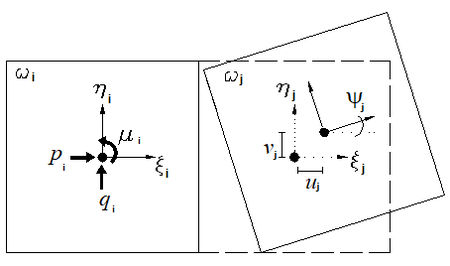
In this study, only the in–plane deformations are considered. The elements have the kinematics of rigid bodies with two linear displacements and one rotation (Figure 2). These connections are two axial devices, separated by a distance 2b that take into account a flexural moment, and one shear device at the middle of the side. The material is considered deformable but this deformation is concentrated in the connecting devices, while the element is not deformable. This means that the springs represent the mechanical characteristics of the material; whereby, the stresses and deformations of the springs represent the average stresses and strains that taking place at the inner of each element, according to a volume of pertinance.
| Figure 2. Forces and displacements |
Each connecting device is independent of the behavior of the others connecting devices and depends only on the Lagrangian displacements. In other words, the connecting device represents the elastic and post–elastic mechanical characteristics of the material and, at the same time, represents the capacity of the model to take into account the separation or the sliding between elements.
The proposed model was developed as a semi–discrete element model (SDEM). Therefore, it can detect separation and sliding of the elements. However, initial contacts do not change during the analysis and a relative continuity among elements exists, in order to simplify the computational effort. Thus, overlapping, separation or sliding between adjacent elements can occur. Numerically, these mean compression, tension or shear in the connecting devices. The semi–discrete model can be though as an analysis technique that combines the advantages of the discrete analysis techniques (e.g. it considers the relative motion among elements) with the computational advantages of the continuous analysis technique (e.g. no new contacts update is necessary).
3. Mathematical formulation
The dam is considered as two–dimensional plane solid model , partitioned into m quadrilateral elements ωi such that no vertex of one quadrilateral lies on the edge of another quadrilateral. The global Cartesian coordinate frame is placed in order to have the gravity acceleration applied in the negative y–axis direction. A local reference frame , whose axes are initially parallel to the global reference frame, is fixed in each element’s barycenter . These elements are rigid, so the displaced configuration of the discrete model is described by the position of these local reference frames, as shown in Figure 2b. Given the local coordinate of a point (), the displacements () in the plane are evaluated as follows:
|
|
(1) |
The translation components , and the rotation angle associated with each element , are collected into the vector of Lagrangian coordinates . The loads are condensed into three resultants associated with each element: the forces and applied to the element centroid considering the initial undeformed geometry, and the couple . They are assembled into the vector of external loads which is conjugated in virtual work with as follows:
|
|
(2) |
|
|
(3) |
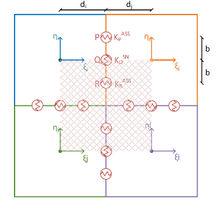
The elements are interconnected by connecting devices (line springs) placed along each side, in correspondence of three points named and , as shown in Figure 3. Three average strain measures are associated with these connecting devices: the axial strains, and are associated with the volumes of pertinence and , while the shear strain is associated with the volume . Considering a discrete model with r sides which connect all the elements (interfaces), the vector of generalized strain and the diagonal matrix of volumes of pertinence (Figure 4) are defined as follows:
|
|
(4) |
|
|
(5) |
| Figure 3. Assembly of rigid elements |
| Figure 4. Volume of pertinence: material (left) and rigid elements (right) |
Under small rotation assumption, the strain-displacement relation can be expressed by considering a matrix as follows:
|
|
(6) |
For the interface i-j between elements and , matrix is:
|
|
(7) |
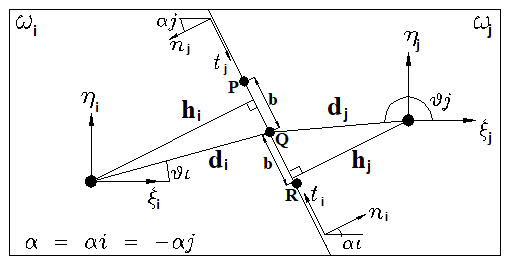
where is the angle of the connection side of element referring to –axis and is called distortion angle (Figure 5). is the distance from the baricenter of element i to the center of the interface and is the minimum distance between the baricenter of element and the interface .
| Figure 5. Interface i-j |
A measure of stress, work–conjugated to the strain, is assigned to each connecting device, and is assembled into the vector as follows:
|
|
(8) |
where and are the axial stresses in the connection point and , and is the shear stress in . Forces are related by:
|
|
(9) |
The constitutive law correlates the strains and stresses:
|
|
(10) |
where is the tangential stiffness matrix of the connection side:
|
|
(11) |
Replacing Equation (6) in Equation 10 and this in Equation (9), it obtains:
|
|
(12) |
4. Mechanical characteristics of the interfaces
4.1 Elastic properties
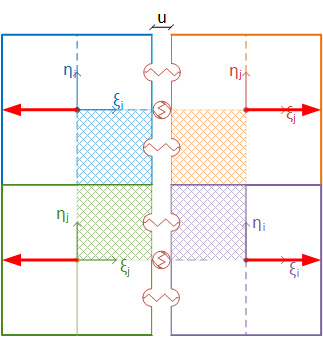
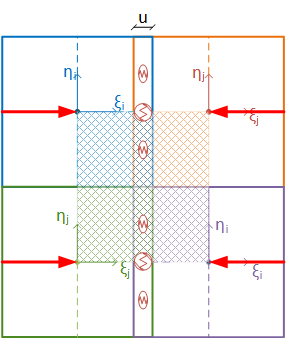
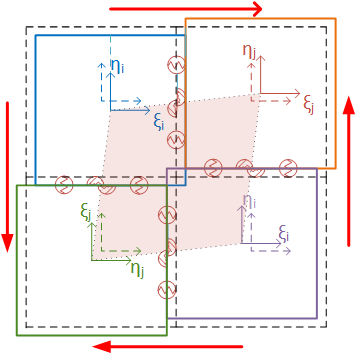
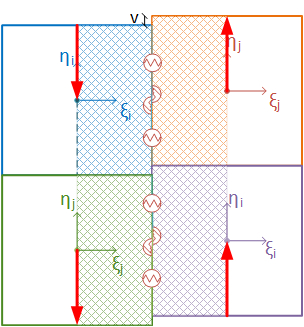
The elastic characteristics of the connecting devices are assigned with the criterion of approximating the strain energy of the corresponding volumes of pertinence in the case of simple deformation (Figure 6). The overlapping of neighbouring rigid elements in the case of relative compression should not be interpreted as material interpenetration. In fact, it should be seen as the overall mutual approaching of the element barycentres according to the deformation (or crushing) of materials due to compression of the volume of pertinence [19].
|
|
| (a) | (b) |
|
|
| (c) | (d) |
| Figure 6. Simple deformation of rigid elements and the volume of pertinence. (a) Tensile volume. (b) Compressive volume. (c) Shear volume. (d) Sliding volume | |
For an orthotropic material in plane deformation, the matrix of elasticity is given by:
|
|
(13) |
where , , ; is the Young modulus, is the Poisson’s coefficient and is the shear modulus.
On the other hand, the stress and the strain Η vectors are:
|
|
(14) |
|
|
(15) |
The siffness of the elastic devices is obtained by equating the strain energy of the material and the strain energy of the connections :
|
|
(16) |
Thus, the axial and shear stiffness are:
|
|
(17) |
|
|
(18) |
In addition, the two axial devices are separated from the middle point of the side by a length in order to take into account the bending momento, where .
|
|
| (a) | (b) |
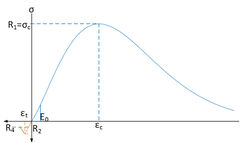
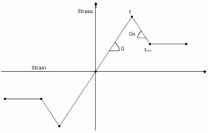
| Figure 7. Constitutive laws. (a) Axial. (b) Shear | |
4.2 Strength and Plastic properties
The monotic constitutive laws are assigned to the connecting devices adopting a phenomenological approach. These laws are based on experimental monotonic tests currently available in literature. Different rules are assumed for the axial devices and for the shear device, as sketched in Figure 7. For the axial spring, the skeleton curve under compression is given by:
|
|
(19) |
where is the initial elastic modulus and is the strain at the peak compression strength . Along this skeleton curve, the spring stiffness (, ) for compression loading is:
|
|
(20) |
The tensile axial response is defined by a tri-linear skeleton curve identified by the couples of points (, ) and (, ) which correspond to the peak and residual strengths. The plastic response of each axial connection is independent from the behaviour of any other connection device.
Symmetric stiffness and strength have been attributed to the shear connections. The skeleton curve is tri-linear, defined by four parameters: the initial shear stiffness , the softening stiffness , the maximum shear strength and the residual shear strength . The shear strength is related to the stresses of the axial connections according with Mohr-Coulomb criterion:
|
|
(21) |
where is the cohesion, is the axial stress and is the internal friction angle.
5. Validation
In general, the structural analysis is performed by an idealization of reality. Obviously, it is necessary that the chosen idealizations are appropriate to the problem under consideration, so that the proposed model will be able to represent the reality that it is simulating. Thus, numerical models can be validated by comparing the results with: experimental tests, already calibrated numerical models or damage in the structure.
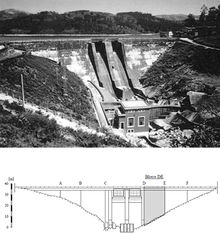
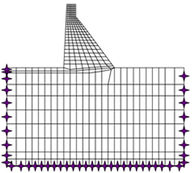
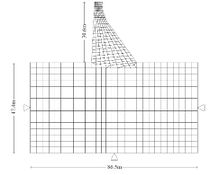
The proposed model was validated by using the discrete element model of the Guil1hofrei dam (Portugal) performed by Bretas et al. [15]. This is a masonry gravity dam, built in 1938, with a maximum height of 39 m and a total length of 190 m. The soil foundation of the dam is a granitic rock mass, of good quality (Figure 8). Table 1 shows the mechanical properties of the masonry and the soil foundation. For details of the dam characteristics please refer to [15,20]. Figure 9 shows the SDEM and the DEM meshes for the studied dam.
| Figure 8. Guilhofrei dam [20] | |
|
|
| (a) | (b) |
| Figure 9. Numerical models. (a) SDEM. (b) DEM [20] | |
| Property | Dam | Foundation |
| Volumetric weight [kN/m3] | 24 | 25 |
| Elasticity modulus [GPa] | 10 | 10 |
| Shear modulus [GPa] | 4 | 4 |
| Poisson coefficient | 0.2 | 0.2 |
| Compressive strength [MPa] | 10 | Elastic |
| Tensile strength [MPa] | 1 | Elastic |
| Cohesion [MPa] | 1.58 | Elastic |
| Friction angle [grad] | 55 | Elastic |
Three different load cases were considered:
- Load Case 1: Own weight (PoPo)
- Load Case 2: Own weight plus hydrostatic pressure (PoPo + PH)
- Load Case 3: Own weight plus hydrostatic pressure plus uplift pressure (PoPo + PH + Ps)
5.1 Load Case 1: Own weight
For the own weight analysis, only the volumetric weight of the dam was taken into account. Table 2 shows the results obtained by DEM [15] and the proposed model. It can be observed that the results are practically the same for both models. The own weight and the compression stress have error percentages are less than 10%. Although the error for displacements are around 15%, the displacements are in mm. Thus, small variations give great errors.
| Result | DEM | SDEM | Error [%] |
| Own weight [kN] | 9,700 | 9,500 | 2.0 |
| Maximum compressive stress [MPa] | 0.84 | 0.87 | 7.4 |
| Maximum horizontal displacement [mm] | 2.5 | 2.1 | 14.5 |
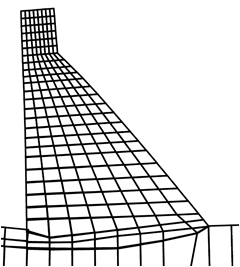
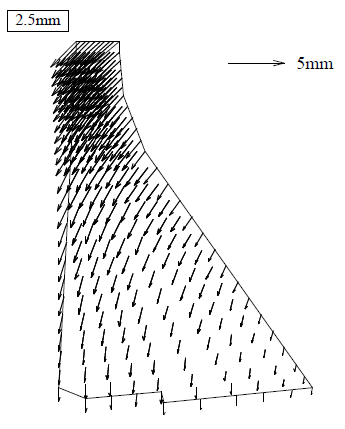
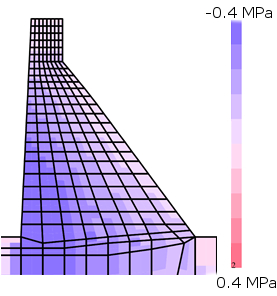
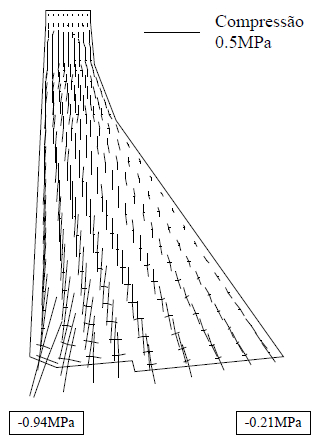
Figure 10 shows the deformation produced by the dam’s own weight, in which it can be observed that it deforms slightly upstream. This coincides with the real phenomenon, since most of the mass is on this side of the dam. So that when the hydrostatic pressure will apply, the forces remain in equilibrium. Figure 11 shows the stress maps for vertical axial stresses. It can be seen that the maximum compressive stress is located upstream at the foot of the dam, for both models.
|
|
| (a) | (b) |
| Figure 10. Own weight deformed. (a) SDEM. (b) DEM [20] | |
|
|
| (a) | (b) |
| Figure 11. Vertical axial stress maps due to own weight. (a) SDEM. (b) DEM [20] | |
5.2 Load Case 2: Own weight plus hydrostatic pressure
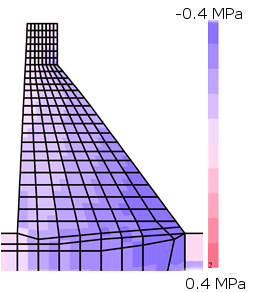
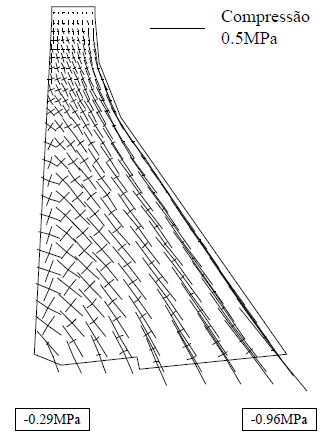
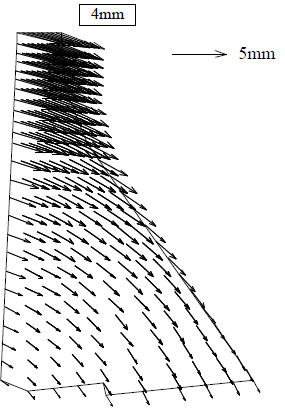
Table 3 shows the obtained results. It can see that no tensile stresses are in the dam due to the own weight load (Figure 12). The error percentages are around 15%. This can be explained in terms of the fundamental assumptions implied. The DEM model used by Bretas et al. [15] is a particular type of DEM with deformable blocks. In this case, the dam block is discretized into a mesh of 4-node elastic finite elements. Only the dam-rock joint is nonlinear. The errors reported are thus expectable, and can be considered acceptable.
| Result | DEM | SDEM | Error [%] |
| Maximum tensile stress [MPa] | 0.29 | 0.33 | 12.1 |
| Maximum compressive stress [MPa] | 0.96 | 1.10 | 14.5 |
| Maximum horizontal displacement [mm] | 4.0 | 3.4 | 15.0 |
|
|
| (a) | (b) |
| Figure 12. Vertical axial stress maps due to load case 3. (a) SDEM. (b) DEM [20] | |
|
|
| (a) | (b) |
| Figure 13. Deformed mesh due to load case 3. (a) SDEM. (b) DEM [20] | |
5.3 Load Case 3: Own weight plus hydrostatic pressure plus uplift pressure
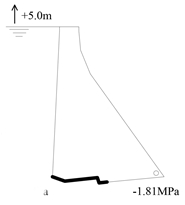
This load case considers additionally to the own weight and the hydrostatic pressure, the uplift pressure and a flood of 5 m over the crown of the dam (failure load). The resultant of the uplift pressure load was equal to 1,015 kN. This type of combination loads are similar to the failure loads of the dam.
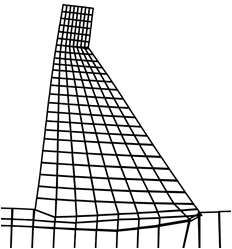
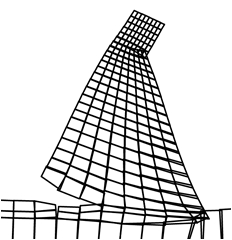
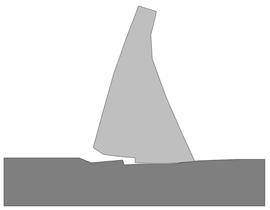
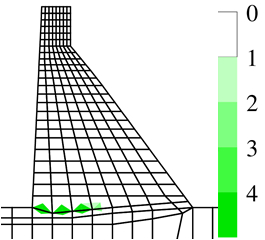
The maximum compressive stress at the base of the dam downstream was equal to 1.81 MPa for the DEM [15] and 2.1 for the SDEM (16% of error). Figure 14 shows the deformed mesh and the failure mechanism of the dam. The dam overturns downstream, since the tensile stresses at the base of the dam are overpassed.
|
|
| (a) | (b) |
|
|
| (c) | (d) |
| Figure 14. Deformed mesh (a) SDEM. (b) DEM [20] and failure mechanism (c) SDEM. (d) DEM [20] due to load case 3 | |
6. Numerical analysis of El Cajón dam
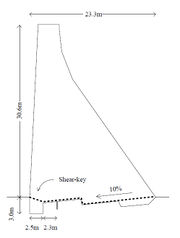
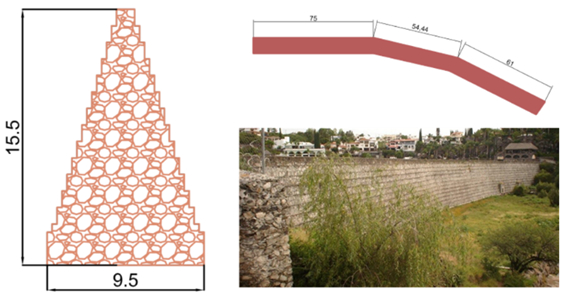
El Cajón dam was built in 1880 by farmers. Actually, the dam is used for recreation and for irrigation (Figure 15 ). It is located in Queretaro City, Mexico. The material of the dam is irregular stone masonry. It has a total height of 15.5 m and a length of a spillway crest of 187.6 m. Table 4 shows the mechanical properties of the materials [21].
|
| Figure 15. El Cajón dam (dimensions in meters) |
| Property | Value |
| Volumetric weight [kN/m3] | 20 |
| Elasticity modulus [GPa] | 2 |
| Shear modulus [GPa] | 0.8 |
| Poisson coefficient | 0.2 |
| Compressive strength [MPa] | 3 |
| Tensile strength [MPa] | 0.2 |
| Cohesion [MPa] | 0.2 |
| Friction angle [grad] | 37 |
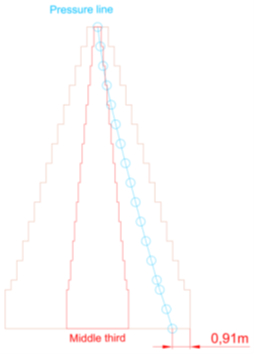
Firstly, the dam was analysed with the gravity approach, where the resultant of all forces acting on the dam must lie in the third middle of the base and a non tension material is considered. The hydrostatic pressure was applied up to the crown of the dam and the silt up to two thirds of the total height of the dam.
Figure 16 shows the position of the pressure line along the height of the dam. It can see that the resultant force lies out of the middle third. This means that the entire dam at upstream side should presents tensile damage distributed along the height of the dam. However in the reality, this dams does not have any structural problem. It does not presents cracks or water filtration. It has been working for 100 years without any problem. Thus, in order to understand the structural behaviour of the dam, it was analysed with the SDEM.
|
| Figure 16. Position of the pressure line |
Figure 17 shows the damage maps, while Figures 18 and 19 shows the stress maps and the deformed shape of the dam, respectively. It can see that the tensile damage is present at the base of the dam upstream. Additionally, diagonal compression damage is presented at the downstream of the dam. This damages is due to the flexural behaviour of the dam due to the hydrostatic pressure. However, there are no evidence of damage in the real dam. Thus, it means that the tensile strength of the material must be higher than the assumed in this analysis.
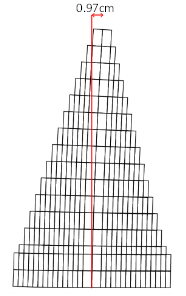
|
| Figure 17. Deformed shape |
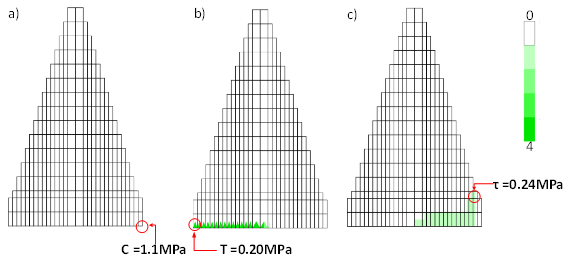
|
| Figure 18. Damage maps. (a) Compression. (b) Tension. (c) Shear |

|
| Figure 19. Stress maps. (a) Normal horizontal. (b) Normal vertical. (c) Shear |
A parametric analysis has been performed in order to study the influence of the tensile strength in the structural behaviour of El Cajón dam. The results show that for a non tensile strength, the entire dam at upstream presents tensile damage distributed along the height of the dam (as the gravity approach reports). No compression damage is observed; although there is diagonal tension damage (shear) down-stream (Figure 20). When the tensile strength is equal to 1 MPa, the structural behaviour of the dam changes completely. Because the tensile damage is presented only at the base of the dam, as well as the shear damage is reduced due to the less deformation of the dam (Figure 21).
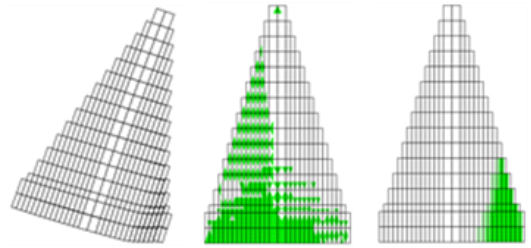
|
| Figure 20. Maps for non tensile strength. Deformed shape (left), tension damage (center), shear damage (right) |
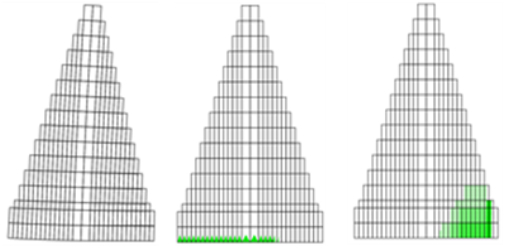
|
| Figure 21. Maps for tensile strength equal to 1 MPa. Deformed shape (left), tension damage (center), shear damage (right) |
7. Final Remarks
In this paper, a new model for the structural assessment of gravity dams by means of a semi–discrete approach is presented. This model can detect sliding, separation, overturning, crushing, tensile and shear damage. Thus, the proposed model can detect the different collapse mechanism of the dams, mainly: overturning and sliding.
It was validated by comparing with a discrete element model of a dam. The validation of the model was taking into account different load cases. One advantage of the proposed model is that it is no necessary the mechanical properties of the interfaces required in a discrete element model. The mechanical properties of the material are concentrated in the connecting devices between adjacent elements.
Parametric analyses show that the tensile strength of the material is the property of greater influence on the structural behaviour; since the damage pattern and the type of failure of the dam change as the tensile strength changes.
References
[1] W. Creager. Engineering for masonry dams. John Wiley & Sons, Inc., New York, 1917.
[2] S. Bhattacharjee, P. Léger. Fracture response of gravity dams due to rise reservoir elevation. Journal of Structural Engineering 121 (9) (1995) 1298–1305.
[3] Z. Bazant. Is no-tension design of concrete or rock structures always safe? – Fracture analysis. Journal of Structural Engineering 122 (1) (1996) 2–10.
[4] E. Bretas, P. Léger, J.V. Lemos. 3D stability analysis of gravity dams on sloped rock foundations using the limit equilibrium method. Computers and Geotechnics 44 (2012) 147–156. doi:10.1016/j.compgeo.2012.04.006.
[5] S. Bennati, M. Lucchesi. The minimal section of a triangular masonry dam. Meccanica 23 (1988) 221–225.
[6] Y. Calayir, A.A. Dumanoglu, A. Bayraktar. Earthquake analaysis of gravity dam-reservoir systems using the Eulerian and Lagrangian approaches. Computers & Structures 59 (5) (1996) 877–890.
[7] G. Fenves, A. Chopra. A computer program for earthquake analysis of concrete gravity dams. Report No. UCB/EERC-84/1, Earthquake Engineering Research Center, USA, 1984.
[8] R. Kumar, G.C. Nayak. Numerical modelling of tensile crack propagation in concrete dams. Journal of Structural Engineering 120 (4) (1994) 1053–1074.
[9] S. Bhattacharjee, P. Léger. Application of NLFM models to predict cracking in concrete gravity dams. Journal of Structural Engineering 120 (4) (1994) 1255–1271.
[10] M. Yazdchi, N. Khalili, S. Valliappan. Non-linear seismic behaviour of concrete gravity dams using coupled finite element – boundary element technique. International Journal for Numerical Methods in Engineering 44 (1999) 101–130.
[11] J. Pan, Y. Feng, F. Jin, C. Zhang, D.R.J. Owen. Comparison of different fracture modelling approaches to gravity dam failure. Engineering Computations 31 (1) (2014) 18–32. doi:10.1108/EC-04-2012-0091
[12] M. Leclerc, P. Léger, R. Tinawi. Computer aided stability analysis of gravity dams – CADAM. Advances in Engineering Software 34 (2004) 403–420.
[13] O.A. Pekau, C. Yuzhu. Failure analysis of fracture dams during earthquakes by DEM. Engineering Structures 26 (2004) 1483–1502. doi: 10.1016/j.engstruct.2004.05.019
[14] R. Deluzarche, B. Cambou. Discrete numerical modelling of rockfill dams. International Journal for Numerical and Analytical Methods in Geomechanics 30 (2006) 1075–1096. doi:10.1002/nag.514
[15] E. Bretas, J. Lemos, P. Lourenço. A DEM based tool for the safety analysis of masonry gravity dams. Engineering Structures 58 (2014) 248–260. doi:10.1016/j.engstruct.2013.10.044.
[16] M.B. Ftima, P. Léger. Seismic stability of cracked concrete dams using rigid block models. Computers & Structures 84 (2006) 1802–1814. doi:10.1016/j.compstruc.2006.04.012.
[17] S. Casolo. Modelling in-plane micro-structure of masonry walls by rigid elements. International Journal of Solids and Structures 13 (41) (2004) 3625–3641.
[18] S. Casolo, F. Peña. Modelo de elementos rígidos para el análisis de estructuras de mampostería. Revista Internacional de Métodos Numéricos para Cálculo y Diseño en Ingeniería 21 (2) (2005) 193–211.
[19] S. Casolo, F. Peña. Rigid element model for in-plane dynamics of masonry walls considering hysteretic behaviour and damage. Earthquake Engineering and Structural Dynamics 36 (8) (2007) 1029–1048. doi:10.1002/eqe.670.
[20] E. Bretas. Desenvolvimento de um modelo de elementos discretos para o estudo de barragens gravidade em alvanaria. Ph.D. thesis, Universidade do Minho, Portugal, 2012, in Portuguese.
[21] R. Meli. Ingeniería estructural de los edifícios históricos. Fundación ICA, Mexico City, 1998, in Spanish.
Document information
Published on 08/02/19
Accepted on 11/04/18
Submitted on 04/12/17
Volume 35, Issue 1, 2019
DOI: 10.23967/j.rimni.2018.04.001
Licence: CC BY-NC-SA license
