Abstract
In this chapter we present recent advances in the Discrete Element Method (DEM) and in the coupling of the DEM with the Finite Element Method (FEM) for solving a variety of problems in non linear solid mechanics involving damage, plasticity and multifracture situations.
1. Introduction
The Discrete Element Method (DEM) is a popular technique for analysis of the mechanics of granular matter, as well as for modeling multifracture situations in frictional materials such as concrete and geomaterials.
The Finite Element Method (FEM), on the other hand, is a standard numerical technique for linear and non linear analysis of structures. Differently from the DEM, the FEM has difficulties for reproducing multifracture situations in solids. The combination of FEM and DEM procedures seems therefore a win-win situation for modeling and simulation of a wider range of problems in non linear mechanics, than using any of the two methods separately.
In this chapter we present first recent advances in the DEM for non linear analysis of cohesive and non cohesive materials. Then a method for coupling the DEM and FEM procedures and for studying the interaction of physical particles and deformable solids es explained. In the last part of the chapter we present an approach for modeling multifracture situations in a solid by starting with the FEM analysis of the continuum domain in the standard manner. Discrete elements at the element nodes are progressively introduced as damage on the center of the element sides exceeds a certain value. Examples of this FEM-DEM technique are presented for a number of structural problems involving single fracture and multifracture situations such as the failure analysis of concrete samples and beams under external loads, a shale rock domain under a pulse load and blasting situations in a tunnel front and a granite rock specimen.
2. A local DEM model
2.1 DEM model overview
The DEM was initially developed by Cundall et al. [5] in the 1970's. It is based in the interaction of discrete elements (also called particles) – typically cylinders (in 2D) and spheres (in 3D) – to simulate the behavior of continuum and discontinuum domains [2,3,6,7,12,14,15,21,24,26,31]. This interaction is governed by a set of kinematic equations involving the forces acting over the discrete elements and the displacements, velocities and accelerations of the particles. The forces acting over a discrete element are related to the stresses and strains according to a constitutive model. In our work we use the local constitutive model for the DEM for cohesive and non-cohesive materials proposed by Oñate et al. [21]. In the following a brief description of this model is presented.

|
| Figure 1: Motion of a rigid particle |
|

|
| (a) | (b) |
| Figure 2: (a) Definition of contact interface between two discrete particles. (b) Forces acting along the normal and shear directions on a contact interface section | |
2.1.1 Kinematic equations and integration scheme
The translation and rotation of the particles in the DEM is governed by the standard dynamics equations for rigid bodies,
|
|
(1) |
where and are the -th particle displacement and the angular velocity respectively, and are the mass and the inertia tensor of the particle, and and are vectors containing the forces and torques due to the interaction of a particle with its neighbors (Figure 1). The set of forces applied on a particle include external forces (), damping forces () and interaction forces between neighbor particles () (Figure 2)
|
|
(2) |
where is the number of particles adjacent to the th particle.
The expression for the torques can be derived from Eq.(2) [22]. The dynamic equations (1) are integrated in time using an explicit scheme as expressed in (3) for the translation motion,
|
|
(3) |
The explicit time integration scheme is chosen due to the high computational cost of the DEM solution for large problems. However, the stability of the scheme is conditioned to the time step value. The critical time step is related to the high frequency of the problem, (), i.e.
|
|
(4) |
where is a fraction of the critical damping [5,22].
2.1.2 Forces acting over the discrete element
The interaction forces at the contact interface between two particles i and j () are obtained from the normal () and tangential () components (Figure 2b).
The normal component of the interaction forces is calculated as,
|
|
(5) |
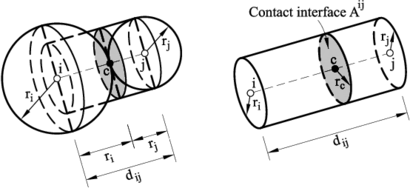
where is the normal stress at the contact interface, is the minimum radius of the two interacting particles (Figure 2a) and is a parameter that dependes on the number of contacts and the packing of the particles [21]. In our work we have used a global definition of where and are respectively the average number of contacts per sphere and the average porosity for the whole particle assembly [21]. The normal stress is calculated from the strain and the strain rate along the normal direction as,
|
|
(6) |
where is the Young modulus, is a local damping parameter calculated as
|
|
(7) |
where is the normal stiffness parameter (see Eq.(10)).
The normal strain and strain rate values are computed from the kinematic variables as,
|
|
(8) |
where and are the relative displacements and the relative velocity between two particles along the normal direction at the contact interface and is the distance between the centroids of the two particles (Figure 2b).
Equations (5)–(8) lead to a general relation between for the normal force and the kinematic variables as
|
|
(9) |
where and are the normal stiffness and the normal viscous damping parameters at the contact interface between particles and that can be deduced from Eq.(9) as
|
|
(10) |
A similar approach leads to the constitutive expression for the shear forces in the two tangential directions as [21]
|
|
(11) |
where vector is the shear component of the relative displacements between particles, calculated as,
|
|
(12) |
In Eq.(11) is the shear stiffness parameter at the contact interface (assumed to be the same for both shear directions), given by
|
|
(13) |
where is the Poisson's ratio of the material.
The damping forces are computed from the application of a global damping over the set of particles. This damping component is characterized by translation () and rotation () damping parameters defined as a fraction of the stiffness parameters. In this work we have taken . The damping forces act in opposite direction to the motion of the particles according to the following expressions:
|
|
(14.a) |
|
|
(14.b) |
The local DEM constitutive model described above holds for cohesive and non-cohesive materials, this latter as a particular case of the former, when the bonds between the particles are assumed to be initially broken. More details can be found in [21].
2.2 Normal and shear failure
Cohesive bonds at a contact interface are assumed to start breaking when the interface strength is exceeded in the normal direction by the tensile contact force, or in the tangential direction by the shear force. The uncoupled failure (decohesion) criterion for the normal and tangential directions at the contact interface between particles and is written as
|
|
(15) |
where and are the interface strengths for pure tension and shear-compression conditions, respectively, is the normal tensile force and is the modulus of the shear force vector (Figure 2 and Eq.(11)).
The interface strengths are defined as
|
|
(16) |
where and are the tensile and shear strengths respectively, is the compressive normal force at the contact interface and is a (static) friction parameter, where is an internal friction angle. These values are assumed to be an intrinsic property of the material and are determined experimentally. In our work is taken as the tensile strength of the material measured in a bending-tensile (BT) or a Brasilian tensile strength test [21].
As for the shear strength we have estimated its value as a percentage of the maximum compressive stress in a uniaxial compression strength (UCS) test, , as
|
|
(17) |
where is a parameter that is calibrated in numerical experiments via shear and UCS tests. Typically [21].
Following tension failure, the constitutive behavior in the shear direction is governed by the standard Coulomb law
|
|
(18) |
where is a dynamic Coulomb friction coefficient and is the post-failure internal friction angle. Both parameters are determined from experimental tests.
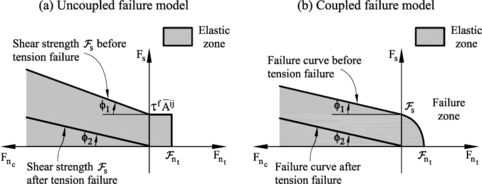
Figure 3 shows the graphical representation of the failure criterium described by Eqs.(15), (16) and (18). This criterium assumes that the tension and shear forces contribute to the failure of the contact interface in a decoupled manner. On the other hand, shear failure under normal compressive forces follows a failure line that is a function of the shear failure stress, the compression force and the internal friction angle.
Indeed, a coupled failure model in the tension-shear zone can also be used, as described in [21]. For the numerical tests presented in this work the uncoupled model has been used.
Figure 4 shows the evolution of the normal tension force and the shear force modulus at a contact interface until failure in terms of the relative normal and tangential displacement increments. Elastic damage under tensile and shear conditions has been taken into account in this work by assuming a linear softening behaviour defined by the softening moduli and introduced into the force-displacement relationships in the normal (tensile) and shear directions, respectively (Figure 4). For details see [21].
|
| Figure 3. Failure line in terms of normal and shear forces. Uncoupled failure model. (b) Coupled failure model |
 |
| Figure 4. Undamaged and damaged elastic moduli under tension (a) and shear (b) forces |
2.3 Elasto-plastic model for compression forces
The compressive stress-strain behaviour in the normal direction at the contact interface for frictional cohesive materials, such as cement, rock and concrete, is typically governed by an initial elastic law followed by a non-linear constitutive equation that varies for each material. The compressive normal stress increases under linear elastic conditions until it reaches the limit normal compressive stress . This is defined as the axial stress level where the experimental curve relating the axial stress and the axial strain starts to deviate from the linear elastic behaviour. After this point the material is assumed to yield under elastic-plastic conditions.
The elasto-plastic relationships in the normal compressive direction are defined as
Loading path
|
|
(19.a) |
Unloading path
|
|
(19.b) |
In Eqs.(3.3) and are respectively the variation of the normal compressive force and the normal (relative) displacement, is the initial (elastic) compressive stiffness for a value of (Figure 5), and is the tangent compressive stiffness given by
|
|
(20) |
where is the slope of the normal stress-strain curve in the elastoplastic branch (i.e. , , in Figure 5).
Plasticity effects in the normal compressive direction affect the evolution of the tangential forces at the interface, as the interface shear strength is related to the normal compression force by Eq.(16).
Figure 5 shows the diagram relating the compressive axial stress and the compressive axial strain used for modelling the elasto-plastic constitutive behaviour at the contact interfaces. The form of each diagram is obtained from experimental tests [8].
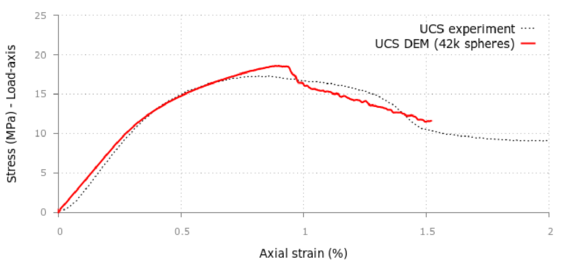
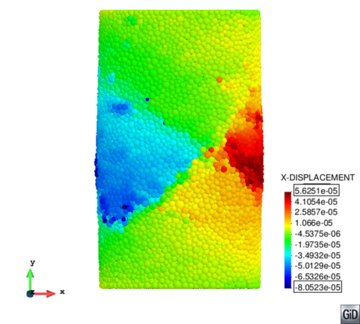
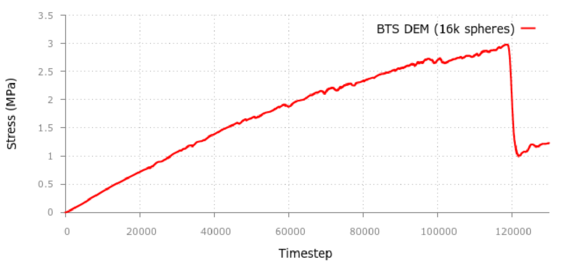
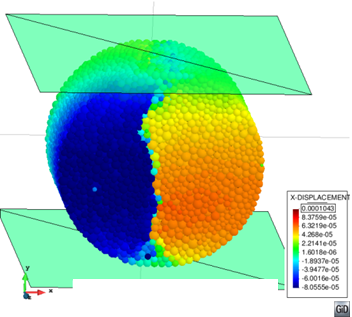
Figures 6 and 7 show an example of the DEM to the analysis of application of a UCS test and a BST of a cylindrical specimen for a cement material. The material parameter are shown in Table 1.
| (g/cc) | (GPa) | (MPa) | (MPa) | |||
| 1.70 | 0.30 | 0.40 | 3.80 | 0.20 | 4.80 | 8.50
|
| LCS1 | LCS2 | LCS3 | YRC1 | YRC2 | YRC3 | |
| (MPa) | (MPa) | (MPa) | ||||
| 8.5 | 9.0 | 11 | 3 | 9 | 24 | 1.0 |
2.4 Enhanced local constitutive model for the DEM that accurately reproduces the behavior of a continnum
The standard DEM technique is known to suffer from sensitivity to the packaging pattern and density of the particles when applied to the linear elastic analysis of a continuum. Standard features of a continuum domain, such as the Poisson's ratio effect, are difficult to predict with the DEM in a consistent manner.
Celigueta et al. [2] have presented a procedure for correcting the local constitutive equations at a contact interface in the DEM, so that it can be accurately applied for predicting the elastic behavior of a continuum.
The enhanced local constitutive model for the DEM is based on a modified expression of the force-displacement relationships at the contact interface between particles and (Eqs.9 and 11) as follows
|
where and are the normal and tangential stiffness parameters associated to the contact interface given by Eqs.10 and 12, respectively and is the relative displacement in the th tangential direction (Figure 2).
The underlined terms in Eqs.21 and 22 introduce the effect of the average stress field at the contact interface on the normal and tangential forces at the interface. Details of the computation of these terms is given in [2].
The stresses and in Eq.21 are obtained by projecting the average stress tensor for the th particle into the local coordinate system () (Figure 2b). Tensor is computed as
|
|
(23) |
where is the number of contact points for the th particle, is the vector connecting the center of the particle to the th contact point, is the force vector at the th contact point and is a volume associated to the particle used to average the stresses.
A good estimation of is essential for the success of this approach. In our work we have estimated using the areas of the contact interfaces associated to each particle as
|
|
(24) |
where is an enhanced value of the area of the contact interface between particles and . The value of is computed as
|
|
(25) |
where is the area of the th contact interface computed by Eq.5, is the radius of the th particle, is the sum of the contact interface areas and is a parameter that depends on the number of neighboring particles to the th particle and on the uniformity of the contact areas due to a random distribution of the particle sizes. More details are given in [2].
The non-local terms in Eqs.21 and 22 have proven to be essential for accurately predicting the elastic and non-linear response of samples of cohesive material using the DEM.
As an example Table 2 shows the expected and computed values for the Young's modulus and the Poissson's ratio for a prismatic sample of elastic material modelled with cartesian, staggered and random distribution of spheres. Note the large errors for the values of and using the standard DEM for staggered and random packings. The errors are negligible when the enhanced local constitutive model for the DEM presented in the previous lines is used.
The enhanced local constitutive model for the DEM has also shown an excellent behavior for accurately predicting the non-linear response and cracking pattern of geomaterials and concrete using a simple Rankine failure model at the contact interface.
| Input parameters: , | ||||||
| Cartesian packing | Staggered packing | Random packing | ||||
| Standard | Improved | Standard | Improved | Standard | Improved | |
| DEM | DEM | DEM | DEM | DEM | DEM | |
| Poisson's ratio | -0.6 % | -0.6 % | -23.0 % | 0.7 % | -28.0 % | -0.2 |
| Poisson's ratio | -100.0 % | 0.22 % | -64.0 % | -2.9 % | -62.0 % | -3.5 |
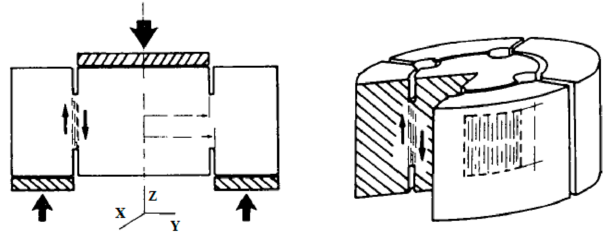
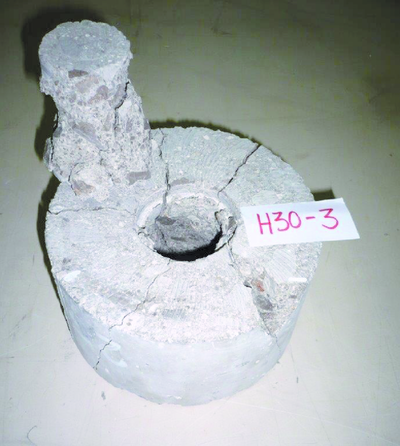
We present an application of the enhanced local constitutive model for the DEM to the analysis of a shear test [16] in a cylindrical notched specimen of concrete material. The definition of the test is shown in Figure 8. More details of this particular test can be found in [8].
|
| Figure 8: Shear test in notched concrete specimen |
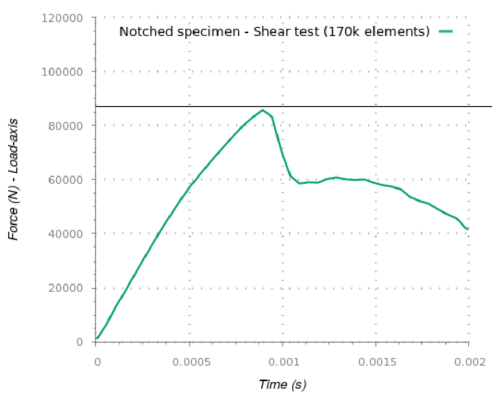
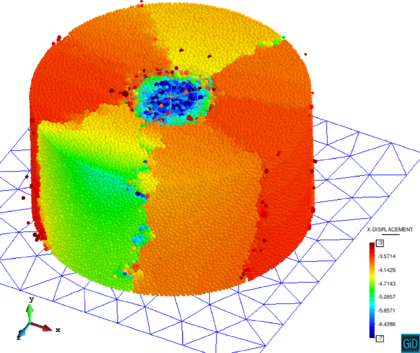
The material properties for the DEM analysis are GPa, , and MPa. The analysis was carried out using 170k spherical particles. Figure 9 shows the load vertical displacement curve obtained with the DEM. Good agreement of the maximum load compared to the experimental value of 82,3 kN is obtained. Figure 10a show the multifracture pattern on the cylindrical sample at failure. The experimental results are displayed in Figure 10b.
|
| Figure 9: Shear test in notched concrete specimen. Load-displacement curve obtained with the DEM. Experimental failure load = 82,3 kN |
|
|
| (a) | (b) |
| Figure 10: Shear test in concrete specimen. (a) DEM results. (b) Experimental results | |
The enhanced local DEM constitutive model can be used in conjunction with any constitutive law in solid mechanics for predicting the linear and non linear behavior of a solid. This opens the door for predicting with the DEM the linear and non linear response of solids and structures of any material (including metallic materias) [3], which is unusual for standard DEM models.
3. Interaction of discrete particles and solids modelled with the FEM
The interaction of discrete particles and solids can be studied by coupling the potential of the DEM and FEM approaches. Isolated particles can be modeled with the DEM, while solids are better modeled using the FEM. Indeed, complex objects can also be modeled using a collection of DEM particles, which allows one to use the standard frictional contact algorithms between particles and rigid/deformable objects developed for the DEM. Clearly, for rigid objects only the DEM particles discretizing the boundary of the object need to be accounted for.
The author's group has developed an innovative algorithms for modeling contact situations between discrete particles and solids modeled with the DEM [28]. The Double Hierarchy Method (termed ) is a simple contact algorithm specially designed to resolve efficiently the intersection of spheres with triangles and planar quadrilaterals but it can also work well with any other higher order planar convex polyhedra. A two layer the hierarchy is applied upgrading the classical the hierarchy method presented by Horner et al. [12], namely hierarchy on type of contact followed by hierarchy on distance. The first hierarchy classifies the type of contact (facet, edge or vertex) for every contacting neighbour in a hierarchical way, while the distance-based hierarchy determines which of the contacts found are valid or relevant and which ones have to be removed.
The algorithm has been developed taking into account its implementation in a parallel computing environment. This is particularly important for industrial problems involving a large number of particles interacting with a fine FEM mesh.
Summarizing, the contact search satisfies the following requirements:
- Includes poly-disperse elements for both the FEM and the DEM.
- Allows different FE geometries and primitives (triangle, quadrilateral, polygon).
- Ensures contact continuity in non-smooth regions (edges and vertices).
- Resolve multiple contacts and contact with different entities simultaneously.
- Low memory storage.
- Simple, fast and accurate need.
- Fully parallelizable.
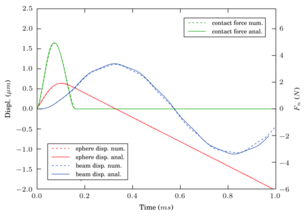
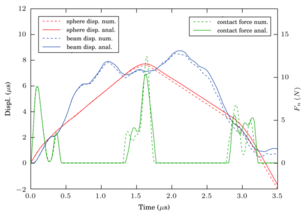
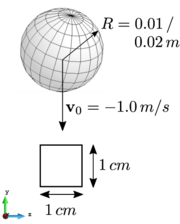
A simple particle-structure interaction example is presented next in order to assess the DEM-FEM coupling procedure. The example consists on a spherical particle colliding a simply supported beam (Figure 11). Two different cases are reproduced. The reference solution to this problem, taken from linear modal dynamics was proposed by Timoshenko [30] and is reviewed in [17].
The two examples are reproduced with the same DEM and FEM parameters. In the first one the particle radius is and the length of the beam is , while in the second one the particle radius is and the beam length is . The material properties and the simulation parameters are summarized in Table 3. The first case produces a single impact while the second yields three particle/beam impacts. The FEM meshes used are 8-nodded hexahedral elements respectively for the beam length, height and depth, respectively in the first example and hexahedra in the second example.

|
|
| Figure 11: Simply supported beam hit vertically at its centre by a sphere. (a) Front view. (b) Side view | |
| Material properties | DEM | Analysis parameters | |
| Sphere radius () | |||
| Density () | |||
| Young's modulus () | Initial velocity of sphere () | ||
| Poisson's ratio | Gravity () | ||
| Friction parameter | 0.0 | Neighbour search freq. | 50 |
The results shown in Figure 12 are quite satisfactory and the model reproduces well the contact forces. Once the contact ends, the beam oscillates in a combination of different excited modes. The largest frequency mode, which can be easily identified in the figures, corresponds to the natural frequency of the beam and it is perfectly matched. The higher vibration modes however, are not correctly captured by the linear hexahedral elements, as they are not the best suited elements to simulate flexural modes. Consequently, there is a deviation on the second and third contact events in the second example (Figure 12b).
More details of this example and the procedure can be found in [28,29].
3.1 A FEM-DEM procedure for multifracture analysis of solids
The DEM is a flexible method to simulate granular and non-continuum media, in particular the propagation of initial cracks. On the other hand, these contact properties are defined at the micro scale, while the material properties usually refer to experimental results in the macro scale. The step between both scales is not easy and requires a calibration task. The FEM otherwise is based in a continuum formulation involving the macro properties of the material. The FEM allows one to establish failure criteria compatible with the equilibrium equations in continuum mechanics, which makes it consistent and easy to apply for different materials.
The distance between DEM and FEM approaches is wide. Extensive research has been carried out in last years to combine FEM and DEM procedures, taking profit the advantages of both numerical methods. Combination of the FEM with the standard DEM using circular and spherical particles are reported in [13,20,22,27]. A combined finite-discrete element method based on the splitting of the finite elements into discrete elements of poligonal shape is presented in [10,11,18,19,20,23]. Zárate and Oñate [32,35] have recently presented a coupled FEM-DEM formulation for the numerical simulation of cracks starting from a finite element discretization of the domain.
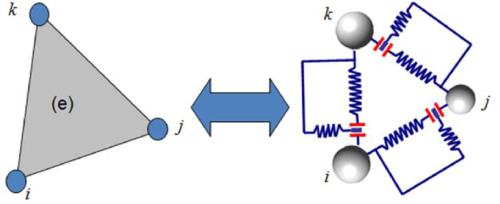
The FEM-DEM formulation presented in [32,35] discretizes the continuum using linear 3-noded triangles (in 2D) and 4-noded tetrahedra (in 3D) whose nodes define the position of a (virtual) discrete element. These discrete elements are introduced in the simulation process when cracks appear. The normal contact forces between discrete elements are calculated integrating the stiffness matrix of the linear triangle along its sides that connect the discrete particles as shown in Figure 13 [32]. The mechanical problem in the crack-free region is solved using the standard FEM and an appropriate damage model. In the examples shown in this chapter damage onset and evolution of damage is governed by a Mohr-Coulomb failure criteria.
|
| Figure 13: Equivalence between stiffness matrix (FEM) and cohesive link (DEM) |
Onset of a crack at the center of an element side depends on the damage level at that point. The stresses over the edge are computed as the mean of the stresses in the elements sharing that side.
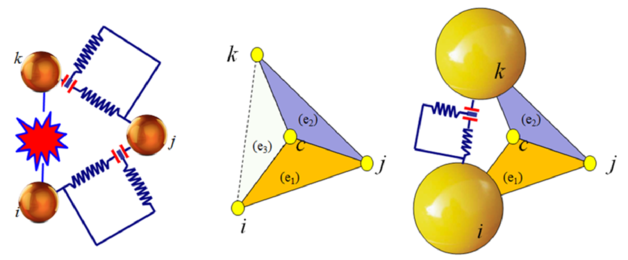
Once the damage limit is reached, a stiffness loss is induced in the triangle. The stiffness loss is associated to the area determined by the centroid of the triangle and the damaged side as shown in Figure 14.
|
| Figure 14: Equivalence between stiffness matrix (FEM) and cohesive link (DEM) with a damaged edge |
The stiffness matrix of a damaged element is recalculated at every time step as follows
|
|
(26) |
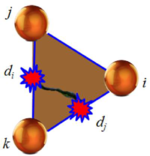
where is the initial stiffness matrix of the undamaged element and and are to the two maximum values of the damage parameters for the three element sides (Figure 15).
|
| Figure 15: Three-noded triangle with two sides damaged |
When a cohesive bond is removed the side nodes of the element are disconnected and two discrete particles are introduced at the same nodal positions. Their radii and masses are defined as the maximum ones to guarantee contact without overlapping other discrete elements in order to avoid spurious contact forces [14].
Once the discrete elements are created their interaction is governed according to contact and friction laws, as in the general DEM formulation described in a previous section.
A relevant point in the FEM-DEM approach described above is its computational cost. Most of the cost in a DEM simulation is due to the contact searching algorithms. In the FEM-DEM technique presented the number of discrete elements is in general much lower than the number of nodes because the fractured area is typically smaller than the whole calculation domain. Hence, the computational time consumed by the contact searching algorithms is much lower than in a standard DEM solution.
3.2 Examples of application of the FEM-DEM procedure
Four-point bending beam
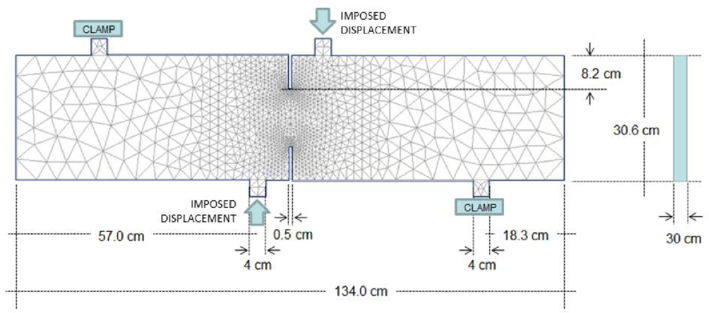
The 2D version of the FEM-DEM technique is applied to the study of the failure of a double notch concrete beam analyzed under plane stress conditions. The beam is supported at two points and deforms in a bending mode by imposing displacement at the two points depicted in Figure 16 where the beam dimensions are also shown.
|
| Figure 16: Double notched concrete beam. Dimensions and boundary conditions |
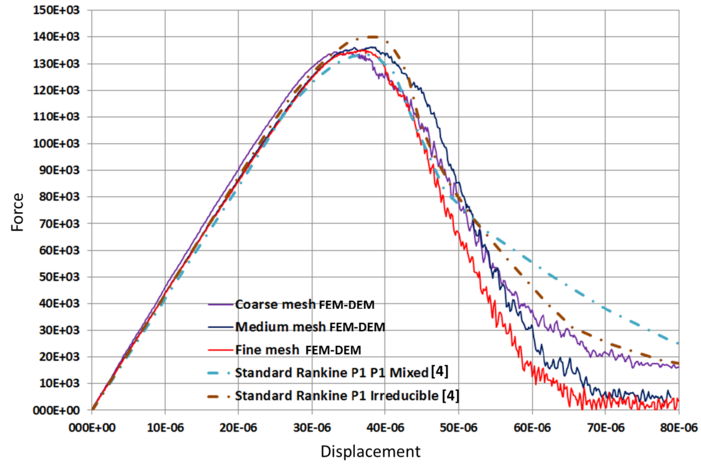
Figure 17 shows the crack path obtained with the 2D FEM-DEM approach for the three meshes analysed which coincide with the numerical results of Cervera et al. [4]. The mix-mode fracture is clearly seen. Figure 18 shows the plots of the vertical reaction at a support version the imposed displacement at any of the two points depicted in Figure 16. The graphs are in good agreement with the results reported in [4].
 ] ]
|
| Figure 18: Double notched concrete beam. Relationship between the force and the imposed displacement at any of the two points depicted in Figure 5. 3D FEM-DEM results are compared with those given in [4] |
Brazilian tensile strength (BTS) test
We have applied the 3D FEM-DEM procedure to the simulation of a BTS test on a cylindrical concrete sample of diameter and thickness (). The tensile strength value is computed by [1]:
|
|
(27) |
were is the applied load.
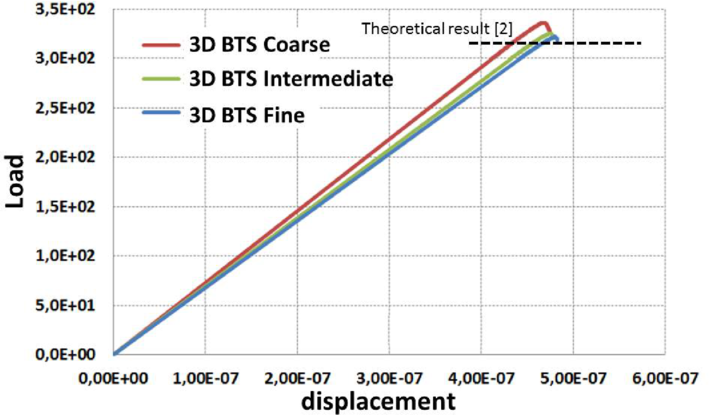
The material properties are GPa, , N/m, KPa and J/m. Using Eq.(27) this corresponds to a failure load of N.
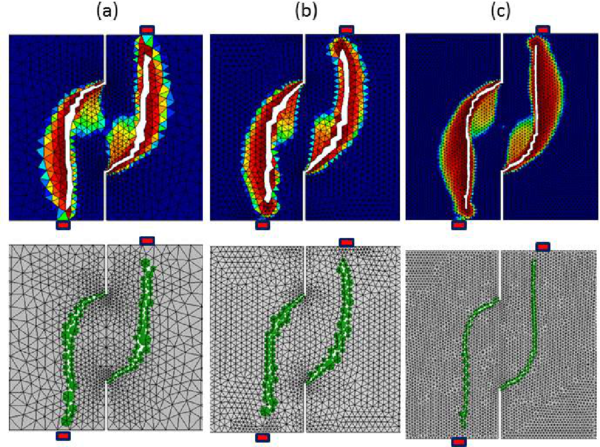
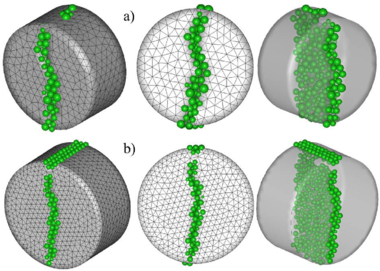
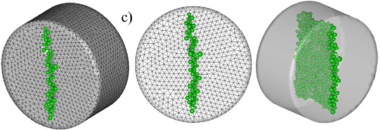
Three finite element meshes were used for the analysis with , and 4-noded linear tetrahedra, respectively. The crack patterns obtained for each mesh are depicted in Figure 19. The numerical results for the load-displacement curve are presented in Figure 20. The numerical values obtained for the tensile strength were (coarse to fine mesh) Pa, Pa and 10 235 Pa which yielded a range of to error versus the expected value of kPa.
| |
| |
| Figure 19: 3D FEM-DEM analysis of BTS test on a concrete specimen. Damage zone and discrete elements generated. (a) Coarse mesh. (b) intermediate mesh. (c) Fine mesh | |
|
| Figure 20: 3D FEM-DEM analysis of BTS test on a concrete specimen. Force-displacement relationship for the three meshes used |
Fracture of shale rock under a pulse load
The FEM-DEM procedure has been applied to the study of the fracture of a rock mass under a pulse load [9]. This is a usual procedure in the so-called fracking technique used in the oil and gas industry.
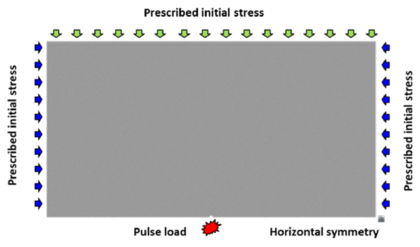
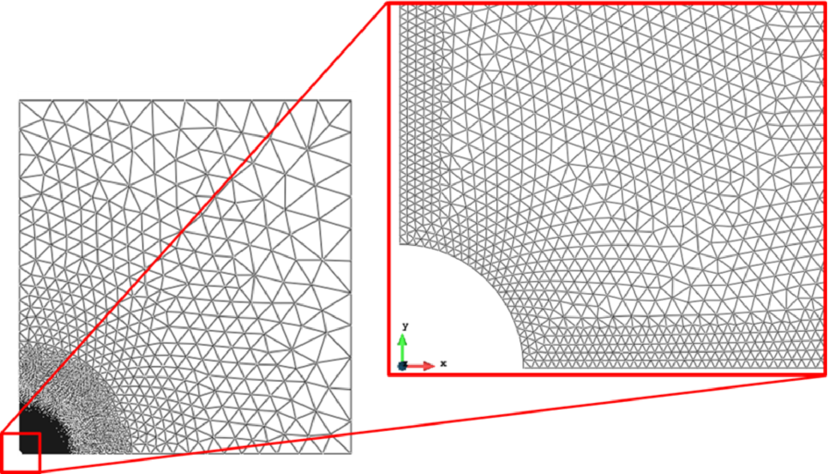
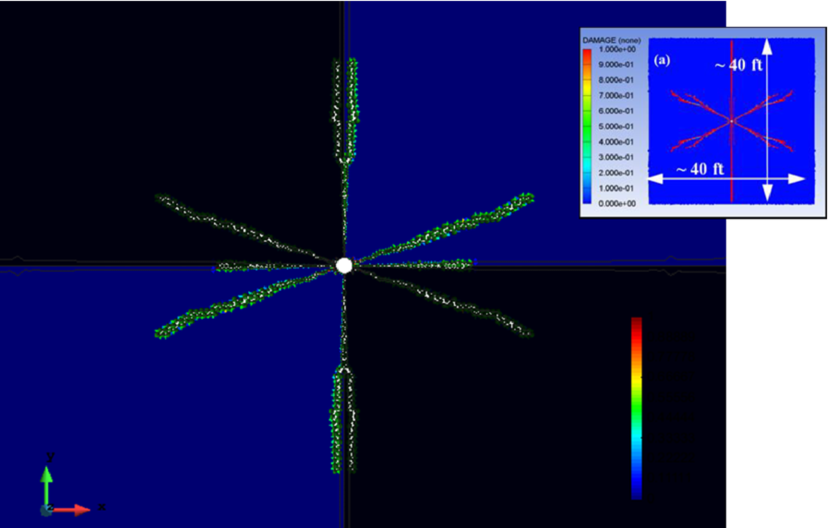
Figure 21 shows the geometry of the domain analyzed and the loads acting at the boundary. These loads are computed in terms of the depth of the rock mass analyzed. The evolution of the pulse load acting at central hole is shown in Figure 21. Figure 22 depicts the finite element mesh of 3-noded triangles used for the analysis. The fracture pattern in the rock obtained with the FEM-DEM technique for a depth of 500 ft are shown in Figure 23. The length of the vertical crack obtained is 36 ft which compares well with the length of 40 ft using the DEM [9] and also with an alternative FEM formulation [25].
|

|
| (a) | (b) |
| Figure 21: Fracture of shale rock. (a) Analysis domain and applied loads. (b) Pulse pressure function | |
|
| Figure 22: Shale rock domain under pulse load. Mesh of 3-noded triangles for FEM-DEM anaysis |
 ] ]
|
| Figure 23: Crack simulation with FEM-DEM model. Depth 500 ft. FEM results in box from [25] |
Multifracture of a tunnel front induced by a blast load
This example shows the capability of the FEM-DEM approach for simulating the evolution of multiple cracks in a tunnel front induced by a blast load.
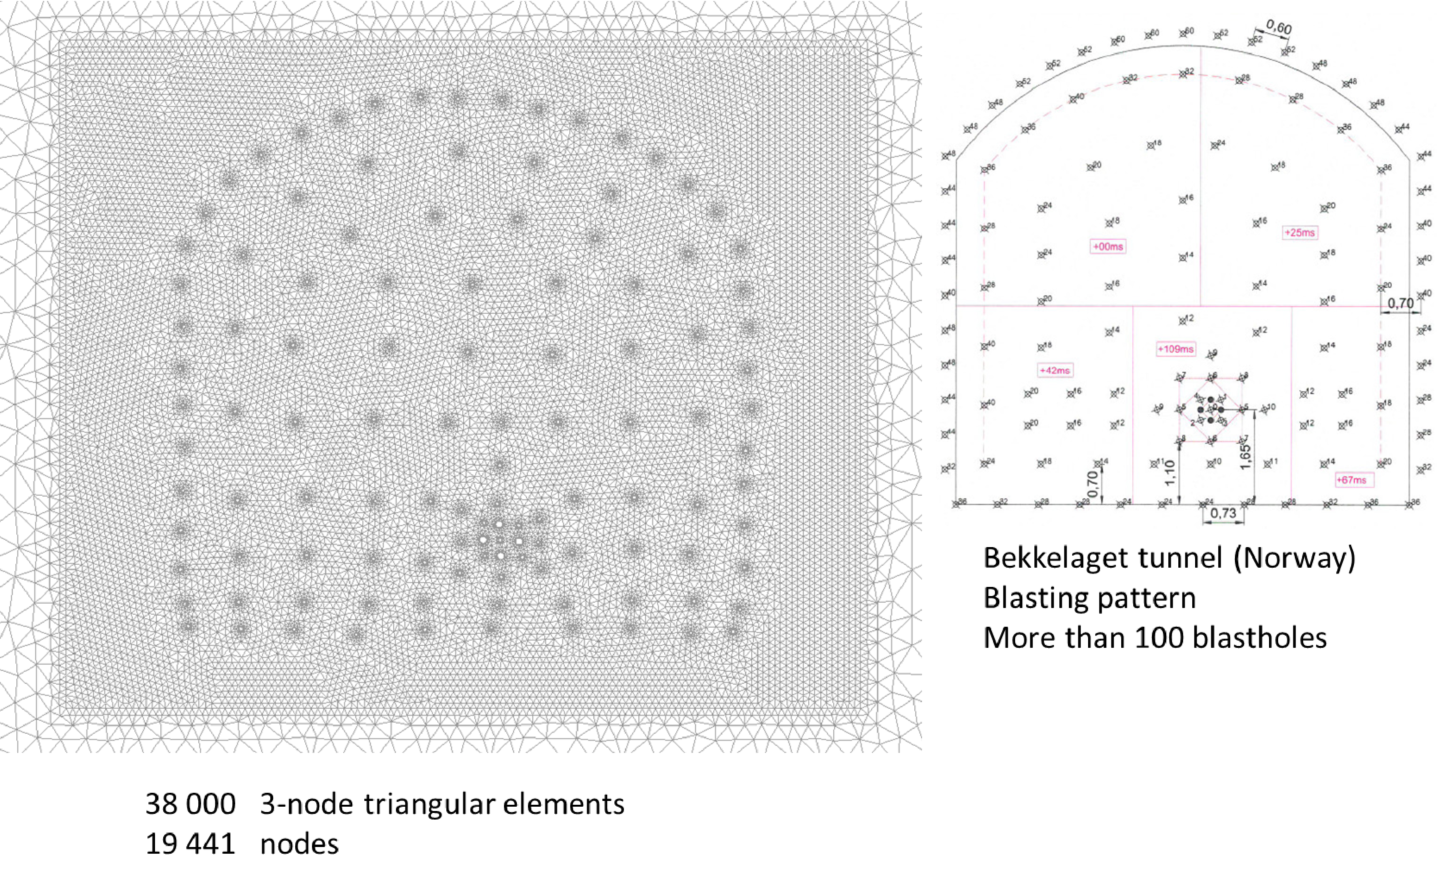
Figure 24 shows the geometry of the front of the Bekkelaget tunnel in Norway, including the distribution of blast holes and the mesh of 38000 3-noded triangles discretizing the tunnel front. Details of the material properties, the blasting sequence and the computational features of this problem can be found in [34].
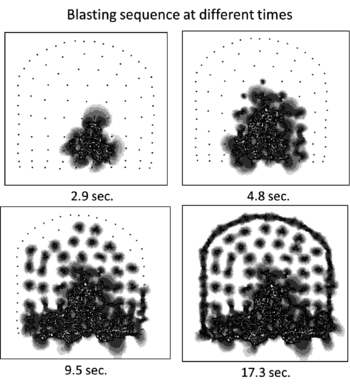
Figure 25 shows the evolution of cracks at the front induced by a particular blasting sequence. The results demonstrate the usefulness of the FEM-DEM technique for simulating this complex multifracturing problem.
|
| Figure 24: Distribution of blast holes at the front of the Bekkelaget tunnel (Norway) and finite element method for FEM-DEM simulation of the cracking pattern |
|
| Figure 25: Evolution of cracking at the front of the Bekkelaget tunnel induced by a blasting sequence. FEM-DEM results |
Fracture pattern in a granite rock specimen under pulse load accounting for the gas pressure
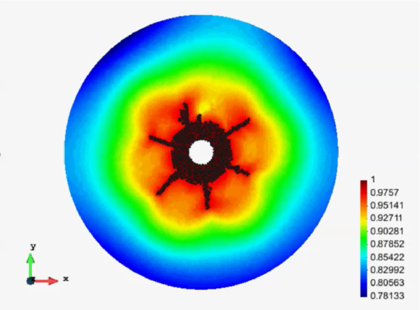
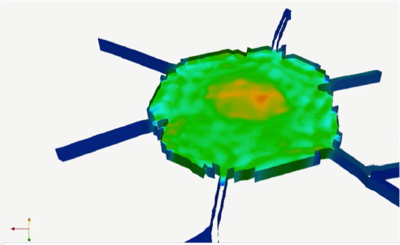
Figure 26 shows the fracture pattern in a cylindrical specimen of granite rock under a pulse load acting at the central hole. The effect of the gas filling the cracks has been taken into account by coupling the FEM-DEM procedure described earlier with a compressible flow FEM solver using an embedded solution technique. The coupling strategy solves the equations for the compressible gas flow in the finite element mesh that fills the spaces created by the cracks. Figure 26 shows a snapshot of the pressure field in the gas domain between the cracks at a certain instant. More information of this coupled solution can be found in [33].
|
|
| (a) | (b) |
| Figure 26: Fracture pattern in a cylindrical specimen of granite rock under an internal pulse load. FEM-DEM solution accounting for the effect of the gas filling the crackings. (a) Cracking pattern. (b) Pressure field in the gas domain within the cracks [33] | |
Concluding remarks
This chapter has shown the possibility of the DEM for linear and non linear analysis of cohesive materials and structures, as well as the advantages of coupling the FEM and DEM techniques for studying the interaction of particles with structures and the prediction of complex multifracture situations in solids.
Acknowledgements
This research was partially funded by the ICEBREAKER project of the European Research Council. Support for this work was also provided from the Office for Naval Research Global (ONRG) of the US Navy through the NICE-SHIP project. We also acknowledge the financial support of the CERCA programme of the Generalitat de Catalunya.
Bibliography
[1] Carneiro FLLB (1943) A new method to determine the tensile strength of concrete. In Proceedings of the 5th meeting of the Brazilian Association for Technical Rules 126–129. (In portuguese)
[2] Celigueta MA, Latorre S, Arrufat F, Oñate E (2017a) Accurate modelling of the elastic behavior of a continuum with the Discrete Element Method. Submitted to Comp Part Mech
[3] Celigueta MA, Arrufat F, Oñate E (2017b) Non linear analysis of solids accounting for damage, plasticity and fracture with the Discrete Finite Element. Comput Mech (Submitted)
[4] Cervera M, Chiumenti M, Codina R (2011) Mesh objective modelling of cracks using continuous linear strain and displacements interpolations. Int J Numer Methods Eng 87:962–987
[5] Cundall PA, Strack ODL (1979) A discrete numerical model for granular assemblies. Geotechnique 29(1):47–65
[6] Donzé F, Richefeu F, Magnier S (2009) Advances in Discrete Element Method applied to soil, rock and concrete mechanics. Electronic Journal of Geotechology Engineering 8:1–44
[7] Feng YT, Han K, Owen DRJ (2004) Discrete element simulation of the dynamics of high energy planetary ball milling processes. Materials Science and Engineering A 375:815–819
[8] Garcia T, Hurtado C, Cabrerizo J, Mc-Aloon R (2015) Experimental tests for H30 and H50 concrete samples (in Spanish). Laboratorio de Tecnología de Estructuras. Universitat Politecnica de Catalunya, LTE/TGV/0415-24, Barcelona
[9] González JM, Oñate E, Zarate F (2017) Pulse fracture simulation in shale rock reservoirs. DEM and FEM-DEM approaches. Comp Part Mech, March (Submitted)
[10] Han K, Peric D, Owen DRJ, Yu J (2000) A combined finite/discrete element simulation of shot peening processes–Part II: 3D interaction laws. Engineering Computations 17(6):680–702
[11] Han K, Owen DRJ, Peric D (2002) Combined finite/discrete element and explicit/implicit simulations of peen forming process. Engineering Computations 19(1):92–118
[12] Horner DA, Peters, FJ, Carrillo A (2001) Large scale discrete element modeling of vehicle-soil interaction. Journal of Engineering Mechanics 127(10):1027–1032
[13] Katagiri S, Takada S (2003) Development of fem-dem combined method for fracture analysis of a continuos media. Memoirs of the Graduate School of Science and Technology, Kobe University Japan 20A:65–79
[14] Labra C, Oñate E (2009) High-density sphere packing for discrete element method simulations. Commun Numer Meth Engng 25(7):837–849
[15] Labra C, Rojek J, Oñate E, Zárate F (2008) Advances in discrete element modelling of underground excavations. Acta Geotechnica 3(4):317–322
[16] Luong MP (1990) Tensile and shear strengths of concrete and rock. Engineering Fracture Mechanics 35:127–135
[17] Meijaard J (2007) Lateral impacts on flexible beams in multibody dynamics simulations. IUTAM Symposium on Multiscale Problems in Multibody System Contacts. Vol 1 Springer Netherlands, 173–182
[18] Moharnmadi S, Owen DRJ, Peric (1998) A combined finite/discrete element algorithm for delamination analysis of composites. Finite Elements in Analysis and Design 28(4):321–336
[19] Munjiza A, Owen DRJ, Bicanic N (1995) A combined finite-discrete element method in transient dynamics of fracturing solids. Engineering Computations 12(2):145–174
[20] Munjiza A (2004) The combined finite-discrete element method, ISBN 0-470-84199-0. Wiley
[21] Oñate E, Zárate F, Miquel J, Santasusana M, Celigueta MA, Arrufat F, Gandijota R, Valiullin K, Ring L (2015) A local constitutive model for the discrete element method. application to geomaterials and concrete. Computational Particle Mechanics 2:139–160
[22] Oñate E, Rojek J (2004) Combination of discrete element and finite element methods for dynamic analysis of geomechanics problems. Comput Meth Appl Mech Engrg 193:3087–3128
[23] Owen DRJ, Feng YT (2001) Parallelised finite/discrete element simulation of multi-fracturing solids and discrete systems. Engineering Computations 18(3-4):557–576
[24] Potyondy D, Cundall P (2004) A bonded-particle model for rock. International Journal of Rock Mechanics and Mining Sciences 41(8):1329–1364
[25] Reza Safari M, Gandikota R, Mutlu U, Ji M, Glanville J, Abass H (2013) Pulsed fracturing in shale reservoirs: Geomechanical aspects, ductile-brittle transition and field implications. Presented at the Unconventional Resources Technology Conference, Denver, Colorado, USA, 12–14 August
[26] Rojek J, Labra C, Su O, Oñate E (2012) Comparative study of different discrete element models and evaluation of equivalent micromechanical parameters. Int J of Solids and Structures 49:1497–1517
[27] Rojek J, Oñate E (2007) Multiscale analysis using a coupled discrete/finite element method. Interaction and Multiscale Mechanics: An International Journal (IMMIJ) 1(1):1–31
[28] Santasusana M, Irazábal J, Oñate E, Carbonell JM (2016) The Double Hierarchy Method. A parallel 3D contact method for the interaction of spherical particles with rigid FE boundaries using the DEM. Comp Part Mech 3(3):407–428
[29] Santasusana M (2016b) Numerical techniques for non-linear analysis of structures combining discrete element and finite element methods. PhD Thesis, Barcelona, December
[30] Timoshenko S (1951) Goodier JN theory of elasticity. McGraw-Hill, Print
[31] Tran VT, Donzé F-V, Marin P (2011) A discrete element model of concrete under high triaxial loading. Cement and Concrete Composites 33(9):936–948
[32] Zárate F, Oñate E (2015) A simple FEM–-DEM technique for fracture prediction in materials and structures. Comp Part Mech 2(3):301–-314
[33] Zárate F, Löhner R, Oñate E (2017a) Modeling of multifracture in solids induced by blast load accounting for coupled gas solid interaction effects. Comp Part Mech (Submitted)
[34] Zárate F, Gonzalez JM, Oñate E (2017b) Application of the FEM-DEM technique to the multifracture of rock under blast load. Comp Part Mech (Submitted)
[35] Zárate F, Oñate E (2017c) Three dimensional FEM-DEM technique for multifracture analysis of solids and structures. Comp Part Mech (Submitted)
Document information
Published on 01/01/2017
Licence: CC BY-NC-SA license
Share this document
claim authorship
Are you one of the authors of this document?

