Abstract
We quantified the impacts of variations in meteorological parameters and emissions on decadal, interannual, and seasonal variations of atmospheric black carbon (BC) in the Tibetan Plateau for 1980–2010 using a global 3-dimensional chemical transport model driven by the Modern Era Retrospective-analysis for Research and Applications (MERRA) meteorological fields. From 1980 to 2010, simulated surface BC concentrations and all-sky direct radiative forcing at the top of the atmosphere due to atmospheric BC increased by 0.15 μg m−3 (63%) and by 0.23 W m−2 (62%), respectively, averaged over the Tibetan Plateau (75–105°E, 25–40°N). Simulated annual mean surface BC concentrations were in the range of 0.24–0.40 μg m−3 averaged over the plateau for 1980–2010, with the decadal trends of 0.13 μg m−3 per decade in the 1980s and 0.08 in the 2000s. The interannual variations were −5.4% to 7.0% for deviation from the mean, 0.0062 μg m−3 for mean absolute deviation, and 2.5% for absolute percent departure from the mean. Model sensitivity simulations indicated that the decadal trends of surface BC concentrations were mainly driven by changes in emissions, while the interannual variations were dependent on variations of both meteorological parameters and emissions. Meteorological parameters played a crucial role in driving the interannual variations of BC especially in the monsoon season.
Keywords
Black carbon ; Tibetan Plateau ; Interannual variations ; South Asian summer monsoon
1. Introduction
Black carbon (BC), formed from incomplete combustion (Bond et al., 2013 ; IPCC, 2013 ), has substantial impacts on climate because of its strong absorption of solar radiation (e.g., Horvath, 1993 ; Ramanathan and Carmichael, 2008 ). BC deposited on snow and ice can significantly decrease the surface albedo (Warren and Wiscombe, 1980 ; Flanner et al., 2007 ; Flanner et al., 2009 ), enhance surface snowmelt (Zwally et al., 2002 ; Flanner et al., 2007 ), and potentially change the regional hydrological cycle over the plateaus and mountain ranges (e.g., Qian et al., 2009 ; Qian et al., 2011 ). Ample evidences have shown that BC aerosols deposited on the Tibetan glaciers are responsible for the observed rapid glacier retreat in the region (e.g., Xu et al., 2009 ). Model simulations have shown that the annual direct radiative forcing (DRF) due to the atmospheric BC are 0.58–1.46 W m−2 at the top of the atmosphere (TOA) averaged over China (Li et al., 2016 ). The regional warming effect of BC over snow-covered regions can be even stronger (Jacobson, 2004 ; Flanner et al., 2007 ; Flanner et al., 2009 ).
The Tibetan Plateau is the worlds highest plateau with the third largest snow and ice mass (Xu et al., 2009 ). The snowmelt from the Tibetan glaciers is the primary source of freshwater supply for hundreds of million people in Asia (Immerzeel et al., 2010 ). Recent studies have shown that a strong BC-induced regional warming over the plateau results in the reduction of snow/ice cover and snow albedo (Lau et al., 2010 ; Menon et al., 2010 ; Yasunari et al., 2010 ), and an increase of runoff in early spring (Qian et al., 2011 ). Moreover, changes of snow cover in the region would affect energy and hydrological cycle, and further disturb the formation of the Asian summer monsoon (Lau and Kim, 2006 ).
Observations have shown strong warming and accelerated glacier retreat in the Tibetan Plateau in the past decades (Qin et al., 2006 ; Prasad et al., 2009 ). The major contributions of BC to the Tibetan Plateau are the emissions from South Asia and East Asia (Kopacz et al., 2011 ; Lu et al., 2012 ; Wang et al., 2015 ), which are the worlds two largest BC sources and are increasing in the past decades (Lu et al., 2011 ). Recent studies have shown that the increasing amount of BC transported to the Tibetan Plateau (Ming et al., 2008 ; Lu et al., 2012 ) accounts for half of the observed warming in the region (Ramanathan et al., 2005 ; Ramanathan et al., 2007 ).
Better understanding the changes of BC in the Tibetan Plateau on a decadal time scale would provide useful information for guiding measures to reduce BC emissions and to mitigate near-term climate warming in the region. To our knowledge, few studies have systematically examined the decadal, interannual, and seasonal changes of BC and analyzed their driving factors, especially in the Tibetan Plateau, due to the lack of observations and the limitation of models. Here we present the decadal, interannual, and seasonal variations of BC in the Tibetan Plateau for a 31-year period (1980–2010) using a global 3-dimensional chemical transport model (GEOS-Chem) driven by the Modern Era Retrospective-analysis for Research and Applications (MERRA) meteorological fields. We aim to quantify the roles of variations in meteorological parameters and anthropogenic and biomass burning emissions in the changes of BC in the Tibetan Plateau between monsoon and nonmonsoon seasons. We describe the GEOS-Chem model and numerical simulations in Section 2 . In Section 3 , we quantify the impacts of variations in emissions and meteorological parameters on the changes of BC and present the changes in all-sky TOA DRF of atmospheric BC in the Tibetan Plateau. Finally, summary and conclusions are given in Section 4 .
2. Methods
2.1. GEOS-Chem model
The GEOS-Chem model is driven by assimilated meteorology from the Goddard Earth Observing System (GEOS) of the NASA Global Modeling and Assimilation Office (GMAO) (Bey et al., 2001 ). Here we use GEOS-Chem version 9-01-03 (available at http://geos-chem.org ) driven by the MERRA meteorological fields (Rienecker et al., 2011 ), with 6-h temporal resolution (3-h for surface variables and mixing depths), 2° (latitude) × 2.5° (longitude) horizontal resolution, and 47 vertical layers from the surface to 0.01 hPa. The GEOS-Chem simulation of carbonaceous aerosols has been reported previously by Park et al. (2003) . Eighty percent of BC emitted from primary sources is assumed to be hydrophobic, and hydrophobic aerosols become hydrophilic with an e-folding time of 1.2 d (Cooke et al., 1999 ; Chin et al., 2002 ; Park et al., 2003 ). BC in the model is assumed to be externally mixed with other aerosol species. The schemes of tracer advection, convection, and dry and wet depositions are discussed in details in the study by Mao et al. (2016) .
The annual anthropogenic emissions of BC for 1980–2010 are from Bond et al. (2007) globally and updated in Asia (60°E−150°E, 10°S–55°N) with the Regional Emission inventory in Asia (REAS) (Ohara et al., 2007 , available at http://www.jamstec.go.jp/frsgc/research/d4/emission.htm ). Seasonal variations of anthropogenic emissions are considered in China and Indian using monthly scaling factors taken from Kurokawa et al. (2013) . Global biomass burning emissions of BC are taken from the Global Fire Emissions Database version 3 (GFEDv3) (van der Werf et al., 2010 ) with a monthly temporal resolution. More details about the configurations of BC emissions are discussed by Mao et al. (2016) .
2.2. Simulations
We conduct six simulations (Table 1 ) driven by MERRA for 1980–2010 to identify the relative roles of changes in meteorological parameters and emissions in the variations of BC in the Tibetan Plateau. All simulations are preceded by 1-year spin up. In the simulation VALL, meteorological parameters and anthropogenic and biomass burning emissions are allowed to vary year to year. In the simulation VMET (VEMIS), meteorological parameters (anthropogenic and biomass burning emissions) are allowed to vary over 1980–2010, but anthropogenic and biomass burning emissions (meteorological parameters) are fixed at year 2010 levels. To test the influence of emissions (meteorological fields) on decadal and interannual variations of BC in VMET (VEMIS), we conduct sensitivity simulations same as VMET (VEMIS) but with fixed anthropogenic and biomass burning emissions (meteorological parameters) at year 1980 values. We find that the resulting decadal and interannual variations of BC remain essentially the same as those in VMET (VEMIS). The model configurations of the simulation VEMISAN (VEMISBB) are the same as those in VEMIS, except that biomass burning emissions (anthropogenic emissions) are not included. The model configurations of VNOC are the same as those in VALL, except that anthropogenic and biomass burning emissions in China are set to zero.
| Model experiments | Meteorological parameters | Emissions | |
|---|---|---|---|
| Anthropogenic | Biomass burning | ||
| VALL | 1980–2010 | 1980–2010 | 1980–2010 |
| VMET | 1980–2010 | 2010 | 2010 |
| VEMIS | 2010 | 1980–2010 | 1980–2010 |
| VEMISAN | 2010 | 1980–2010 | Not included |
| VEMISBB | 2010 | Not included | 1980–2010 |
| VNOCa | 1980–2010 | 1980–2010 | 1980–2010 |
a. Anthropogenic and biomass burning emissions in China are set to zero in VNOC.
We would like to point out that simulated BC concentrations in the Tibetan Plateau are likely underestimated partially because of the deficiencies of the meteorological fields over the complex Tibetan terrain (He et al., 2014 ). In addition, the upslope flow in the region is difficult to represent in a coarse-resolution model like the GEOS-Chem model (Mao et al., 2011 ). We thus do not attempt to simulate the absolute BC concentrations in the Tibetan Plateau, focusing instead on the ability of GEOS-Chem to reasonably represent the decadal, interannual, and seasonal variations of BC. He et al. (2014) have systematically evaluated the BC simulations over the Tibetan Plateau by the GEOS-Chem model, using in situ measurements of BC in surface air, BC in snow, and BC absorption aerosol optical depth. They have shown the ability of the GEOS-Chem model to capture the spatial pattern and seasonal variations of observed BC in the region. Historical BC in ice cores (e.g., Ming et al., 2008 ; Xu et al., 2009 ) reconstructed in the region also provide an ideal mean to examine the long-term variation of BC back to the pre-industrial times. Mao et al. (2016) have shown that the GEOS-Chem model reasonably captures the decadal and interannual variations of BC using historical BC in ice cores in the Tibetan Plateau.
3. Results
3.1. Simulated BC concentrations
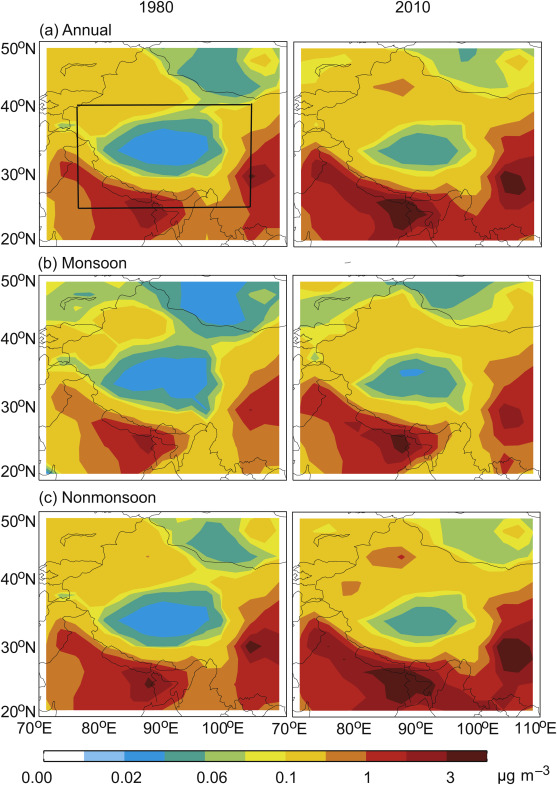
Fig. 1 shows the spatial distributions of simulated surface BC concentrations in the Tibetan Plateau in 1980 and 2010. Results are from simulation VALL for annual mean, monsoon season (June–September), and nonmonsoon season (October–May). Here the monsoon and nonmonsoon seasons are defined following the studies, e.g., Xu et al. (2009) and He et al. (2014) . Low surface BC concentrations (<0.1 μg m−3 ) are found in the central plateau with high altitude, while high BC concentrations (>1 μg m−3 ) are located in the south slope of the plateau with high emission sources. Relative to 1980, annual mean surface BC concentrations in 2010 increase by 0.15 μg m−3 (63%) averaged over the Tibetan Plateau (75–105°E, 25–40°N, indicated by the black rectangle in Fig. 1 ), consistent with the enhanced anthropogenic emissions in South Asia and East Asia. We find that surface BC concentrations are smaller in the monsoon season than in the nonmonsoon season by ∼30%, largely because of the strong precipitation in the monsoon season (Xu et al., 2009 ).
|
|
|
Fig. 1. Simulated surface BC concentrations (μg m−3 ) in the Tibetan Plateau (indicated by the black rectangle, 75–105°E, 25–40°N) for (a) annual mean, (b) monsoon seasons (June–September), and (c) nonmonsoon seasons (October–May) in 1980 and 2010. Results are from model simulation VALL. |
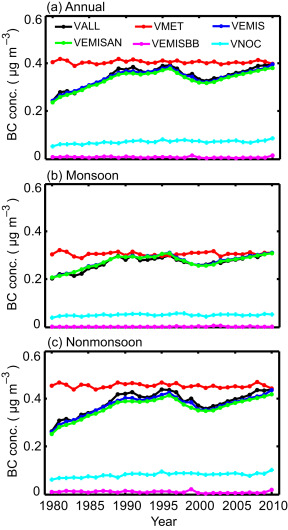
Fig. 2 shows simulated surface BC concentrations for 1980–2010 averaged over the Tibetan Plateau for annual mean, monsoon season, and nonmonsoon season. In the simulation VALL, model simulated annual mean surface BC concentrations are in the range of 0.24–0.4 μg m−3 averaged over the Tibetan Plateau for 1980–2010. The variations of surface BC concentrations are generally consistent with the changes of anthropogenic emissions used in the model. Surface BC concentrations are generally increasing from 1980 to 2010, except for 1990s. The variations of surface BC concentrations in 1990s are similar to the changes of anthropogenic emissions, which are nearly constant for 1990–1995 and even slightly decrease for 1996–2000.
|
|
|
Fig. 2. Simulated surface BC concentrations (μg m−3 ) averaged over the Tibetan Plateau for 1980–2010. |
We find that the simulated BC concentrations in VALL, VEMIS, and VEMISAN show similar variations because anthropogenic emissions are the major source of BC in the Tibetan Plateau, especially in the monsoon season. Also shown in Fig. 2 are simulated surface concentrations from model simulation VNOC. The percentage contributions of non-China emissions are averagely ∼20% to surface BC concentrations. The contributions of non-China emissions to BC increase by 0.032 μg m−3 (58%) in the past 30 years, largely because of the increasing emissions from India. We would like to point out that large biases exist in the variations of simulated BC because of the uncertainties in the REAS inventory as discussed by Mao et al. (2016) .
We calculate in the present study the decadal trends in simulated BC using the least square fit. The resulting decadal trends in annual mean surface BC concentrations are 0.013 μg m−3 per decade in the 1980s and 0.008 in the 2000s. The variations of BC in simulation VEMIS are similar to those in simulation VALL, indicated that changes in emissions are the major factor that contributes to the decadal trends of surface BC concentrations in the Tibetan Plateau. For simulation VMET, we find no obvious decadal trends in simulated BC.
3.2. Simulated interannual variations of BC
To analyze the interannual variations of BC, the decadal trends in the simulated BC are firstly identified by linear square fit based on the approach used in previous studies, e.g., Yang et al. (2015) and Mao et al. (2016) . We quantify the impact of changes in emissions and meteorological parameters on the interannual variations of surface BC concentrations by using the deviation from the mean (DM), mean absolute deviation (MAD), and absolute percent departure from the mean (APDM) (e.g., Mu and Liao, 2014 ; Yang et al., 2015 ; Mao et al., 2016 ). The three indexes are defined as,
|
|
( 1) |
|
|
( 2) |
|
|
( 3) |
where is the detrended simulated mean BC in China for year , and is the number of years examined (n = 31 for years 1980–2010). Therefore, MAD and APDM (or DM) represent the interannual variations of BC in terms of absolute value and percentage, respectively. We discuss the interannual variations of BC for annual mean, monsoon seasons, and nonmonsoon seasons.
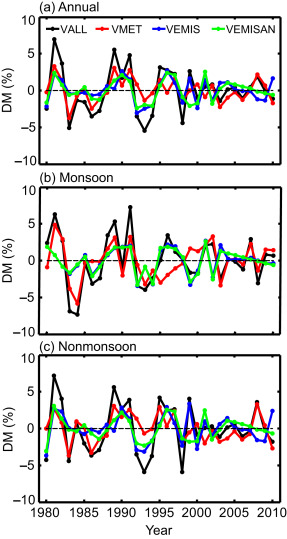
Fig. 3 shows the DM values of detrended simulated mean surface BC concentrations averaged over the Tibetan Plateau for 1980–2010. The DM values in annual mean surface BC concentrations are −5.4% to 7% in VALL, –3.7% to 3.3% in VMET, –3.1% to 2.7% in VEMIS, and −2.4% to 2.6% in VEMISAN. We find that the interannual variations of surface BC concentration are smaller in the 2000s than in the 1980s and 1990s, partially because of the more steady increase in anthropogenic emissions after 2000. The deviations of surface BC concentrations in simulation VMET are comparable to those in VEMIS and VEMISAN. The peaks and troughs in deviations in VALL simulation are consistent with those in either VMET or VEMIS, suggesting that the interannual variations of surface BC concentrations are dependent on changes in both meteorological parameters and emissions. The DM values of surface BC concentrations in VMET are larger for the monsoon season (−5.9% to 5.0%) than for the annual mean and the nonmonsoon season, indicating that meteorological parameters are a more important factor in driving the interannual variations of surface BC concentrations in the monsoon season. The interannual variations of BC due to changes of anthropogenic emissions alone (VEMISAN) is similar to those due to changes of both anthropogenic and biomass burning emissions (VEMIS) (except in 1999), because of the significant large anthropogenic emissions. The large biomass burning emissions in 1999 cause the significant difference in the DM values between VEMISAN and VEMIS.
|
|
|
Fig. 3. Deviation from the mean (DM, %) of the detrended simulated surface BC concentrations averaged over the Tibetan Plateau for 1980–2010. See text for the definition of DM. |
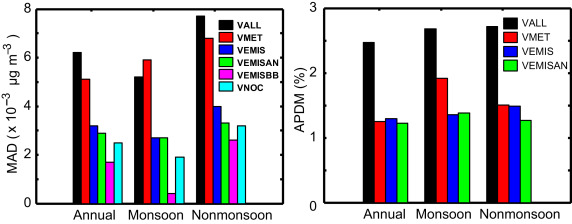
In Fig. 4 , we summarize the MAD and APDM values of the detrended mean surface BC concentrations averaged over the Tibetan Plateau for 1980–2010. The APDM values of surface concentrations of BC in simulation VALL are 2.50%, 2.68%, and 2.72% for annual mean, monsoon season, and nonmonsoon season, respectively. The corresponding MAD values are 0.0062, 0.0052, and 0.0077 μg m−3 , respectively. We find that the MAD and APDM values in VMET and VEMIS are generally comparable, indicating again that the interannual variations in surface BC concentrations are driven by variations in both meteorological parameters and emissions. In the monsoon season, meteorological parameters are more important in driving the interannual variations of BC, as both MAD and APDM values in VMET are significantly larger than those in VEMIS. Mu and Liao (2014) reported that the interannual variations of BC in China for 2004–2012 are largely dependent on variations in meteorological parameters. This discrepancy between Mu and Liao (2014) and this study is largely because of the different metrological fields and emission inventory used in estimating the interannual variations of BC.
|
|
|
Fig. 4. Mean absolute deviation (MAD, μg m−3 ) and absolute percent departure from the mean (APDM, %) of the detrended simulated surface BC concentrations in the Tibetan Plateau for 1980–2010. |
Following the process analyses, Mao et al. (2016) pointed out that wind is the major meteorological factor to influence the interannual variations of surface BC. The interannual variations of surface concentrations of BC due to biomass burning emissions are largest in the nonmonsoon season, as the APDM values of surface BC concentrations due to changes in anthropogenic alone (VEMISAN) is only 85% of those due to variations in both anthropogenic and biomass burning emissions (VEMIS). The influences of non-China emissions on BC are also largest in the nonmonsoon season.
3.3. Direct radiative forcing of BC
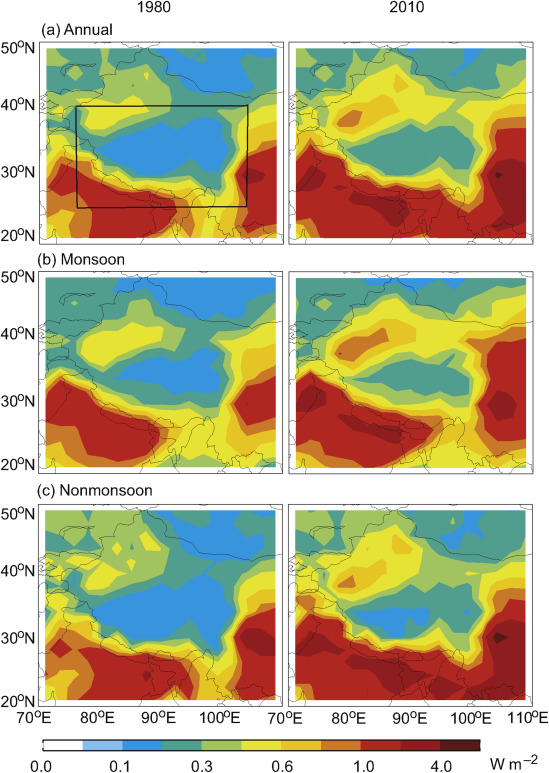
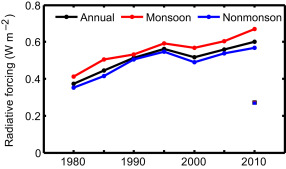
Fig. 5 compares the spatial distributions of simulated all-sky TOA DRF of atmospheric BC in China in 1980 and 2010, for annual mean and for monsoon and nonmonsoon seasons. The BC DRF is calculated using the Rapid Radiative Transfer Model for GCMs (RRTMG, Heald et al., 2014 ), which is discussed in details by Mao et al. (2016) . The spatial distributions of BC DRF are similar to those of surface BC concentrations (Fig. 1 ), which are small in the central plateau with low surface BC and high altitude, but high in the south slope of the plateau with strong emission sources. The annual mean BC DRF in the central plateau are larger than 0.1 W m−2 in 1980 and 0.2 W m−2 in 2010. We further show in Fig. 6 the simulated all-sky TOA DRF of BC averaged over the Tibetan Plateau in 1980, 1985, 1990, 1995, 2000, 2005, and 2010, for annual mean and for monsoon and nonmonsoon seasons. The variations of BC DRF are similar to the changes in surface BC concentrations (Fig. 2 ), with the maximal value in 2010 and minimal value in 1980. Annual mean BC DRF averaged over the Tibetan Plateau increases by 0.23 W m−2 (62%) from 1980 to 2010. The increases are significant comparing to the global annual mean BC DRF (0.4 W m−2 ) and tropospheric ozone (0.4 W m−2 ), as reported by IPCC (2013) . Also shown in Fig. 6 are the contributions of non-China emissions to the TOA DRF of BC in the Tibetan Plateau in 2010, which account for 45%, 40%, and 48% for the annual mean, monsoon season, and nonmonsoon season, respectively. We note that simulated DRF is associated with large uncertainties resulting from factors including BC mixing state, emissions, vertical distribution, wet scavenge scheme (lifetime), and mass absorption coefficient used in the model. In addition, the simulations of BC concentrations and thus DRF are likely underestimated because of the extremely complicated and high terrain in the Tibetan Plateau.
|
|
|
Fig. 5. Same as Fig. 1 , but for simulated all-sky direct radiative forcing (DRF) of BC (W m−2 ) at the top of the atmosphere (TOA). |
|
|
|
Fig. 6. Simulated all-sky TOA DRF of BC (W m−2 ) averaged over the Tibetan Plateau in 1980, 1985, 1990, 1995, 2000, 2005, and 2010. Also shown in squares are the contributions of non-China emissions to the TOA DRF of BC in the Tibetan Plateau in 2010. |
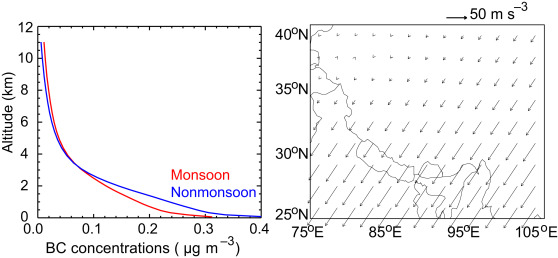
We also find in Fig. 5 ; Fig. 6 that the values of BC DRF in most regions of the Tibetan Plateau are larger in the monsoon seasons than in the nonmonsoon seasons by 5%–22% averagely, while the corresponding surface concentrations and column burdens of BC are lower. The discrepancy is partially because of the higher BC concentrations in the middle and upper troposphere in the monsoon season than in the nonmonsoon season (Fig. 7 ). Previous studies have shown that vertical distribution of BC is critical for the calculation of BC DRF (e.g., Bond et al., 2013 ; Li et al., 2016 ). The BC DRF enhances considerably when BC is located at high altitude largely because of the radiative interactions with clouds (Samset et al., 2013 ). In addition, the change of solar zenith angle with time is an important factor that causes the seasonal difference of BC DRF. The BC DRF increases linearly with the cosine of solar zenith angle (Zhang et al., 2008 ).
|
|
|
Fig. 7. Simulated vertical profiles of BC mass concentrations (μg m−3 ) averaged over the Tibetan Plateau for the monsoon and nonmonsoon seasons in 2010 (left). Differences in 300 hPa wind (vector, m s−1 ) between the monsoon and nonmonsoon seasons in 2010 (right). |
We also show in Fig. 7 the composite differences in 300 hPa wind between the monsoon and nonmonsoon seasons in 2010 from the MERRA data. The 300 hPa wind are likely associated with the westerlies in the upper troposphere (Liu et al., 2002 ). Relative to the nonmonsoon season, weaker southwest wind is found in the Tibetan Plateau in the monsoon season, which results in the anomalously northeast wind and the differences in transport of BC. For example, we summary in Table 2 the differences in simulated horizontal and vertical mass fluxes of BC in the Tibetan Plateau (75–105°E, 25–40°N, from 4 km to 8 km above the surface) between the monsoon and nonmonsoon seasons in 2010, based on simulation VALL. The monsoon season shows less inflow fluxes of BC by 0.03, 0.3, and 0.46 kg s−1 , respectively, at the south, west, and bottom boundaries, lower outflow by 1.73 kg s−1 at the east boundary, and larger outflow by 0.73 and 0.09 kg s−1 at the north and upper boundaries. The net effect is a larger inflow of BC by 0.12 kg s−1 in the monsoon season, which leads to the higher BC concentrations above 4 km. These results indicate that the differences in transport of BC due to the changes in atmospheric circulation are a dominant mechanism for the high BC concentrations in the middle and upper troposphere in the monsoon season.
| Boundary | Monsoon | Nonmonsoon | Difference | Net |
|---|---|---|---|---|
| South | +0.07 | +0.10 | −0.03 | Inflow 0.67 |
| North | +0.51 | −0.22 | +0.73 | |
| West | +0.70 | +1.00 | −0.30 | |
| East | +1.14 | +2.87 | −1.73 | |
| Upper | +0.11 | +0.02 | +0.09 | Outflow 0.55 |
| Bottom | +0.56 | +1.02 | −0.46 |
4. Summary and conclusions
We examined the impacts of variations in meteorological parameters and emissions on the decadal, interannual, and seasonal variations of surface BC concentrations in the Tibetan Plateau for 1980–2010 by sensitivity simulations using the GEOS-Chem model driven by the MERRA meteorological fields.
Model simulated annual mean surface BC concentrations were in the range of 0.24–0.4 μg m−3 averaged over the Tibetan Plateau for 1980–2010. Relative to 1980, annual mean surface BC concentrations in 2010 increased by 0.15 μg m−3 (63%). Because of the strong precipitation in the monsoon season, the surface BC concentrations were ∼30% smaller in the monsoon season than in the nonmonsoon season. From 1980 to 2010, simulated annual mean all-sky TOA DRF of BC increased by 0.23 W m−2 (62%) averaged over the Tibetan Plateau. The values of BC DRF were larger in the monsoon seasons than in the nonmonsoon seasons by 5%–22%, partially because of the higher BC concentrations in the middle and upper troposphere in the monsoon season and the change of solar zenith angle with time. In 2010, the non-China emissions accounted for 23% of simulated surface BC concentrations and 45% of BC DRF.
Simulated surface BC concentrations were generally increasing in the 1980s and 2000s, with decadal trends of 0.13 μg m−3 per decade in the 1980s and 0.08 in the 2000s. The decadal trends of BC were similar to the variations of emissions, indicating that changes in emissions were the major driver of the decadal trends of BC. The interannual variations of detrended annual mean surface BC concentrations averaged over the Tibetan Plateau were −5.4% to 7% for DM, 0.0062 μg m−3 for MAD, and 2.5% for APDM. We also found that the interannual variations of BC in the Tibetan Plateau were dependent on variations in both meteorological parameters and emissions. Meteorological parameters played a crucial role in the monsoon season. Anthropogenic emissions alone accounted for 94% of emissions-induced interannual variations of surface BC concentrations annually and 85% of those in the nonmonsoon season. The influences of biomass burning emissions and non-China emissions were relatively large in the nonmonsoon season.
BC deposited on snow and ice can significantly decrease the surface albedo. The induced snow albedo effect of BC has been an important driver of the retreat of the Tibetan glaciers in the past decades. Large uncertainties exist in the estimate of the snow albedo forcing over the Tibetan Plateau, because of the factors, e.g., the mixing states of BC-snow, the coating states of BC, snow grain shapes, etc., which call for systematical analysis in snow albedo forcing of BC in the Tibetan Plateau.
Acknowledgments
This work was supported by the National Basic Research Program of China (973 program, Grant 2014CB441202 ), the Strategic Priority Research Program of the Chinese Academy of Sciences Strategic Priority Research Program (Grant No. XDA05100503 ), the National Natural Science Foundation of China under grants 91544219 , 41475137 , and 41321064 . The GEOS-Chem model is managed by the Atmospheric Chemistry Modeling group at Harvard University with support from the NASA ACMAP program.
References
- Bey et al., 2001 I. Bey, D.J. Jacob, R.M. Yantosca, et al.; Global modeling of tropospheric chemistry with assimilated meteorology: model description and evaluation; J. Geophys. Res. Atmos., 106 (D19) (2001), pp. 23073–23095 http://dx.doi.org/10.1029/2001JD000807
- Bond et al., 2007 T.C. Bond, E. Bhardwaj, R. Dong, et al.; Historical emissions of black and organic carbon aerosol from energy-related combustion, 1850–2000; Glob. Biogeochem. Cycles, 21 (2007), p. GB2018
- Bond et al., 2013 T.C. Bond, S.J. Doherty, D.W. Fahey, et al.; Bounding the role of black carbon in the climate system: scientific assessment; J. Geophys. Res. Atmos., 118 (11) (2013), pp. 5380–5552 http://dx.doi.org/10.1002/jgrd.50171
- Chin et al., 2002 M. Chin, P. Ginoux, S. Kinne, et al.; Tropospheric aerosol optical thickness from the GOCART model and comparisons with satellite and sun photometer measurements; J. Atmos. Sci., 59 (2002), pp. 461–483
- Cooke et al., 1999 W.F. Cooke, C. Liousse, H. Cachier, et al.; Construction of a 1° × 1° fossil fuel emission data set for carbonaceous aerosol and implementation and radiative impact in the ECHAM4 model; J. Geophys. Res. Atmos., 104 (D18) (1999), pp. 22137–22162 http://dx.doi.org/10.1029/1999JD900187
- Flanner et al., 2007 M.G. Flanner, C.S. Zender, J.T. Randerson, et al.; Present-day climate forcing and response from black carbon in snow; J. Geophys. Res., 112 (2007), p. D11202 http://dx.doi.org/10.1029/2006JD008003
- Flanner et al., 2009 M.G. Flanner, C.S. Zender, P.G. Hess, et al.; Springtime warming and reduced snow cover from carbonaceous particles; Atmos. Chem. Phys., 9 (2009), pp. 2481–2497
- He et al., 2014 C. He, Q.B. Li, K.N. Liou, et al.; A global 3-D CTM evaluation of black carbon in the Tibetan Plateau; Atmos. Chem. Phys., 14 (13) (2014), pp. 7091–7112 http://dx.doi.org/10.5194/acp-14-7091-2014
- Heald et al., 2014 C.L. Heald, D.A. Ridley, J.H. Kroll, et al.; Contrasting the direct radiative effect and direct radiative forcing of aerosols; Atmos. Chem. Phys., 14 (11) (2014), pp. 5513–5527 http://dx.doi.org/10.5194/acp-14-5513-2014
- Horvath, 1993 H. Horvath; Atmospheric light absorption: a review; Atmos. Environ., 27 (1993), pp. 293–317
- Immerzeel et al., 2010 W.W. Immerzeel, L.P.H. van Beek, M.F.P. Bierkens; Climate change will affect the Asian water towers; Science, 328 (2010), pp. 1382–1385 http://dx.doi.org/10.1126/science.1183188
- IPCC, 2013 IPCC; T.F. Stocker, D. Qin, G.-K. Plattner (Eds.), et al. , Climate Change 2013: the Physical Science Basis. Contribution of Working Group I to the Fifth Assessment Report of the Intergovernmental Panel on Climate Change, Cambridge University Press, Cambridge and New York (2013), p. 1535
- Jacobson, 2004 M.Z. Jacobson; Climate response of fossil fuel and biofuel soot, accounting for soots feedback to snow and sea ice albedo and emissivity; J. Geophys. Res., 109 (2004), p. D21201 http://dx.doi.org/10.1029/2004JD004945
- Kopacz et al., 2011 M. Kopacz, D.L. Mauzerall, J. Wang, et al.; Origin and radiative forcing of black carbon transported to the Himalayas and Tibetan Plateau; Atmos. Chem. Phys., 11 (6) (2011), pp. 2837–2852 http://dx.doi.org/10.5194/acp-11-2837-2011
- Kurokawa et al., 2013 J. Kurokawa, T. Ohara, T. Morikawa, et al.; Emissions of air pollutants and greenhouse gases over Asian regions during 2000–2008: regional Emission inventory in ASia (REAS) version 2; Atmos. Chem. Phys., 13 (2013), pp. 11019–11058 http://dx.doi.org/10.5194/acp-13-11019-2013
- Lau and Kim, 2006 K.M. Lau, K.M. Kim; Observational relationships between aerosol and Asian monsoon rainfall, and circulation; Geophys. Res. Lett., 33 (2006), p. L21810 http://dx.doi.org/10.1029/2006gl027546
- Lau et al., 2010 K.M. Lau, M.K. Kim, K.M. Kim, et al.; Enhanced surface warming and accelerated snow melt in the Himalayas and Tibetan Plateau induced by absorbing aerosols; Environ. Res. Lett., 5 (2010), p. 025204 http://dx.doi.org/10.1088/1748-9326/5/2/025204
- Liu et al., 2002 X. Liu, G. Wu, Y. Liu; Diabatic heating over the Tibetan Plateau and the seasonal variations of the Asian circulation and summer monsoon onset; (in Chinese) Sci. Atmos. Sin., 26 (6) (2002), pp. 781–793
- Li et al., 2016 K. Li, H. Liao, Y.H. Mao, et al.; Sectoral and regional contributions to black carbon and its direct radiative forcing in China; Atmos. Environ., 124 (2016), pp. 351–366 http://dx.doi.org/10.1016/j.atmosenv.2015.06.014
- Lu et al., 2011 Z. Lu, Q. Zhang, D.G. Streets; Sulfur dioxide and primary carbonaceous aerosol emissions in China and India, 1996–2010; Atmos. Chem. Phys., 11 (18) (2011), pp. 9839–9864 http://dx.doi.org/10.5194/acp-11-9839-2011
- Lu et al., 2012 Z.F. Lu, D.G. Streets, Q. Zhang, et al.; A novel back trajectory analysis of the origin of black carbon transported to the Himalayas and Tibetan Plateau during 1996–2010; Geophys. Res. Lett., 39 (2012), p. L01809 http://dx.doi.org/10.1029/2011gl049903
- Mao et al., 2011 Y.H. Mao, Q.B. Li, L. Zhang, et al.; Biomass burning contribution to black carbon in the Western United States Mountain Ranges; Atmos. Chem. Phys., 11 (2011), pp. 11253–11266 http://dx.doi.org/10.5194/acp-11-11253-2011
- Mao et al., 2016 Y.H. Mao, H. Liao, Y. Han, et al.; Impacts of meteorological parameters and emissions on decadal and interannual variations of black carbon in China for 1980–2010; J. Geophys. Res. Atmos., 121 (2016), pp. 1822–1843 http://dx.doi.org/10.1002/2015JD024019
- Menon et al., 2010 S. Menon, D. Koch, G. Beig, et al.; Black carbon aerosols and the third polar ice cap; Atmos. Chem. Phys., 10 (2010), pp. 4559–4571 http://dx.doi.org/10.5194/acp-10-4559-2010
- Ming et al., 2008 J. Ming, H. Cachier, C. Xiao, et al.; Black carbon record based on a shallow Himalayan ice core and its climatic implications; Atmos. Chem. Phys., 8 (2008), pp. 1343–1352 http://dx.doi.org/10.5194/acp-8-1343-2008
- Mu and Liao, 2014 Q. Mu, H. Liao; Simulation of the interannual variations of aerosols in China: role of variations in meteorological parameters; Atmos. Chem. Phys., 14 (2014), pp. 9597–9612 http://dx.doi.org/10.5194/acp-14-9597-2014
- Ohara et al., 2007 T. Ohara, H. Akimoto, J. Kurokawa, et al.; An Asian emission inventory of anthropogenic emission sources for the period 1980–2020; Atmos. Chem. Phys., 7 (2007), pp. 4419–4444
- Park et al., 2003 R.J. Park, D.J. Jacob, M. Chin, et al.; Sources of carbonaceous aerosols over the United States and implications for natural visibility; J. Geophys. Res. Atmos., 108 (D12) (2003), p. 4355 http://dx.doi.org/10.1029/2002JD003190
- Prasad et al., 2009 A.K. Prasad, K.H.S. Yang, H.M. El-Askary, et al.; Melting of major Glaciers in the western Himalayas: evidence of climatic changes from long term MSU derived tropospheric temperature trend (1979–2008); Ann. Geophys.-Germany, 27 (2009), pp. 4505–4519
- Qian et al., 2009 Y. Qian, W.I. Gustafson Jr., L.R. Leung, et al.; Effects of soot-induced snow albedo change on snowpack and hydrological cycle in western United States based on Weather Research and Forecasting chemistry and regional climate simulations; J. Geophys. Res., 114 (2009), p. D03108 http://dx.doi.org/10.1029/2008JD011039
- Qian et al., 2011 Y. Qian, M.G. Flanner, L.R. Leung, et al.; Sensitivity studies on the impacts of Tibetan Plateau snowpack pollution on the Asian hydrological cycle and monsoon climate; Atmos. Chem. Phys., 11 (2011), pp. 1929–1948 http://dx.doi.org/10.5194/acp-11-1929-2011
- Qin et al., 2006 D.H. Qin, S.Y. Liu, P.J. Li; Snow cover distribution, variability, and response to climate change in western China; J. Clim., 19 (2006), pp. 1820–1833
- Ramanathan and Carmichael, 2008 V. Ramanathan, G. Carmichael; Global and regional climate changes due to black carbon; Nat. Geosci., 1 (4) (2008), pp. 221–227 http://dx.doi.org/10.1038/ngeo156
- Ramanathan et al., 2005 V. Ramanathan, C. Chung, D. Kim, et al.; Atmospheric brown clouds: impacts on South Asian climate and hydrological cycle; Proc. Natl. Acad. Sci. U. S. A., 102 (2005), pp. 5326–5333 http://dx.doi.org/10.1073/pnas.0500656102
- Ramanathan et al., 2007 V. Ramanathan, M.V. Ramana, G. Roberts, et al.; Warming trends in Asia amplified by brown cloud solar absorption; Nature, 448 (2007), pp. 575–578 http://dx.doi.org/10.1038/Nature06019
- Rienecker et al., 2011 M.M. Rienecker, M.J. Suarez, R. Gelaro, et al.; MERRA: NASAs Modern-Era Retrospective Analysis for Research and Applications; J. Clim., 24 (2011), pp. 3624–3648 http://dx.doi.org/10.1175/JCLI-D-11-00015.1
- Samset et al., 2013 B.H. Samset, G. Myhre, M. Schulz, et al.; Black carbon vertical profiles strongly affect its radiative forcing uncertainty; Atmos. Chem. Phys., 13 (5) (2013), pp. 2423–2434 http://dx.doi.org/10.5194/acp-13-2423-2013
- van der Werf et al., 2010 G.R. van der Werf, J.T. Randerson, L. Giglio, et al.; Global fire emissions and the contribution of deforestation, savanna, forest, agricultural, and peat fires (1997–2009); Atmos. Chem. Phys., 10 (23) (2010), pp. 11707–11735 http://dx.doi.org/10.5194/acp-10-11707-2010
- Wang et al., 2015 M. Wang, B. Xu, J. Cao, et al.; Carbonaceous aerosols recorded in a Southeastern Tibetan glacier: variations, sources and radiative forcing; Atmos. Chem. Phys., 15 (2015), pp. 1191–1204 http://dx.doi.org/10.5194/acp-15-1191-2015
- Warren and Wiscombe, 1980 S.G. Warren, W.J. Wiscombe; A model for the spectral albedo of snow. II: snow containing atmospheric aerosols; J. Atmos. Sci., 37 (1980), pp. 2734–2745
- Xu et al., 2009 B. Xu, J. Cao, J. Hansen, et al.; Black soot and the survival of Tibetan glaciers; Proc. Natl. Acad. Sci., 106 (52) (2009), pp. 22114–22118
- Yang et al., 2015 Y. Yang, H. Liao, S. Lou; Decadal trend and interannual variation of outflow of aerosols from East Asia: roles of variations in meteorological parameters and emissions; Atmos. Environ., 100 (2015), pp. 141–153
- Yasunari et al., 2010 T.J. Yasunari, P. Bonasoni, P. Laj, et al.; Estimated impact of black carbon deposition during premonsoon season from Nepal Climate Observatory – pyramid data and snow albedo changes over Himalayan glaciers; Atmos. Chem. Phys., 10 (2010), pp. 6603–6615 http://dx.doi.org/10.5194/acp-10-6603-2010
- Zhang et al., 2008 H. Zhang, J.H. Ma, Y.F. Zheng; The study of global radiative forcing due to black carbon aerosol; (in Chinese) Chin. J. Atmos. Sci., 32 (5) (2008), pp. 1147–1158
- Zwally et al., 2002 H.J. Zwally, W. Abdalati, T. Herring, et al.; Surface melt-induced acceleration of Greenland ice-sheet flow; Science, 297 (2002), pp. 218–222
Document information
Published on 15/05/17
Submitted on 15/05/17
Licence: Other
Share this document
claim authorship
Are you one of the authors of this document?
