Abstract
Based on the number of snow cover days (NSCDs) and homogenized surface air temperature data for the period 1951–2004, this study performs the quantitative analysis on the sensitivity of NSCDs to surface air temperature over the Qinghai-Tibetan Plateau (QTP). Results show that both the extreme sensitivity and sensitivity under current climate are higher in the edge than in the central area of the QTP. There exists a strong negative correlation between station’s elevation and critical temperature, at which the sensitivity reaches extremum. The negative correlation between the elevation and the extreme sensitivity is not as strong as the former one. Currently, the climatological temperatures in quite a few stations do not reach the critical stage. The sensitivity at these stations will become greater under the current background of climate warming, which means NSCDs will be more sensitive to surface air temperature.
Keywords
snow cover ; sensitivity ; Qinghai-Tibetan Plateau ; surface air temperature
1. Introduction
Snow cover is one of the main components of the cryosphere. It is crucial in the surface energy balance due to its intrinsic attributes of high albedo, high potential heat relative to phase changing, and low heat conduction, and hence has important impacts on the changes of climate system. The Qinghai-Tibetan Plateau (QTP) is a region with the highest landform and the widest snow cover in the midlatitude of the Northern Hemisphere. The snow cover over the QTP not only is closely linked to the living conditions of local people, but also affects the climate in local and surrounding regions through transformation of energy and water. Snow cover, on one hand, is one of the outcomes of atmospheric circulation, and on the other hand, affects climate change. Under the background of climate warming, the number of snow cover days (NSCDs), snow depth, and snow cover extent are experiencing great changes. In accordance with global warming, surface air temperature over the QTP has been increasing since 1950s [ Liu and Chen, 2000 ]. At the same time, snow cover over the QTP has increased till the end of the 1990s, and has presented more significant increasing trend and greater interannual variability since the mid-1980s [ Ding, 2002 ; Qin et al ., 2006 ], which is possibly related to the changes of water vapor content in the atmosphere caused by climate warming. However, snow depth over the QTP decreased obviously since then, at least till the year 2005 [ Ma, 2008 ].
With lower air density, larger snow-covered area, and more stable stratification in the near surface layer, the temperature over the QTP behaves quicker and stronger response to climate warming due to higher elevation, more complicated landform, stronger monsoon circulation, and more incident solar radiation [ Sun , 1996 ]. Increase in surface air temperature is unfavorable for maintaining snow cover, it is therefore crucial to analyze the sensitivity of snow cover to surface air temperature. Hantel et al. [2000] proposed a method to analyse the sensitivity of NSCDs to surface air temperature, which was successfully applied to the Austrian Alps and the Swiss Alps.
Most of the previous researches on the relationship between snow cover and air temperature were based on the linear correlation. However, NSCDs in one month is at most the same as the number of total days in the month, and won’t increase unlimitedly even with extreme low temperature. To quantify the non-linear relationship between them, the sensitivity of NSCDs to surface air temperature is investigated in this study based on the method of Hantel et al. [2000] .
2. Data sources
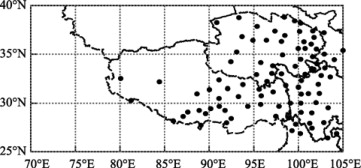
Compared with the remote sensing and reanalysis data, the first-hand observational data from monitoring stations are usually considered to be more accurate and are able to reflect the actual situation, especially in mountain regions with complicated landform like the QTP [ Ma et al. , 2008 ; 2009 ]. Therefore, the monthly NSCDs and monthly mean surface air temperature data used in this study are both ground-based observational data obtained from the National Meteorological Information Center, China Meteorological Administration. The former is available for 754 Chinese meteorological stations covering the period from the beginning of records (approximately January 1951) until December 2008. The latter is the China Homogenized Historical Temperature Data set (1951–2004), version 1.0 [ Li et al., 2004 ], being available for 731 stations with the same beginning date as the former but going until December 2004. Within the scope of the QTP (25°–40°N, 73°–105°E, a.s.l. 2,000 m), there are 92 stations with both NSCDs and surface air temperature data, as shown in Figure 1 .
|
|
|
Figure 1. Distribution of 92 meteorological stations with both monthly NSCDs and homogenized surface air temperature data over the QTP |
Limited to the available period of homogenized surface air temperature data set, the study period is 1951–2004, and 1971–2000 is taken as the climatological period. According to the seasonal characteristics of snow cover changes, last September till current August is taken as a whole snow year. Each snow year begins with autumn and ends with summer. For example, we take the months of September, October, and November in the calendar year 1999 as the autumn of the snow year 2000, and take December in the calendar year 1999, January and February in the calendar year 2000 as the winter of the snow year 2000, and so forth. Strict screening is performed on both data sets for the 92 stations before analyzing the sensitivity. First, seasonal and annual NSCDs and mean surface air temperature are calculated, and when there is missing value in any months of a season or year, it is marked as missing value. Spatial mean is marked as missing when missing occurs in more than half of the stations. Based on this, stations with missing values in more than 10 years during 1971–2000 are excluded, and the numbers are 9, 7, 13, and 9 for autumn, winter, spring, and summer, respectively. Additionally, the stations with non-negative correlation between NSCDs and surface air temperature in the four seasons are also discarded [ Hantel et al., 2000 ], and they all overlap the former with the number of 2, 2, 7, and 4, respectively. As a result, the valid stations are 83, 85, 79, and 83 for autumn, winter, spring, and summer, respectively. Note that the stations are mainly located in the mid-eastern part of the QTP, and hence, this research actually reflects the situation in the middle and eastern regions.
3. Methodology
To analyze the relationship between NSCDs and air temperature quantitatively, Hantel et al. [2000] defined a variable of relative NSCDs.
|
|
( 1) |
Hereinto, N and N0 are the number of days with snow cover and the number of total days in a month, respectively. For each station, the relationship between n and T (surface air temperature) is never linear. No matter how high or low the temperature is, the relative NSCDs can only be approaching or equal to but not exceed 0 and 1, meeting a hyperbolic tangent function. The sensitivity of relative NSCDs to surface air temperature (hereafter sensitivity) can be defined as the slope of n denoting the changes of T with n . The sensitivity, s, expressed by the following formula, will be always negative ranging from −1 to 0 due to the negative correlation between NSCDs and surface air temperature.
|
|
( 2) |
Hereinto, n and T are known, and s0 and T0 are the parameters to be fitted. so represents extreme sensitivity, that is, the top sensitivity of NSCDs to surface air temperature. T0 represents critical temperature when sensitivity reaches extremum, which means s is equal to so when T is equal to T0 . s0 and T0 will get their best fitting when the sum of variances of biases between the observed ni ,Ti and calculated ni , Ti is the least. That is, the bias estimation JE is the least. This fitting method [ Hantel et al ., 2000 ; Wielke et al ., 2004 ] takes both errors of the relative NSCDs and surface air temperature into account.
|
|
( 3) |
Hereinto, and denote errors from the relative NSCDs and surface air temperature, respectively. The weighting coefficients of errors, σi and xi , present the weighting of errors from the relative NSCDs and air temperature, respectively.
Take spring for example, the following steps illuminate the process of sensitivity calculation for each station.
1) Take the lowest temperature in spring of the period 1951–2004 as the initial value of T0 , and mark it as T00 .
2) Take Ti and ni in spring into formula (2) , and get s0i (i denotes year). Take the mean value of s0i as s0 .
3) Calculate Ti via formula (2) . Here T0 , s0 , and ni are known.
4) Similar with step 3), T0 , s0 , and Ti are known, and ni can be calculated via formula (2) .
5) Calculate the error estimation JE via formula (3) .
6) Take 0.001 °C as the step length of temperature, and repeat steps 2)–5) and get s0 and JE for each T0 .
7) In all groups of T0 and S0 , the one that makes JE the least is just the pair of T0 and s0 we are searching for.
8) Take T0 , s0 , and the climatological temperature into formula (2) , the climatological sensitivity , can be calculated.
4. Results
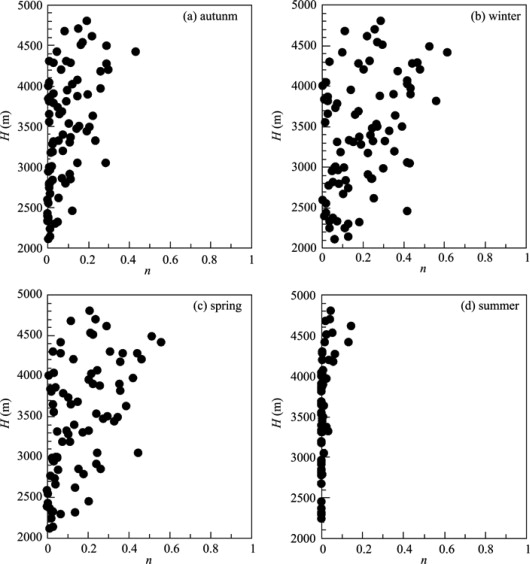
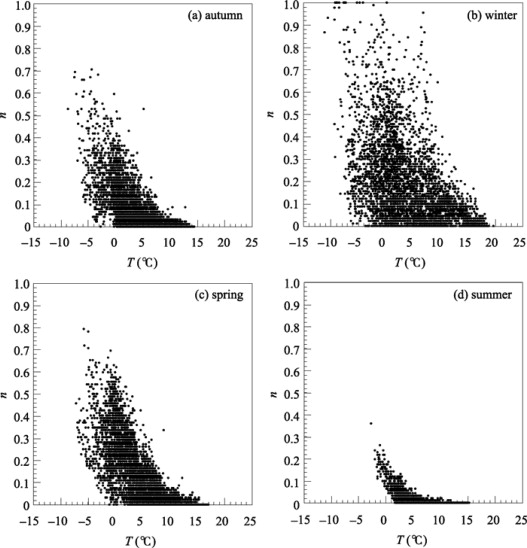
As it is well known, the relative NSCDs is related to station elevation, surface air temperature, snow amount, radiation, land cover, etc. To investigate its sensitivity to surface air temperature, the relationship between seasonal n and elevation (H ) during the period 1971–2000 is examined first due to the close relationship between surface air temperature and elevation. As shown in Figure 2 , n ranges from 0 to 1, and approaches or equals 0 in lower altitude. However, the pattern of hyperbolic tangent function is not as clear as that in Austria [ Hantel et al., 2000 ], possibly due to higher altitude and lower latitude of the QTP. There are obvious discrepancies for the changes of n with T in each season, especially in winter and summer. In summer ( Fig. 2 d), n hardly changes with H for stations with elevation lower than 4,000 m. In winter ( Fig. 2 b), n increases with H , but is relatively loose. This discloses that the relative NSCDs over the QTP does not only depend on altitude. Seasonal relationship between n and climatological temperature ( ) during the period 1971–2000 is further examined. Results show that there are closer relationships between n and than between n and H in all seasons. The hyperbolic tangent pattern is clearer in winter than in summer. Figure 3 shows the changes of n with T for all stations in the whole examined period. The hyperbolic tangent relationship is distinct.
|
|
|
Figure 2. Relationships between the relative NSCDs (n ) and station elevation (H ) over the QTP in (a) autumn, (b) winter, (c) spring, and (d) summer during the period 1971–2000 (each dot represents a value at one station) |
|
|
|
Figure 3. Relationships between the relative NSCDs (n ) and surface air temperature (T ) over the QTP in (a) autumn, (b) winter, (c) spring, and (d) summer during the period 1951–2004 (each dot represents a value at one station in one year) |
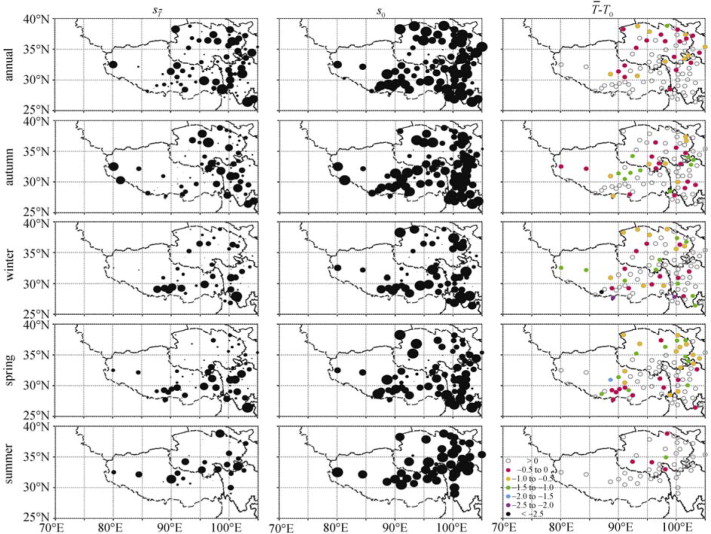
The extreme and climatological sensitivities (s0 and respectively) are shown in Figure 4 . Generally, both s0 and exhibit similar spatial distribution, lower in the middle-center (the intersection of Sichuan, Qinghai, and Tibet) while higher in the surroundings. This is similar to the spatial distribution of NSCDs [ Ma , 2008 ]. In summer, the sensitivity is unmeasurable in the southern part of the QTP because NSCDs in most of the stations is zero. For all seasons, the spatial distributions of s0 and are similar. But the magnitude of s0 is greater than that of . Statistical analyses reveal that is greater than s0 for all stations, thus the absolute value of is less than that of s0 due to their negative values. When is less than T0 , the sensitivity does not reach the extremum (i.e., ). NSCDs will be more sensitive to surface air temperature with climate warming. Conversely, when is greater than T0 , the sensitivity drops off from the top sensitivity (i.e., ). However, we should pay much attention to stations with below T0 because they will be more sensitive to air temperatures in the context of climate warming.
|
|
|
Figure 4. Annual and seasonal sensitivities ( , left panels) under the period 1971–2000 climatological temperature , extreme sensitivity (s0 , central panels, bigger circles represent higher sensitivity), and differences (right panels) between and critical temperature T0 over the QTP |
The difference between and T0 is shown in the right panel of Figure 4 . Annually, surface air temperatures in 27 of 86 stations (31%), do not reach critical state, and the proportions are 36% (30/83), 39% (33/85), 47% (37/79), and 11% (5/44) in autumn, winter, spring, and summer, respectively. Obviously, the proportion of stations with equal to or above T0 is greater in summer than in other seasons. Annually, surface air temperatures in 17 of 27 stations will reach their critical states for 0.5 °C warming. Correspondingly, the sensitivities will reach their extrema. When the warming reaches 0.5–1.0 °C, NSCDs in other 9 stations will reach their extreme sensitivities. Seasonally, 0.5 °C warming in autumn, winter, spring, and summer, respectively, will result in NSCDs in 14 of 30, 11 of 33, 12 of 37, and 4 of 5 stations the most sensitive to surface air temperature, and 0.5–1.0 °C warming will make other 7, 9, and 13 stations in autumn, winter, and spring, respectively, reaching their top sensitivities. Another 0.5 °C warming will lead to NSCDs in the left 9, 10, 10, and 1 station in the four seasons to extreme sensitivities. In other words, with a 1.5 °C warming over the QTP in the future, of all stations with below T0 , 91% in winter, 95% in spring, and 100% in autumn and summer will reach their critical temperature gradually, and NSCDs will be more or most sensitive to surface air temperature correspondingly.
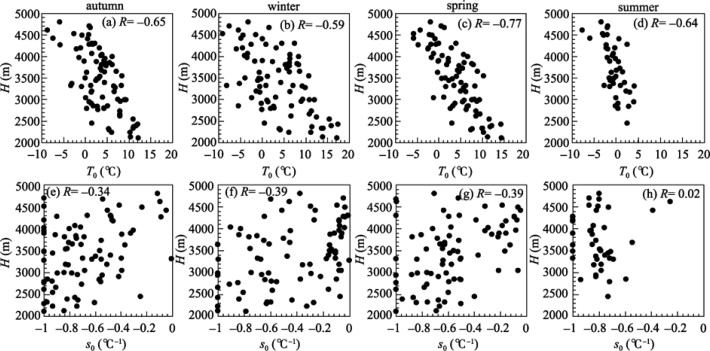
As mentioned above, extreme sensitivity for each station is not equal to each other (Fig. 4 ). In order to examine whether this is to some degree related to altitude discrepancy, the relationships between T0 , s0 and H are validated ( Fig. 5 ). The negative correlation between T0 and H is significant at 95% confidence level, and the correlation coefficients in autumn, winter, spring, and summer are −0.65, −0.59, −0.77, and −0.64, respectively. This indicates that the higher the elevation is, the lower critical temperature is needed for NSCDs to be more sensitive. The negative relationship between s0 and H is not as significant as that between T0 and H . Even for stations at the same altitude, s0 may range from −1 to 0 indicating less dependency on elevation over the QTP.
|
|
|
Figure 5. Relationships between elevation H and critical temperature T0 (upper panels), and H and extreme sensitivity s0 (lower panels) for all stations over the QTP during the period 1951–2004 (each dot represents a value at one station) |
5. Discussion and conclusions
Based on NSCDs and homogenized surface air temperature data from meteorological stations over the QTP during the period 1951–2004, this study quantificationally analyzes the sensitivity of NSCDs to surface air temperature.
Results indicate that NSCDs over the QTP will be more sensitive to surface air temperature in the context of climate warming. Currently, the climatological temperatures at quite a few stations do not reach their critical temperatures yet. However, with a 1.5 °C warming in the future, more than 90% of these stations will reach their extreme sensitivities. With an increase in temperature, the progression of snow melting in spring will be accelerated due to greater sensitivities. Meanwhile, there are also many stations with climatological temperatures exceeding critical ones, and the absolute value of is less than that of s0 .
Additionally, the relative NSCDs is closely related to surface air temperature, but not closely to elevation. Similarly, the extreme sensitivity is not closely related to elevation. Analyses indicate that there are a significant negative correlation between T0 and H , but the negative correlation between s0 and H is not as close as the former. That is to say, the higher the elevation, the lower T0 is necessary for the relative NSCDs to reach extreme sensitivity, but higher elevation is not necessary for station to be of greater extreme sensitivity.
Acknowledgements
This study was partly supported by the National Postdoctoral Scientific Foundation (20080440342) and the opening fund from the State Key Laboratory of Cryospheric Sciences, Cold and Arid Regions Environmental and Engineering Research Institute, Chinese Academy of Sciences (SKLCS 08-07).
References
- Ding, 2002 Y. Ding; Forecast in Environment Changes in Western China; D. Qin (Ed.), Assessment of Environment Evolution in Western China (in Chinese), Science Press (2002), p. 239
- Hantel et al., 2000 M. Hantel, M. Ehrendorfer, A. Haslinger; Climate sensitivity of snow cover duration in Austria; International Journal of Climatology, 20 (6) (2000), pp. 615–640
- Li et al., 2004 Q. Li, X. Liu, H. Zhang, et al.; Detecting and adjusting temporal inhomogeneity in Chinese mean surface air temperature data; Adv. Atmos. Sci., 21 (2004), pp. 260–268
- Liu and Chen, 2000 X. Liu, B. Chen; Climatic warming in the Tibetan Plateau during recent decades; International Journal of Climatology, 20 (14) (2000), pp. 1729–1742
- Ma, 2008 L. Ma; The Temporal and Spatial Characteristics of Snow Depth over the Qinghai-Tibetan Plateau in the Recent 50 Years and its Relationship with Factors of Atmospheric Circulation (in Chinese), Chinese Academy of Meteorological Sciences/Graduate University of Chinese Academy of Sciences (2008), p. 156
- Ma et al., 2008 L. Ma, T. Zhang, Q. Li, et al.; Evaluation of ERA-40, NCEP-1, NCEP-2 reanalysis air temperature with ground-based measurements in China; J. Geophys. Res., 113 (D15115) (2008) http://dx.doi.org/10.1029/2007JD009549
- Ma et al., 2009 L. Ma, T. Zhang, W.O. Frauenfeld, et al.; Evaluation of precipitation from the ERA-40, NCEP-1, and NCEP-2 Reanalyses and CMAP-1, CMAP-2, and GPCP-2 with ground-based measurements in China; J. Geophys. Res., 114 (D09105) (2009) http://dx.doi.org/10.1029/2008JD011178
- Qin et al., 2006 D. Qin, S. Liu, P. Li; Snow cover distribution, variability and response to climate change in western China; J. Climate, 19 (2006), pp. 1820–1833
- Sun, 1996 H. Sun; Formation and Evolution of Qinghai-Xizang Plateau (in Chinese), Scientific and Technical Publishers (1996), p. 383
- Wielke et al., 2004 L.M. Wielke, L. Haimberger, M. Hantel; Snow cover duration in Switzerland compared to Austria; Meteorologische Zeitschrift, 13 (1) (2004), pp. 13–17
Document information
Published on 15/05/17
Submitted on 15/05/17
Licence: Other
Share this document
Keywords
claim authorship
Are you one of the authors of this document?
