Abstract
The treatment of domestic and industrial wastewater is one of the major sources of CH4 in the Chinese waste sector. On the basis of statistical data and country-specific emission factors, using IPCC methodology, the characteristics of CH4 emissions from wastewater treatment in China were analyzed. The driving factors of CH4 emissions were studied, and the emission trend and reduction potential were predicted and analyzed according to the current situation. Results show that in 2010, CH4 emissions from the treatment of domestic and industrial wastewater were 0.6110 Mt and 1.6237 Mt, respectively. Eight major industries account for more than 92% of emissions, and CH4 emissions gradually increased from 2005 to 2010. From the controlling management scenario, we predict that in 2020, CH4 emissions from the treatment of domestic and industrial wastewater will be 1.0136 Mt and 2.3393 Mt, respectively, and the reduction potential will be 0.0763 Mt and 0.2599 Mt, respectively. From 2010 to 2020, CH4 emissions from the treatment of domestic and industrial wastewater will increase by 66% and 44%, respectively.
Keywords
Domestic and industrial wastewater; CH4 emissions; Reduction scenario; Emission reduction potential
1. Introduction
According to the IPCC Fifth Assessment Report (AR5), since pre-industrial times, the atmospheric concentrations of CO2, CH4, and N2O have increased by 40%, 150%, and 20%, respectively. It is a fact that the concentration of various greenhouse gases (GHGs) has increased significantly. CO2 emission due to human activity is a major factor for climate change, but the contribution of other GHGs is also evident and is increasingly attracting attention of scientists and policymakers. In 2011, the concentration of CH4 in the atmosphere was 1803 × 10−9. Anthropogenic emissions accounted for 50%–65% of the total CH4 emissions (IPCC, 2013 and IPCC, 2014).
Wastewater treated under anaerobic conditions may emit CH4 and is recognized as an emission source. Organic matter in wastewater produces abundant CH4 if it degrades anaerobically. CH4 is mainly generated via two steps: 1) Anaerobic conditions are formed in some treatment flows (e.g. the dephosphorization and enitrification process). Organics in wastewater are decomposed by anaerobic bacteria, and CH4 is generated and discharged to the atmosphere. 2) Some flows discharge dissolves CH4 from wastewater into the atmosphere via surface air exposure. Existing research indicates that CH4 generation mainly depends on the amount of degradable organics in wastewater, temperature, and type of wastewater treatment system. When the temperature is below 15 °C, significant CH4 production is unlikely because methanogens are not active. As the temperature rises, the generation rate of CH4 increases (Wang et al., 2011).
Many studies, from monitoring to estimating, have been conducted into CH4 emissions from wastewater treatment. CH4 emissions were measured at a small-scale wastewater treatment plant in the U.S., and the CH4 discharge factor was calculated (Czepiel et al., 1993). The CH4 generation mechanism of the water discharge system was studied, and the results showed that the drainage system generated abundant CH4 depending on the residence time of wastewater in the system (Guisasola et al., 2008). According to further research by Doorn et al. (1997), CH4 was generated by the water drainage system, and it was believed that an enclosed sewer would not generate CH4. If the water inside an open sewer remains static, the water temperature may increase under sunlight, and the sewer might generate CH4. Various studies (Oriol et al., 2009, Jeong et al., 2009, Zhang et al., 2009, Zu et al., 2008, van Bodegom et al., 2004 and Wang et al., 2011) investigated the influence of wastewater residence time on pH, nutrient substance, antimicrobial activity, and suppression of CH4 generation and proposed control measures for CH4 generation in urban wastewater drainage systems. These studies laid the foundation for CH4 estimation from drainage wastewater treatment. On the basis of these results, the IPCC published a series of guidelines to provide a methodology for estimating and reporting the national GHG inventory.
In recent years, research on GHG emissions from the treatment of domestic wastewater is relatively abundant in China. Many researchers (Guo et al., 2011, Cai et al., 2015, Zhou et al., 2012, Guo et al., 2012 and Hu et al., 2014) investigated GHG emissions from different areas or under different treatment processes. A few researchers focused on the general conditions of domestic and industrial wastewater treatment, especially the work and achievements obtained using the IPCC method. In this study, CH4 emissions from the treatment of domestic and industrial wastewater in China are estimated, and the future emission-reduction potential is predicted on the basis of the emission characteristics of wastewater.
2. Methodology and data
2.1. Calculation of CH4 emissions from wastewater treatment
The methodology used to estimate CH4 emissions was obtained from the IPCC Revised Guidelines for National Greenhouse Gases Inventory (hereafter referred to as IPCC, 1996) (IPCC, 1996) and the IPCC Good Practice Guidance and Uncertainty Management in National Greenhouse Gas Inventories (hereafter referred to as IPCC GPG) (IPCC, 2000). The 2006 IPCC Guidelines for National Greenhouse Gases Inventory is cited as a reference during the calculation (IPCC, 2006).
2.1.1. CH4 emissions from domestic wastewater treatment
Total CH4 emissions from domestic wastewater are calculated as follows:
|
|
(1) |
Where ED indicates the total CH4 emissions from domestic wastewater in the calculation year (Gg CH4) and TDi indicates the organic content in domestic wastewater for the calculation year (kg BOD). The biochemical oxygen demand (BOD) is used to represent the organic content of domestic wastewater and is the biologically degradable organic content under an oxygenated environment (IPCC, 2000). EF indicates the emission factor (kg CH4 (kg BOD)−1). i indicates the wastewater treatment plant or natural water body. R indicates the amount of recycled CH4 in the calculation year (kg CH4).
|
|
(2) |
Where Bo indicates the maximum CH4 generation capacity. The IPCC default value is 0.6 kg CH4 (kg BOD)−1 or 0.25 kg CH4 (kg COD)−1(chemical oxygen demand (COD) indicates the organic content in industrial wastewater and is the measure of the oxygen equivalent of the organic matter content that is susceptible to oxidation by a strong chemical oxidant (IPCC, 2000)). M indicates the CH4 correction factor (M = 0.165 for domestic wastewater and M = 0.4674 for industrial wastewater).
2.1.2. CH4 emissions from industrial wastewater treatment
CH4 emissions from industrial wastewater treatment are calculated as follows:
|
|
(3) |
where EI indicates CH4 emissions from industrial wastewater treatment in the calculation year (kg CH4). TIi is the total degradable organic material in the wastewater of the industry i in the calculation year (kg COD); i indicates industries; Si indicates the organic content removed by the sludge in the calculation year (kg COD). Ri indicates CH4 emissions recycled by different industries in the calculation year (kg CH4).
The treated industrial wastewater may be discharged if the waste meets the national drainage standards. Some of the treated wastewater will be drained into the domestic wastewater pipeline system and will be further treated in a domestic wastewater treatment plant; some will be directly discharged into the natural water environment, such as rivers, lakes, oceans, and wetland systems. To avoid double counting when estimating CH4 emissions from industrial wastewater treatment, only CH4 that was removed and directly discharged into the natural water environment is included. CH4 generated from COD-treated flow in the domestic wastewater system is reported in a domestic wastewater subcategory (IPCC, 2000).
2.2. Scenario analysis method
CH4 emissions from future wastewater treatment are predicted, according to the calculation model derived from the correlation analysis of different driving factors of the activity data. Based on the conditions in China and the future economic development level, a model is used to calculate the growth trend of the activity data. The 2010 emission factor is used as a baseline to predict wastewater treatment scenarios of the future.
The mitigation potential scenario represents the largest possible abatement of future domestic and industrial wastewater, which is calculated based on present technology and future development paths. Making the assumption that the baseline scenario and reduction scenarios having different technology penetrations, comparing the emissions amounts from two scenarios. However, when deciding the development path of future technologies, the factors that must be taken into consideration are the technology applicability and maturity, local material supply, personnel constraints, and so on.
2.2.1. CH4 emissions baseline scenario for domestic wastewater treatment
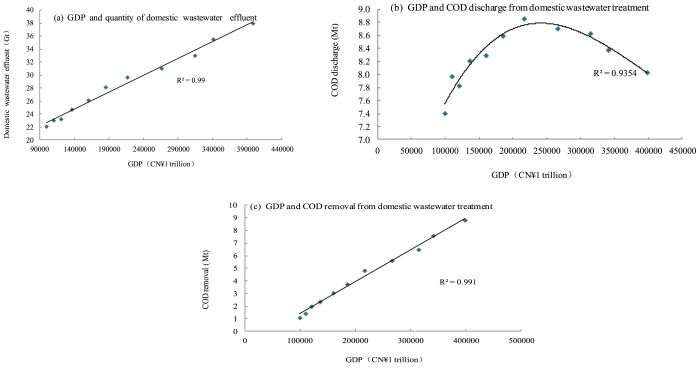
Domestic wastewater from towns and cities includes water discharged from family homes (e.g. toilets, washers and bath water, water discharged from kitchens), commerce, hospitals, and others. The output of domestic wastewater in towns and cities is affected by multiple factors. The gross domestic product (GDP) is an important comprehensive indicator reflecting the economic development of a country. Economic development and improvement of peoples living conditions promotes an increase in domestic wastewater and COD discharge and removal. The relevant characteristic data and GDP data on domestic wastewater treatment from 2000 to 2010 is used to analyze the relationship between GDP and domestic wastewater discharge, and COD discharge and removal. Fig. 1 displays the relationship between these variables. A significance test of α = 0.01 was performed. The correlation coefficient between domestic wastewater COD discharge and GDP is tested, resulting in a GDP-COD discharge model that is put forward for use in estimating future CH4 emissions.
|
|
|
Fig. 1. Correlation of GDP and domestic wastewater emissions, COD emissions, and COD removal, respectively. |
The relationship between the quantity of domestic wastewater effluent and GDP from 2000 to 2010 (Fig. 1a) indicates that the quantity of domestic wastewater effluent grows annually with a stable GDP growth. The quantity of domestic wastewater effluent shows a linear relationship with GDP. The statistical calculation model for the quantity of domestic wastewater effluent can be represented as follows:
|
|
(4) |
Where WG indicates the quantity of domestic wastewater effluent (1 Gt) and G indicates the annual GDP (CN¥1 trillion) in China.
Fig. 1b displays the change in COD discharged from domestic wastewater with GDP. The figure indicates that the COD discharge from domestic wastewater increases annually with GDP. After a certain GDP value is reached, the COD discharge begins to decrease. When the GDP reaches CN¥ 22 trillion, the COD emissions begin to decrease. Specifically, the domestic COD discharge increased annually prior to 2006 and has decreased since 2007. COD removal from domestic wastewater increased annually with adherence to the related regulations and standards of the State and improvements in the treatment process, technology and management. The equation is shown as follows:
|
|
(5) |
Where ECOD indicates COD discharge from domestic wastewater treatment (Mt).
This mode indicates that with State investment wastewater treatment increases, the treatment capability increases, and COD discharge shows a remarkable decrease with improvements in living conditions, revenue growth, and improvement in environmental awareness. This indicates that COD removal will grow to a certain extent in the future. Fig. 1c displays the change in COD removal from domestic wastewater with GDP. Eq. (6) gives the relationship between COD removal and GDP. It indicates that COD removal grows linearly with growth of the economy. The quantity of domestic wastewater effluent increases linearly with GDP (Eq. 4). On the other hand, treatment technologies and facilities will be further improved with economic development, and COD removal will obviously increase at the same time. It also indicates that the rough economy growth mode has transformed into an intensive economy growth mode in China. Environmental protection, energy conservation, and emission reduction are focused on simultaneously with economic development to gradually realize a low-carbon economy growth pattern.
|
|
(6) |
Where RCOD indicates COD removal (Mt).
2.2.2. CH4 emissions scenario for domestic wastewater treatment
For GHG emission control in domestic wastewater treatment, CH4 is recycled and reused in the process. In anaerobic systems where CH4 is recycled the fuel handling function replaces the wastewater or sludge oxidation treatment system. Treatment plants recycle and combust CH4 gas by using the sludge anaerobic treatment system. The national control policy, Urban Wastewater Treatment Plant Engineering Project Construction Standard (2001 revision), specifically states that wastewater treatment plants over 0.1 Mt per day must treat sludge using the middle-temperature anaerobic assimilation process.
With population growth and urban improvement the output of domestic wastewater quickly increases. According to the requirements of the energy-saving and emission-reduction target scheme in China, COD discharge from domestic wastewater treatment must reduce by 10% during the period of the 11th Five-Year Plan, and will further be reduced during the 12th Five-Year Plan. COD discharge reduction will increase COD removal. The reduced COD discharge will increase GHG output, especially CH4 output. Therefore, it is assumed that CH4 net emissions can be reduced by 7% in the reduction scenario. The specific scenarios are shown in Table 1.
| Emission reduction technology | Emission reduction control policy | CH4 emission reduction |
|---|---|---|
| Control the aerobic reaction percentage | Design and construction standard of urban wastewater treatment plant engineering project | 7% |
| Anaerobic system with CH4 recycling and combustion treatment function | Best feasible technology guide for prevention and governance of sludge treatment and disposal of city and town wastewater treatment plants | |
| CH4 recycling and utilization in sludge anaerobic assimilation | Notification of ministry of finance and state taxation administration on comprehensive resource utilization and value-added tax policies of other products |
2.2.3. CH4 emission baseline scenarios for industrial wastewater treatment
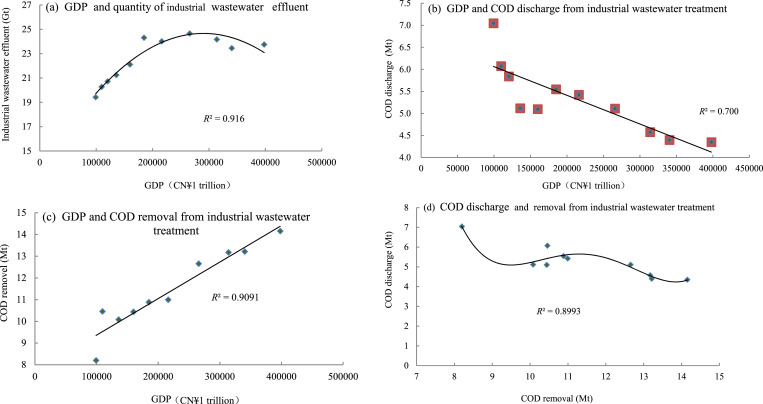
Industrial wastewater treatment was similar to that of domestic wastewater in China from 2000 to 2010 (Fig. 2a), but correlation between COD discharge, COD removal, and GDP in industrial wastewater treatment is not the same as that of the domestic wastewater (Fig. 2b, c) because the treatment of industrial wastewater is directly associated with the level of industrial development. The requirements for COD discharge in industrial wastewater treatment are high under the energy-saving and emission reduction scheme, so it requires COD discharge to reduce with GDP and population increases. Energy saving and emission reduction are promoted vigorously in China. There are strict regulations on COD discharge during wastewater treatment. Industrial wastewater output increases significantly when the economy and population increase, COD removal increases non-linearly, and the associated COD discharge is shown in Fig. 2d. The statistical calculation model of the quantity of industrial wastewater effluent, COD discharge, and COD removal can be represented as follows:
|
|
(7) |
Where IG indicates the quantity of industrial wastewater effluent (Gt).
|
|
(8) |
Where ICOD indicates COD discharge from industrial wastewater treatment (Mt).
|
|
(9) |
Where LCOD indicates COD removal from industrial wastewater (Mt) and G indicates the GDP in China (CN ¥1 trillion).
|
|
|
Fig. 2. Correlation of GDP and COD discharges and removal of industrial wastewater. |
COD removal is predicted according to future GDP scenarios.
2.2.4. CH4 emission scenario for industrial wastewater treatment
Industrial wastewater generally includes a high concentration of organics that are removed by anaerobic means. During this process, the GHG is treated using an anaerobic reaction eliminator with a CH4 gas collector, and discharged to an anaerobic pond. The recycled CH4 gas can be used on-site and can replace fossil fuels in plant power or heat generation. The CH4 can be centrally combusted and discharged. This technology reduces the amount of CH4 usually discharged to the air during anaerobic degradation in open oxidation ponds.
In addition, according to national regulations, more and more enterprises are starting to treat their wastewater using the anaerobic reactor. Although the amount of CH4 gas generated by anaerobic decomposition and directly emitted into the air from open oxidation ponds is reducing, the sludge generated is not easily treatable. A large amount of CH4 generated by the anaerobic degradation of sludge will still be discharged to the air. The sludge can be treated by installing a sludge anaerobic assimilation reactor with a CH4 collector, where the sludge is stabilized by a final pressing and dehydration. The anaerobic assimilation reaction of this sludge is same as that from domestic wastewater. The sludge anaerobic assimilation stabilizes the sludge and reduces GHG emissions from the wastewater and sludge treatment.
Based on a summary of industrial wastewaters with a high concentration of organics and the cleaning development mechanism (CDM) project into anaerobic sludge assimilation, the amount of CH4 gas recycled in 2010 was 5.4% of total CH4 emissions. In view of the above analysis, technologies, and methods, CH4 emission reduction target is set as 10% for our reduction scenario.
2.3. Data
The data used mainly includes the emission factors and activity data. The activity data includes the organics content in domestic wastewater and total degradable organics in industrial wastewater. In the calculation method provided by IPCC, 1996, IPCC, 2000 and IPCC, 2006, the COD discharge refers to the oxygen required for a chemical oxidant to oxidize the organic pollutants in the water. Higher COD values mean more severe organic pollutants in the water. The removed COD refers to the pure weight of COD in the removed wastewater. Generally, the amount of CH4 generated from treated wastewater with high COD or BOD concentrations is more than that generated from that with lower concentrations. The activity data used in this paper comes from China Statistics Yearbook (NBSC, 2005–2010) and China Environment Statistics Yearbook (MEP, 2012a and MEP, 2012b). The BOD/COD value used in the domestic wastewater calculation is based on the concentrations in the incoming water from the 2005 China Wastewater Treatment Plants Compilation (CAWW, 2006). Based on the area analysis and statistics, other drainage factors and related parameters are derived from the references and previous research achievements (DCC, 2014).
2.3.1. Activity data
The calculated CH4 emissions from wastewater treatment include domestic and industrial wastewater. According to IPCC, 1996, IPCC, 2000 and IPCC, 2006, when determining the organics content of domestic wastewater, the BOD can be used as a measurement index. Since the statistical data does not include current BOD, this paper calculates BOD/COD by studying and utilizing the monitoring data from Chinas Second National Greenhouse Gas Inventory where the average ratio of BOD/COD is calculated from regional statistics from seven administrative areas in China (DCC, 2014). This coefficient can convert COD into BOD to get the average BOD/COD (0.46) (Hu et al., 2014 and IPCC, 2000). The statistical data indicates that a total of 33.726 Gt of wastewater were treated in China during 2010, including 27.692 Gt of domestic wastewater. There were wastewater treatment plants, removing 8.8258 Mt COD. The treatment rate of wastewater in towns and cities was 88.8%. During the treatment of domestic wastewater 8.0330 Mt COD were discharged. The activity data for industrial wastewater includes that directly discharged to the oceans (4.348 Mt) and COD removed during treatment (14.1539 Mt). Key industries discharged 3.6564 Mt. The trend of the activity data from 2005 to 2010 is shown in Table 2.
| Year | COD discharge (Mt) | COD removal (Mt) | ||
|---|---|---|---|---|
| Domestic wastewater | Industrial wastewater | Domestic wastewater | Industrial wastewater | |
| 2005 | 8.5944 | 5.5473 | 3.7459 | 10.8826 |
| 2006 | 8.8591 | 5.4230 | 4.8303 | 10.9927 |
| 2007 | 8.7075 | 5.1110 | 5.6202 | 12.6537 |
| 2008 | 8.6312 | 4.5760 | 6.4916 | 13.1735 |
| 2009 | 8.3786 | 4.3970 | 7.5961 | 13.2126 |
| 2010 | 8.0330 | 4.3480 | 8.8258 | 14.1539 |
The main emission parameters for calculating the optimal treatment of domestic wastewater include the CH4 correction factor (M) and the maximum CH4 generation capacity (Bo). M indicates the anaerobic level of the treatment system. If actual operation conditions and technology level are considered, M of the domestic wastewater discharged to the wastewater treatment plant is 0.165 and Bo ranges from 0.456 to 0.587 kg CH4 (kg BOD)−1, according to the research results from Chinas Second National Greenhouse Gas Inventory ( DCC (The Department of Climate Change of National Development and Reform Commission), 2014 and Song et al., 2011). The maximum value 0.587 kg CH4 (kg BOD)−1, the same as the recommended value by IPCC (2000), is used as the future emission potential in this paper.
Similarly, M of CH4 emissions from industrial wastewater treatment is 0.4674 kg CH4 (kg BOD)−1. Although Bo has been investigated, few studies have been carried out in the industrial sector, and there is a lack of data. The maximum CH4 generation capability is for the CH4 generation capacity under the ideal experiment conditions, not closely associated with the areas and realistic treatment environment, and related to the selection of process, so there is no big fluctuation. Different countries use this data in their inventory calculations, so the recommended value for GPG (0.25 kg CH4 (kg COD)−1 or 0.6 kg CH4 (kg BOD)−1) is used in this calculation (IPCC, 2000).
3. Results
3.1. CH4 emission features in wastewater treatment in China
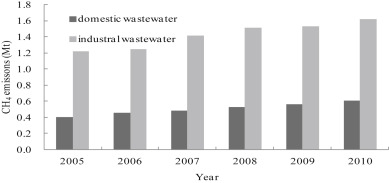
Fig. 3 shows the calculation results of CH4 emissions from domestic and industrial wastewater treatment in China from 2005 to 2010. The results indicate that CH4 emissions increase annually. In 2010, CH4 emissions from domestic wastewater treatment were about 0.611 Mt, an increase of 34.2% compared to 0.402 Mt in 2005. CH4 emissions from industrial wastewater treatment were about 1.6237 Mt in 2010, an increase of 24.8% compared to 1.2204 Mt in 2005. The main driving force for this change is the increase inactivity data and the trend is also consistent with the change trend of the activity data. The emission factor is associated with the process and management levels, so the value of the emission factor did not change.
|
|
|
Fig. 3. Trends in methane emissions from wastewater treatment in China from 2005 to 2010. |
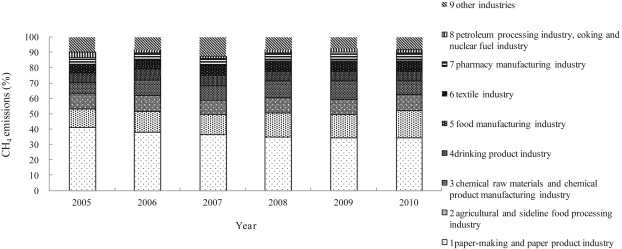
Fig. 4 shows the trend and percentage change of CH4 emissions from industrial wastewater treatment from 2005 to 2010 for eight key industries. Paper-making and paper products industry generated the highest CH4 emissions, followed by agriculture and food processing, chemical raw material and product manufacturing, the drinks industry, food manufacturing, the textile industry, pharmaceutical production, petroleum processing, the coking and nuclear fuel industry, and others. Eight industries accounted for 92% of total emissions from all industry in 2012. CH4 emissions were relatively lower in industries such as printing, tobacco, cultural and educational, sporting product manufacturing, furniture manufacturing, and waste recycling. CH4 emissions from industrial wastewater treatment were less than 1% of the total for all industries. Compared to 2005, the total CH4 emissions in the wastewater of the main polluting industries had increased by 2010. On the whole, CH4 emissions increased annually.
|
|
|
Fig. 4. CH4 emissions from industrial wastewater in key industries from 2005 to 2010. |
As can be seen, CH4 emissions from the wastewater of the eight key industries increased annually. Emissions from the paper-making and paper product industry were the most significant, and, were 0.5018 Mt, 0.4754 Mt, 0.5151 Mt, 0.5269 Mt, 0.5273 Mt, and 0.5576 Mt, respectively from 2005 to 2010. In addition, total emissions from all industries increased. Emissions were the second highest from the agricultural and food processing industry i.e., 0.1472 Mt, 0.1717 Mt, 0.1872 Mt, 0.2399 Mt, 0.2356 Mt, and 0.2859 Mt, from 2005 to 2010, respectively.
The uncertainty in the process of emission estimation is calculated according to the error propagation method provided by IPCC, 1996, IPCC, 2000 and IPCC, 2006. The integrated uncertainty of the CH4 emission calculation for domestic wastewater is 28%. The integrated uncertainty of CH4 emission calculation for industrial wastewater is 44%. When related processes and management level of the activity data are improve, acquisition quality and emission factors are further improved and the uncertainty can be reduced.
3.2. Scenario analysis from domestic wastewater treatment in the future
3.2.1. Baseline scenario analysis in the future
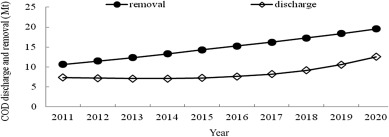
Based on GDP development prediction, the future COD discharge and removal from domestic wastewater are calculated. Based on the literature GDP growth rate is predicted to be between 7% and 12%. Based on State policies, Chinas economy is predicted to grow between 7% and 9% (He, 2012 and Guo and He, 2014; Pan, 2014; Liang et al., 2013). In this paper, the GDP prediction is based on Chinas GDP in 2010, 2011, and 2012. The growth rate of GDP is set as 7% prior to 2015 and 6% after. Eq. (5) and (6) are used to predict the future emissions and removal of COD. The results are shown in Fig. 5.
|
|
|
Fig. 5. Projected COD discharge and removal from domestic wastewater treatment. |
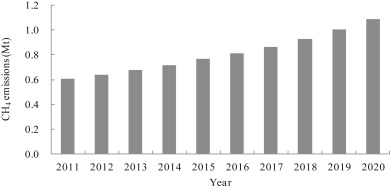
CH4 emissions from domestic wastewater are calculated using the activity data, which is represented by BOD. The average level of the whole country is either below mid-economic or non-developed, so the change is not big. According to Eq. (1), the value calculated above is used as the emission factor. The baseline scenario of CH4 emissions from domestic wastewater treatment is calculated, as shown in Fig. 6.
|
|
|
Fig. 6. Baseline scenario of CH4 emissions from domestic wastewater treatment. |
3.2.2. CH4 reduction scenario and emission reduction potential
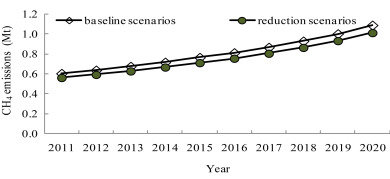
CH4 emissions are shown in Fig. 7 as the future baseline and reduction scenario. Under this scenario, in 2015 CH4 emissions from domestic wastewater treatment are 0.7114 Mt and the emission reduction potential is 0.0535 Mt. Compared to 2010, the reduced emissions will increase by 16% in 2015. In 2020 the CH4 emissions will be 1.0136 Mt and the emission reduction potential will be 0.0763 Mt. The reduced emissions will increase by 66% compared to 2010.
|
|
|
Fig. 7. Chinas CH4 emissions under baseline and reduction scenarios from domestic wastewater. |
3.3. Scenario analysis from industrial wastewater treatment in the future
3.3.1. Baseline scenario analysis in the future
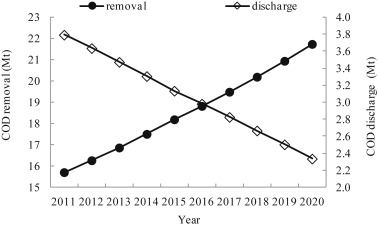
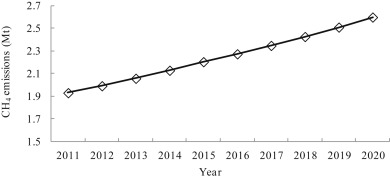
The projected COD discharge and removal from industrial wastewater are shown in Fig. 8. The GDP growth rate was 7% prior to 2015, and 6% after. On this basis the activity data was predicted. CH4 emission factor of the industrial wastewater treatment from 2005 to 2010 is used to predict the emissions in the future baseline scenario. The results are shown in Fig. 9. It can be seen that if emission reduction and control measures are not taken, with the growth of GDP and population, CH4 emissions are predicted to reach 2.5993 Mt by 2020. The growth is quick. The baseline scenario conflicts with the mitigation global climate change and the GHG emissions reduction. Therefore, the reduction scenarios were designed based on comprehensive analysis of actual conditions in China and predictable plans and future measures.
|
|
|
Fig. 8. Projected COD discharges and removal from industrial wastewater. |
|
|
|
Fig. 9. Baseline scenario of CH4 emissions from industrial wastewater. |
3.3.2. CH4 reduction scenario and emission reduction potential
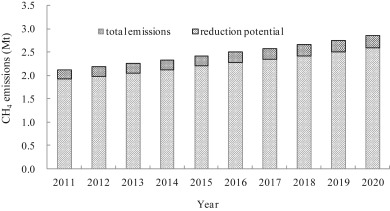
The future reduction scenario and emission reduction potential is shown in Fig. 10. The figure indicates that by 2015, CH4 emissions will reach 1.9836 Mt with an emission reduction potential of 0.2204 Mt. The emissions will increase by 22% compared with 2010. By 2020, the emission will reach 2.3393 Mt, and the emission reduction potential will be 0.2599 Mt, with an increase of 44% compared to 2010.
|
|
|
Fig. 10. CH4 emissions and control potential from industrial wastewater under emission control. |
4. Conclusions and discussion
From the above analysis the following conclusions are drawn:
- In China, CH4 emissions from domestic wastewater treatment were 0.611 Mt and 1.6237 Mt from industrial wastewater treatment in 2010. CH4 emissions from eight industries such as paper-making and paper products industry accounted for 92.2% of the total industries. CH4 emissions increased annually from 2005 to 2010.
- GDP is one of the key driving forces associated with the quantity of wastewater effluent, and COD discharge and removal. For domestic and industrial wastewater, with GDP as the variant, activity data is predicted via the prediction model. The emission factor does not change to get CH4 emissions in the future.
- Under the designed reduction scenario, by 2020, CH4 emission reduction will be 7% from domestic and 10% from industrial wastewater treatment. In 2020, after the emission reduction, CH4 emissions from domestic and industrial wastewater treatment will be 1.0136 Mt and 2.3393 Mt, respectively, resulting in an increase of 66% and 44% respectively compared to 2010.
- Under the reduction scenario by 2020, the CH4 emission reduction potential of domestic wastewater treatment will be 0.0763 Mt and that of industrial wastewater treatment will be 0.2599 Mt.
This paper completely analyzed and calculated wastewater treatment in China by using the State Statistical Yearbook data. The statistical data quality cannot be guaranteed in the current research. So the conditions of wastewater treatment plants in different areas may not be analyzed in detail. The emission calculation has uncertainties. Compared to previous studies the results and trend research are more comprehensive. These results are significant for future research regarding peak GHG emissions in China and policymaking regarding climate change. In the future, wastewater treatment can reduce its GHG emissions to some extent. To achieve this and to help selecting technology for the future, GHG recycling and utilization should be focused on. The recycling technologies, policies, and measures suitable for actual conditions in China should be promoted and studied. The regulations and standards regarding GHG recycling should be further subdivided in the future.
Acknowledgements
This research was supported by the National Natural Science Foundation of China (41175137), the Climate Change Working Program of MEP in 2015 (CC(2015)-9-3) and the Climate Change Project of Beijing in 2014 (ZHCKT4).
References
- van Bodegom et al., 2004 P.M. van Bodegom, J.C.M. Scholten, A.J.M. Stams; Direct inhibition of methanogenesis by ferriciron; Fems Microbiol. Ecol., 49 (2) (2004), pp. 261–268
- Cai et al., 2015 B.-F. Cai, Q.-X. Gao, Z.-H. Li, et al.; Study on the methane emission factors of wastewater treatment plants in China; China Popul. Resour. Environ., 25 (4) (2015), pp. 118–124
- CAWW, 2006 CAWW (China Association of Water & Wastewater professional Committee of Urban drainage); China Wastewater Treatment Plants Compilation; (2006) Beijing (in Chinese)
- Czepiel et al., 1993 P.M. Czepiel, P.M. Crill, R.C. Harriss; Methane emissions from municipal wastewater treatment processes; Environ. Sci. Technol., 27 (12) (1993), pp. 2472–2477
- DCC (The Department of Climate Change of National Development and Reform Commission), 2014 DCC (The Department of Climate Change of National Development and Reform Commission); The Peoples Republic of China National Greenhouse Gas Inventory 2005; China Environmental Press, Beijing (2014) (in Chinese)
- Doorn et al., 1997 M.R.J. Doorn, R. Strait, W. Barnard, et al.; Estimate of Global Greenhouse Gas Emissions from Industrial and Domestic Wastewater Treatment, Final Report. EPA-600/R-97-091; Prepared for United States Environmental Protection Agency, Research Triangle Park, NC, USA (1997)
- Guisasola et al., 2008 A. Guisasola, D. Haas, J. Keller, et al.; Methane formation in sewer systems; Water Res., 42 (6) (2008), pp. 1421–1430
- Guo and He, 2014 Q.-Y. Guo, Y. He; Based on DFA method and GDP forecast model of BP neural network; Stat. Decis. (8) (2014), pp. 82–84 (in Chinese)
- Guo et al., 2011 L.-N. Guo, B.-D. Wang, R. Guo, et al.; Emissions and control of greenhouse gases in sewage treatment and control; Gr. Water, 33 (6) (2011), pp. 70–72 (in Chinese)
- Guo et al., 2012 J.-B. Guo, Y. Tian, L.-H. Zhang, et al.; Emission and reduction strategies of greenhouse gases generated in municipal wastewater treatment plants; Chem. Ind. Eng. Prog., 31 (7) (2012), pp. 1604–1609
- He, 2012 X.-Y. He; The Chinas GDP growth forecast based on time series model; Theory Pract. Financ. Econ., 33 (178) (2012), pp. 96–99 (in Chinese)
- Hu et al., 2014 D.-L. Hu, L.-C. Wang, Z. Zhou; Status and prospects of greenhouse gas emissions in wastewater treatment; Environ. Sci. Technol., 37 (3) (2014), pp. 108–112 (in Chinese)
- IPCC, 1996 IPCC; Revised 1996 IPCC Guidelines for National Greenhouse Gas Inventory; IGES, Japan (1996)
- IPCC, 2000 IPCC; Good Practice Guidance and Uncertainty Management in National Greenhouse Gas Inventory; IGES, Japan (2000)
- IPCC, 2006 IPCC; IPCC Guidelines for National Greenhouse Gas Inventory; IGES, Japan (2006)
- IPCC, 2013 IPCC; Climate Change 2013: the Physical Science Basis; Cambridge University Press, Cambridge and New York (2013)
- IPCC, 2014 IPCC; Climate Change 2014: Mitigation of Climate Change; Cambridge University Press, Cambridge and New York (2014)
- Jeong et al., 2009 T.-Y. Jeong, H.-K. Chung, S.-H. Yeom, et al.; Analysis of methane production inhibition for treatment of wastewater sludge containing sulfate using an anaerobic continuous degradation process; Korean J. Chem. Eng., 26 (5) (2009), pp. 1319–1322
- Liang et al., 2013 Q. Liang, J.-Q. Liu, P.-L. Weng; Forecast of China GDP growth rate from PMI: PMIs design rationality and forecast effect; Foreign Invest. China (EXPERT FORUM) (16) (2013), pp. 7–11 (in Chinese)
- MEP, 2012a MEP (Ministry of Environmental Protection of China); China Environment Yearbook; China Statistics Press, Beijing (2005−2012a) (in Chinese)
- MEP, 2012b MEP (Ministry of Environmental Protection of China); Chinas Environmental Statistics Report; China Environmental Science Press, Beijing (2005−2012b) (in Chinese)
- NBSC, 2005 NBSC (National Bureau of Statistics of China); China Statistics Year Book; China Statistics Press, Beijing (2005−2010) (in Chinese)
- Oriol et al., 2009 G. Oriol, P. Donghee, R.S. Keshab, et al.; Effects of long-term pH elevation on the sulfate-reducing and methanogenicactivitie of anaerobic sewer biofilms; Water Res., 43 (9) (2009), pp. 2549–2557
- Pan, 2014 L. Pan; Empirical analysis of Chinas GDP growth rate based on the ARMA_DDVmodel; Intelligence, 2 (2014), p. 25 (in Chinese)
- Song et al., 2011 L.-L. Song, Y. Luo, Q.-X. Gao, et al.; Regional difference analysis of the correlation between BOD and COD in domestic wastewater; Res. Environ. Sci., 10 (24) (2011), pp. 1154–1160 (in Chinese)
- Wang et al., 2011 J.-H. Wang, J. Zhang, H.-J. Xie, et al.; Methane emissions from a full-scale A/A/O wastewater treatment plant; Bioresour. Technol., 102 (9) (2011), pp. 5479–5485
- Zhang et al., 2009 L.-S. Zhang, J. Keller, Z.-G. Yuan; Inhibition of sulfate-reducing and methanogenic activities of anaerobicsewer biofilms by ferric iron dosing; Water Res., 43 (17) (2009), pp. 4123–4132
- Zhou et al., 2012 X. Zhou, Y.-F. Zheng, R.-J. Wu, et al.; Greenhouse gas emissions from wastewater treatment in China during 2003−2009; Progress. Inquis. Mutat. Clim., 8 (2) (2012), pp. 131–136
- Zu et al., 2008 B. Zu, J. Zu, F.-C. Zhou; Biophysical and biochemical characteristics of methanogenic organism; Environ. Sci. Technol., 31 (3) (2008), pp. 5–8 (in Chinese)
Document information
Published on 19/07/16
Licence: CC BY-NC-SA license
Share this document
Keywords
claim authorship
Are you one of the authors of this document?
