Abstract
The main purpose of this suite is Planning and Management of Seismic Emergencies before and after future damaging earthquake. This tool is written in ArcGIS software executing a fast and efficient determination of the estimated shakemaps and damage scenarios. The tool allows to select the earthquake source parameters through a defined database; moreover ground motion prediction equations can be chosen and they can be combined according to the study area features. The local site effects are characterized from Vs30 values, which have been achieved by topographic slope as a proxy (even with local correlations) obtained from digital elevation model. The elements exposed to risk are incorporated from the cadastral database after inputs has been refined through an automated analysis. Vulnerability and estimated losses can be determined either empirically (EMS-98 scale and Vulnerability Index, Iv) or analytically (Capacity spectrum). Additionally, a vulnerability modifier is implemented to account soil-structure resonance. Epistemic uncertainties are quantified in the input parameters using a logic tree. This tool has been validated through a representative seismic scenario: the 1910 Adra earthquake (southern Spain) with moment magnitude () 6.3 and macroseismic intensity VIII (EMS-98 scale) proving the reliability of this program.
Keywords: Emergency planning, shakemaps, vulnerability, damage scenarios, GIS
1. Introduction
Seismic risk management involves the physical and structural consequences of an earthquake and the socio-economic considerations affecting the current population or even future generations. Therefore, it integrates evaluation of the risk and the corresponding adopted decisions in order to improve the seismic resilience.
The Iberian Peninsula shows a low to moderate seismicity in the world context with frequent earthquakes of moment magnitude () generally smaller than 5.5, although, historically, large damaging earthquakes have occurred with epicentral macroseismic intensity () IX-X in the EMS-98 scale [1], as those of 1829 Torrevieja (Alicante) and 1884 Arenas del Rey (Granada). Both earthquakes caused the collapse of many buildings and a high number of human losses [2].
Recently, several instrumental earthquakes occurred in southeast of Spain, such as: Adra (Almería) 1993 and 1994; Mula (Murcia) 1999; Bullas (Murcia) 2002; La Paca (Murcia) 2005 and Lorca (Murcia) 2011, with magnitudes () between 4.7 and 5.2 respectively, and ranging from V to VII (EMS-98 scale [1]). These shocks have shown the relevance of shallow geology for explaining not only the ground motion amplification but the degree and spatial distribution of building destruction [3,4,5,6,7,8].
Consequently, preventive decision-making aimed at doing recommendations for the mitigation of seismic risk is more effective if seismic emergency managers (Civil Protection) have user-friendly software capable of estimating damage and loss scenarios in future earthquakes. This information is essential to develop Seismic Emergency Plans at local level for the municipalities because they establish the organization scheme and action procedures needed to effectively deal with the earthquake emergency. Such procedures are of great importance for any seismically active region, regardless of the level of seismic hazard. The tool has been created based on these ideas.
One of the first seismic risk suites in Spain having this goal in mind is “Simulador de Escenarios Sísmicos-SES2002” [9]. This software was created specifically for the Civil Protection and although it has been widely used, nowadays it is not up to date.
After the development of HAZUS [10], known as a reference for the earthquake losses estimations, numerous modelling tools have been developed by scientists worldwide to estimate seismic risk, although mainly focused on the scientific community. Table 1 shows a summary of these tools with a brief comparison in terms of methodologies and results.
| Tools Description |
HAZUS® [10] |
SES 2002 [9] |
SEISMOCARE [11] |
SELENA [12] |
CAPRA [13] |
Armagedom [14] |
OPENQUAKE [15] |
SISMOTOOL |
|---|---|---|---|---|---|---|---|---|
| GIS integration | ESRI ArcGis | Map Objects (own GIS) | MapInfo | No | Own GIS | Own GIS | QGIS | ESRI ArcGis |
| Open Source | No | No | No | Yes | No | No | Yes | Yes |
| Seismic scenario | Deterministic Pre-computed shake Map Probabilistic |
Deterministic | Deterministic | Deterministic Probabilistic |
Probabilistic | Deterministic Probabilistic |
Deterministic Probabilistic |
Deterministic Pre-computed shake Map |
| Ground motion parameter | Spectral acceleration | Macroseismic intensity | PGA | Spectral acceleration | PGA | Macroseismic intensity
Spectral acceleration |
Spectral acceleration | Spectral acceleration |
| Site effects: Vs30 values and topography factors | Yes (soil amplification factor or amplified shakemaps) given by users | No | Yes (soil amplification factors) given by users | Yes (soil amplification factor; amplified shakemaps and topographic amplification factors) given by users | Yes (computation of amplified shakemaps using transfer functions) given by users | Yes (soil raster file, Liquefaction susceptibility raster file, landslide susceptibility raster file) given by users | Yes (soil amplification factors) given by users | Yes (soil amplification factor; amplified shakemaps and topographic amplification factors) given by users or computed by the tool |
| Exposure | Buildings Infrastructures Population | Buildings Population | Buildings Infrastructures Population | Buildings Population | Buildings Population | Buildings Population | Buildings Infrastructures Population | Buildings Population |
| Interface to generate vulnerable elements | No | No | No | No | No | Yes | No | Yes |
| Vulnerability estimate | USA buildings typologies | No | No | No | No | Yes | No | World-wide buildings typologies |
| Resonance Soil-Structure | No | No | No | No | No | No | No | Yes (empirical) |
| Damage computation | Analytical | Empirical | Empirical | Analytical | Analytical | Empirical Analytical | Analytical | Empirical Analytical |
| Results Viewer | Buildings, lifelines and essential facilities damage. Fire-following earthquake and Debris generation. Economic losses, Casualties and Shelter. Indirect Losses | Seismic intensity. Building damage. Casualties | Building damage. Casualties. Cost of damage | Shakemaps in terms of spectral acceleration. Building damage. Casualties. Cost of damage. Estimation of debris and shelter requirements | Physical exposure of construction. Direct economic losses. Probabilistic Risk: Average annual loss and Probable maximum loss. | Shakemaps in terms of intensity and spectral acceleration. Building damage. Casualties | Loss of life. Property damage and social and economic disruption due to earthquakes | Shakemaps in terms of intensity and spectral acceleration. Building and dwelling Damages. Economic losses. Casualties and Shelter |
Therefore, the aim of this paper is to show a new tool (SISMOTOOL) integrating strengths of the known platforms and incorporating new methodologies to reinforce the Civil Protection system. In particular, SISMOTOOL can automatically: a) compute amplification factors due to geology and topographic effects by using digital elevation models (DEM); b) assign and classify the vulnerability of the building stock through the cadastral database; c) include the soil-structure resonance effect in the vulnerability; as well as other improvements, always with the highest processing speed. Therefore, any stakeholder or emergency planner will be able to make decisions in a very short time by handling the program.
2. Methodology
2.1 GIS environment and databases (DB)
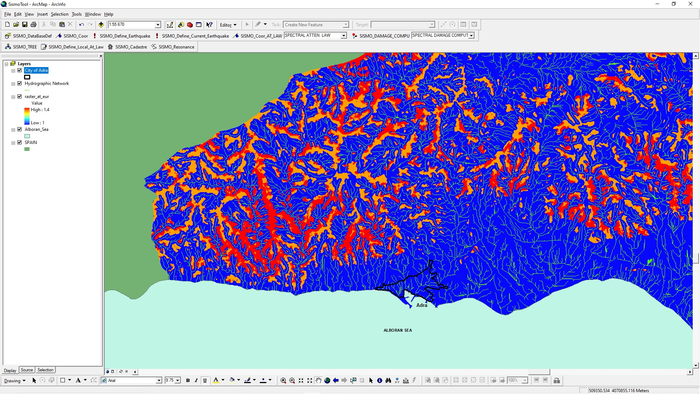
On the one hand, SISMOTOOL is coded to be part of the ArcGIS toolbar (Figure 1) because, nowadays, it is one of the world's most powerful mapping and analytics software. The current version works through an Add-in type ArcGIS customization; actually, VB.NET language and the ArcObjects software development kit integrated into a Microsoft Visual Studio programming environment are used to write the code of the tool. VB.NET has been chosen due to the combination of simplicity of use and speed compared to other development language options such as Java, Python or C++. Since ArcGIS is a commercial software, it is not unusual that stakeholders and emergency planners in the municipalities have it installed in their office and have expertise in its use; and even more, SISMOTOOL extension is an open-source code and, therefore, the source code of the Visual Studio project is provided, i.e. it can be specifically adapted either any user or a free GIS (for instance, QGIS).

|
| Figure 1. SISMOTOOL toolbar within the ArcGIS framework showing an intensity shakemap (1910 Adra earthquake) for Almeria (Spain) |
On the other hand, some of the main advantages of using ArcGIS is to automatically prepare all the needed DB for an accurate earthquake losses estimation; in other words: Seismic catalogue DB [16], Quaternary faults DB of Iberia [17], Hydrographic network and DEM [18], Cadastral information [19] and Population information [20] could be directly incorporated into the analysis.
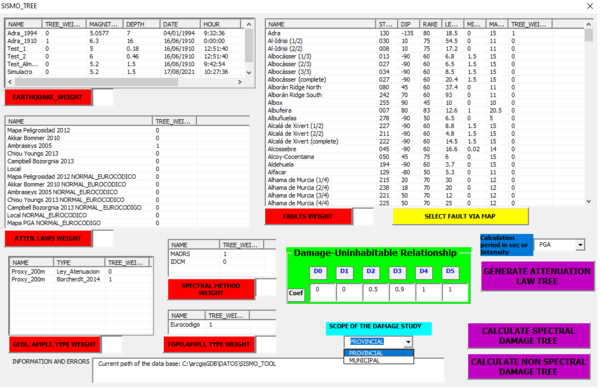
The user can interact and process these DBs through various forms that are displayed through the toolbar, such as the one corresponding to the logic tree calculation (section 2.2.7) shown in Figure 2.
|
| Figure 2. Example of one of the elements of the SISMOTOOL toolbar, used for logic tree calculation |
2.2 Earthquake loss estimation (ELE) methodology implemented in SISMOTOOL
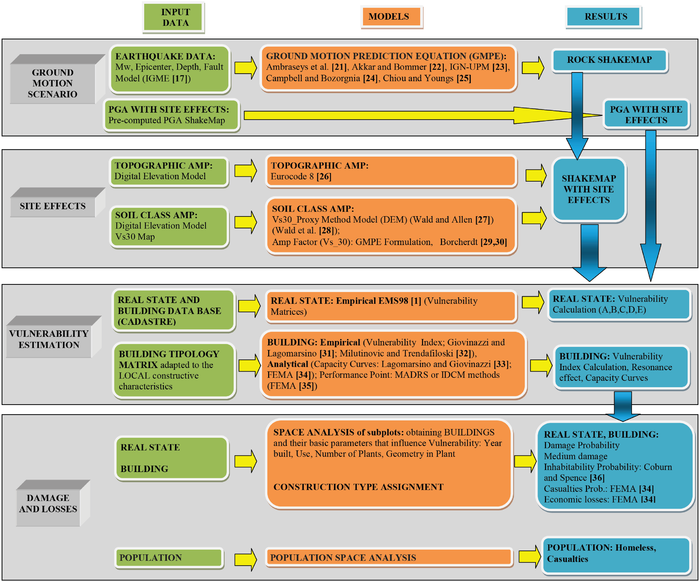
The main sequence of running SISMOTOOL is shown in Figure 3. To begin with, the user will introduce some data in every step through the toolbar (Figure 1) and then, execute within ArcGIS.
|
| Figure 3. SISMOTOOL development and computation scheme |
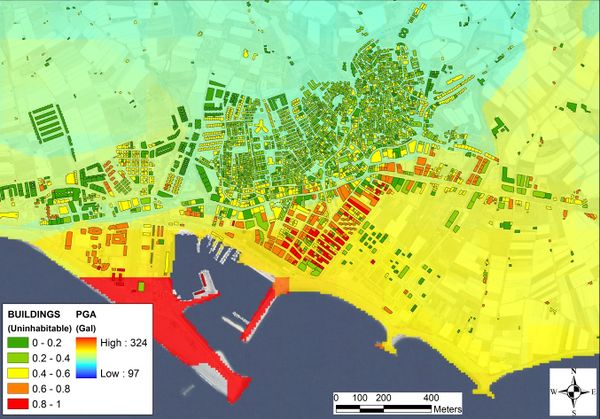
To aid in effective seismic emergency planning, results of damages and losses are calculated at the maximum available scale from the input data, at the building level and generating raster files with a spatial resolution of up to 5 m pixel (Figure 4).
|
| Figure 4. Simulation example obtained by SISMOTOOL for the Adra earthquake of 1910. The buildings colour represents the uninhabitability, on a base rater map that represents the PGA |
Although the methodology could be understood at a glance from Figure 3, some procedures, specially developed or coded in SISMOTOOL, are highlighted below.
2.2.1 Ground motion scenarios
The first step in any ELE computation is the description of the seismic impact in terms of a shakemap. To do that, two options are implemented: deterministic scenario and pre-computed shakemap.
2.2.1.1 Deterministic scenario
In the first option, the user can select the source parameters for a given earthquake (moment magnitude, latitude and longitude of the epicenter, focal depth or faulting type) from a pre-defined database of historical earthquakes. Additionally, a proprietary fault DB based on QAFI (Quaternary active faults DB of Iberia [17]) is integrated into the program (Figure 5). Therefore, the user can simulate any possible earthquake related to any of these faults and the rupture area will be estimated using the moment magnitude and the relationship given by Wells and Coppersmith [37]. The rupture area is spatially located in a plane parallel to the chosen fault plane and centered on the hypocenter which can be defined by the user through the epicentral coordinates and the focal depth; however, if the depth is unknown, this parameter will be automatically computed as the intersection of the fault plane with the vertical line from the epicenter. Additionally, a boundary condition is applied assuming that the calculated rupture area cannot get out from the earth's surface.

|
| Figure 5. SISMOTOOL fault DB, generated with data from QAFI [17] |
Next, the shakemap in terms of PGA at rock is computed after the selection of an appropriate ground motion prediction equation (GMPE). So, the user can choose between several GMPE currently implemented in the code. In particular, there are two European GMPE (Ambraseys et al. [21] and Akkar and Bommer [22]) which are also suitable to Spain [23]; one Spanish GMPE (IGN-UPM [23]) valid for and two of the latest next generation attenuation relationships (NGA) (Campbell and Bozorgnia [24] and Chiou and Youngs [25]) which can be applied worldwide and considers also the directivity and directionality of the source. Additionally, the user can easily modify the Spanish GMPE by changing its coefficient.
It is well known that one of the main sources of uncertainties comes from the GMPE chosen; thus, the user must decide what model, or combination of models, are appropriate. Bommer and Stafford [38] pointed out that the emphasis on the choice of GMPEs should be focused on their amenability to the target region and site instead of on the basis of their applicability. This difficulty has been considered and section 3 will show how SISMOTOOL can help to decide the corresponding GMPE by comparing the results with the PGA recorded from previous earthquakes.
The results can be expressed in terms of specific or design response spectrum (5% damped) following Eurocode 8 [39] guidelines.
2.2.1.2 Pre-computed shakemap
In the second option, if previous ground motion studies are available, the user can upload a PGA shakemap for the region in raster format including site effects, from which it is obtained an elastic response spectrum (5% damped) according to Eurocode 8 [39]. This spectrum will be used to estimate damage.
2.2.2 Site effects
Two factors are considered by SISMOTOOL: Topographic Amplification and Soil Class Amplification. Since it is difficult to have the necessary data to evaluate these amplifications at the regional level, some tools are included to enable this calculation always as a pre-process, if they are not provided by the user.
2.2.2.1 Topographic amplification
A specific subroutine is implemented to compute a topographic amplification factor in raster format.
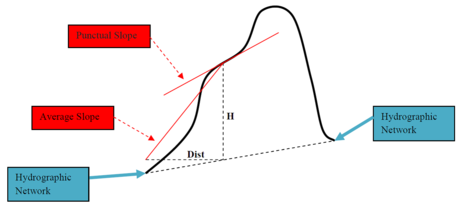
Following Eurocode 8 [26], the topographic amplification factor will range from 1.0 to 1.4 based on the slope angle of the relief. Then, using the digital elevation model (DEM) with the highest resolution (at least, 5-10 m), the subroutine will compute the height relative to the Hydrographic Network (H) (Figure 6) and later the slope angle as the most unfavourable value between the slope calculated at each point or the average slope (H/Dist) from the nearest free field of reference (Hydrographic Network).
|
| Figure 6. Scheme of parameter extraction from the DEM needed to implement the topographic amplification according to Eurocode 8 [26] |
Figure 7 shows an example of the computation of a topographic amplification map for Almería province, centered on the municipality of Adra.
2.2.2.2 Soil class amplification
The soil characteristics are classified by SISMOTOOL using the mean shear-wave velocity in the uppermost 30 m ground thickness (). The user must provide the geological map with its corresponding values distribution map in raster format.
The topographic slope method is an innovative, fast and very low-cost technique [27,28] to estimate the value based on the relationship between this quantity and the slope of the ground, obtained through a Digital Elevation Model (DEM). Recent studies in the Iberian Peninsula have applied the proxy method for estimating values at different scales [40,41,42]. In this respect, SISMOTOOL can perform an automatic estimation process of the values distribution adapted to the local geological characteristics of the region, using the topographic slope as a proxy [28]. For this, Eq. (1) is fitted to obtain the shear-wave velocity coefficients for each geological unit () and for slope ():
|
|
(1) |
where are variables indicative of the geological units used in the model; , , are the coefficients to be calculated using a least squares regression; is the instrumental shear-wave velocity values in m/s; and is the slope computed from the DEM expressed in m/m.
Then, the user can choose between two methods to amplify the ground motion at rock obtained in section 2.2.1. The first method (M1) inserts the Vs30 values in the corresponding GMPE to compute the amplified ground motion. The second method (M2) uses the relationship between Vs30 values and the corresponding amplification factors given by Borcherdt [29,30] to obtain the amplified ground motion.
An example of PGA amplification factor is shown in Figure 8 for the 1910 Adra earthquake scenario using Ambraseys et al. GMPE [21] and M2 soil class amplification method applied according to predicted Vs30 values from Eq. (1) using a slope map with 200 m resolution.

|
| Figure 8. PGA amplification factor for the Adra earthquake of 1910. The map covers the entire Almería province |
In this way, the user can compute and draw PGA, spectral acceleration and instrumental intensity maps with a pixel resolution of 5 to 10 m at different spatial scales (national, regional, local, user-defined).
2.2.3 Building database compilation
From Civil Protection Services and stakeholders’ point of view, one of the biggest difficulties arises in the vulnerability classification of a city (or region) and, above all, how to keep that information updated. To avoid this problem, an automated analysis of data obtained from the “Dirección General del Catastro” [19] (which is the Spanish agency in charge of the formation and maintenance of the Real Estate Cadastre as well as the dissemination of the cadastral information) is incorporated. From this source, and through the new GML format of the cadastral database (European INSPIRE directive), polygonal elements can be obtained as urban subplots which represent the built volumes within a plot. They contain the needed information for vulnerability classification: geometry of the floor, height of the buildings, year of construction and rehabilitation, use and state of preservation.
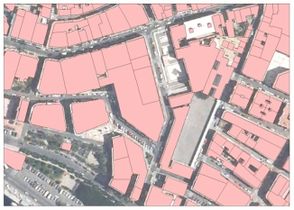
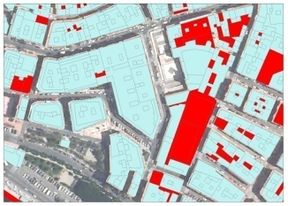
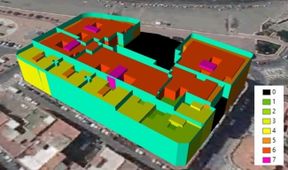
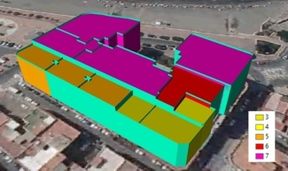
SISMOTOOL automatically processes this information to obtain the elements considered as buildings. In the first place, it filters the construction elements from the alphanumeric coding of subplots (e.g., the coding -II + IV + TZA represents a subplot made up of floors from level -2 to level 4 and an additional terrace [19]). Subsequently, all the construction elements belonging to the same plot are joined, to form the building element (Figures 9a and b), and the maximum number of floors of each building (Figure 9c) is extracted through an SQL selection algorithm (Figure 9d).
|
|
| (a) | (b) |
|
|
| (c) | (d) |
| Figure 9. Automatic extraction of building floor: (a) Constructive elements. (b) Floor extraction. And maximum number of floors: (c) Constructive elements. (d) Floor number | |
2.2.4 Building vulnerability estimation
Once the building database is compiled (section 2.2.3), the user can directly define the vulnerability of the buildings. Normally, this is not possible due to the lack of information on construction typologies, and it is necessary to make a statistical assignment of the vulnerability through a building typology matrix (BTM). A default BTM adapted to local construction characteristics and based on available basic data such as the year of construction and the number of floors (Table 2) is incorporated and can be modified by the user. Then, it is possible to assign (always as a pre-process) the vulnerability of each building (represented by the Vulnerability Index, ) based on the probability of belonging to each typology ()) and the vulnerabilities index defined for each basic typology () (Eq. (2)):
|
|
(2) |
The vulnerability index () can be improved using vulnerability modifiers defined by Milutinovic and Trendafiloski [31]. This improved index () is computed using Eq. (3):
|
|
(3) |
where is a regional modifier which depends on the geographical location of the building and are the behaviour modifiers which account for the structural typology, number of floors, aggregate buildings, irregularities, seismic design level, soil morphology, soft story or state of preservation. The default values, which can be modified by the user, are shown also in Table 2.
| Years | Floors | Percentage [43] | Building typology [33] | Typology description [33] | [33] | Preservation modifier |
Floors modifier | |
|---|---|---|---|---|---|---|---|---|
| ≤1925 | 1-2 | 25.3 % | M2.w_L | Adobe (earth bricks), wood slabs, 1-2 floors | 0.82 | 0.14 | 0.04 | -0.02 |
| 74.7 % | M3.w_L | Simple stone, wood slabs, 1-2 floors | 0.64 | 0.14 | 0.04 | -0.02 | ||
| 3-5 | 100 % | M3.w_M | Simple stone, wood slabs, 3-5 floors | 0.72 | 0.14 | 0.04 | 0 | |
| ≤1945 | 1-2 | 72 % | M5.w_L | Unreinforced Masonry (old bricks), wood slabs, 1-2 floors | 0.62 | 0.12 | 0 | -0.04 |
| 28 % | M6_L_PC | Unreinforced Masonry, reinforced concrete floors, 1-2 floors, Pre-code seismic standards | 0.57 | 0.12 | 0 | -0.04 | ||
| 3-5 | 100 % | M6_M_PC | Unreinforced Masonry, reinforced concrete floors, 3-5 floors, Pre-code seismic standards | 0.65 | 0.12 | 0 | 0 |
For the automatic evaluation of the behaviour modifiers (), it is necessary to analyze the geometric characteristics (floor and height) of each building as well as its relationship with the contiguous buildings. For example, the aggregate position modifier defines three types of buildings (middle, corner and header) and Figure 10 shows the procedure followed by SISMOTOOL to evaluate the position of a building in a block, which is based on the comparison of the building original area with a simplified area (built from the union of all the sections common to other polygons and closing the polygon between the first and last point of the free sections).

|
| Figure 10. Automatic evaluation of the position of a building in a block, carried out by SISMOTOOL |
2.2.5 Vulnerability modifier due to resonance soil-structure
The resonance effect between the soil and the structures occurs when the soil predominant period coincides with the natural period of the existing building. It is well known that this effect can have severe influence both on the degree and on the spatial distribution of building damage (even for moderate earthquakes). Recent examples were observed in Spain, e.g. in 1993 and 1994 Adra earthquakes [4,44] or in 1999 Mula earthquake [3,7].
SISMOTOOL computes a resonance probability map after the application of Eq. (4):
|
|
(4) |
where is the predominant period of the soil, is the natural period of the building if it has a , and is the probability that the building belongs to the .
The resonance probability is 1 if the predominant period of the soil and the natural period of the structure are equal and it decreases as the difference between the periods increase.
The natural period of a building of a is calculated from the empirical relationship , where represents the number of stories and is a constant which depends on the building typology ([4,45,46,47], amongst others). Therefore, SISMOTOOL incorporates a default resonance typology matrix (RTM) (Table 3) that the user can modify to adapt it to any study region. Table contains the a-value and a resonance modifier () which we have defined as 0.06 by default, according to the highest value proposed by Milutinovic and Trendafiloski [33]. This RTM will be used later to compute a resonance modifier (Eq. (5)) which can be combined with the others modifiers in the empirical method:
|
|
(5) |
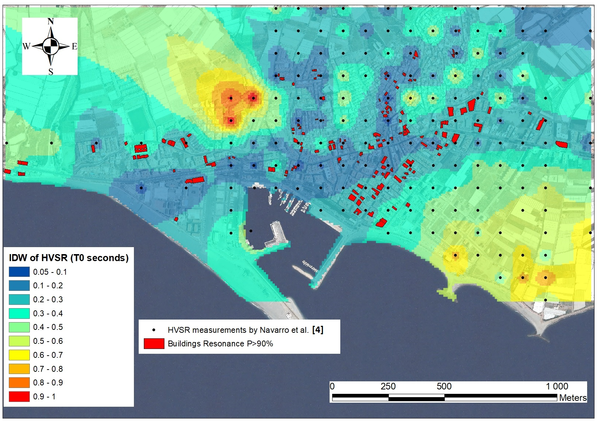
An example is shown in Figure 11, displaying the local soil predominant period raster map in the urban area of Adra. This map is computed by spatial IDW interpolation of the measurements carried out by Navarro et al. [4] from ambient noise HVSR; then, this raster and the relationship N [4] for Reinforced Concrete buildings in Adra town, is used to compute the probability of resonance. Afterwards, buildings with a probability greater than 90% are plotted as red filled polygons.
| Years | Floors | Percentage [43] | Building typology [33] | Typology description [33] | [4] | |
|---|---|---|---|---|---|---|
| ≥1977 ≤1996 |
1-3 | 100 % | RC1_III_L_DCL | Concrete Moment Frame, 1-3 floors, seismic code with seismicity zone III, Low ductility capacity | 0.06 | 0.049 |
| 4-7 | 66.2 % | RC1_III_M_DCL | Concrete Moment Frame, 4-7 floors, seismic code with seismicity zone III, Low ductility capacity | 0.06 | 0.049 | |
| 33.8 % | RC3_III_M_DCL | Reinforced concrete Dual System, 4-7 floors, seismic code with seismicity zone III, Low ductility capacity | 0.06 | 0.049 | ||
| ≥8 | 100 % | RC3_III_H_DCL | Reinforced concrete Dual System, ≥8 floors, seismic code with seismicity zone III, Low ductility capacity | 0.06 | 0.049 |
|
| Figure 11. Soil predominant period distribution map in Adra town |
2.2.6 Damages and losses computation
Two methodologies for damage estimation are implemented; the first one is empirical and the second one is analytical. This calculation phase of the tool is extremely critical, as it must be done in real-time once the user receives the earthquake information. For this reason, and given the possible high number of buildings to be analyzed (e.g. 252,196 for the province of Almería), their algorithms have been developed and verified for high-speed computation and accuracy.
2.2.6.1 Empirical Methodology (Vulnerability Index)
This methodology was proposed by Giovinazzi and Lagomarsino [31] and described by Milutinovic and Trendafiloski [32]. These authors correlate the mean damage grade ), the macroseismic intensity (, calculated at the centroid of the polygon that represents the building) and the Vulnerability Index () using semi-empirical vulnerability functions (Eq. (6)):
|
|
(6) |
2.2.6.2 Analytical methodology (capacity spectrum)
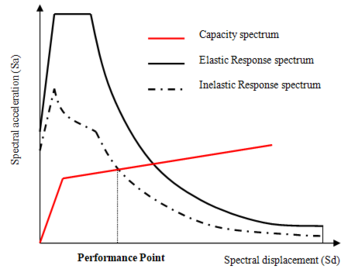
SISMOTOOL gets the performance point of a building due to a horizontal force applied to the structure (Figure 12), by implementing two simplified procedures: I-DCM and MADRS according to FEMA [35].
|
| Figure 12. Scheme for obtaining the performance point for analytical method |
Once the performance point () is known, the value is used in the fragility curves to obtain the degree of damage (Slight, Moderate, Extensive and Complete) employing Eq. (7) [32]:
|
|
(7) |
where is the probability that the damage state is exceeded given ; is the mean value of the spectral displacement at which the structure reaches the damage state threshold ; is the standard deviation of the natural logarithm of spectral displacement for damage state ; is the standard normal cumulative distribution function.
The impact of the earthquake can be also expressed in term of uninhabitable buildings, human and economic losses.
The number of uninhabitable buildings is evaluated using the Eq. (8):
|
|
(8) |
where are user defined coefficients (by default , , , as proposed by Coburn and Spence [36]).
The human and economic losses due to structural damage are computed following the HAZUS-MH [34] approach, and the user can define all the parameters that depend on the building typologies in a similar way as has been done with BTM and RTM, to adapt the methodology to local studies.
Finally, to estimate the population affected by damage to buildings, with the maximum possible resolution, it would be necessary to know the inhabitants for each building in which the damage is calculated. When there is no data from population at this scale, an average of the damage parameter under study is used on the minimum population unit for which data are available. In the current version of the program, the Census Sections and the information provided by the National Institute of Statistics have been used as a source of spatial data on the population [20].
In this way, SISMOTOOL can calculate the population affected by the chosen damage parameter (), (e.g., the uninhabitability of the building, or the severity of injury), in each Census Section, with the following formula (Eq. (9)):
|
|
(9) |
where is the total population; is the sum of probabilities of damage for every building; is the total number of buildings.
2.2.7 ELE using a logic tree
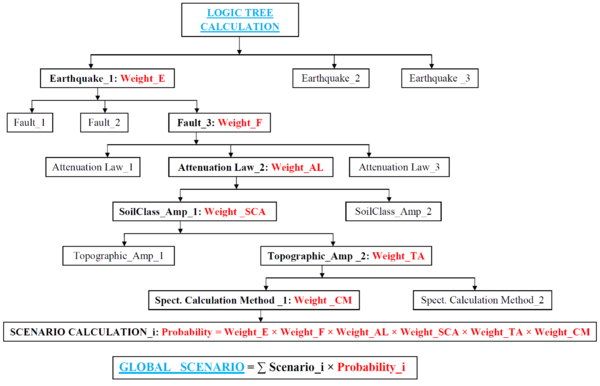
In many cases, all the parameters needed to correctly estimate an earthquake losses scenario have large uncertainties. A logic tree is included in order to take into account the epistemic uncertainties, as proposed by Molina et al. [12]. As shown in Figure 13, SISMOTOOL carries out the ELE computation for each one of the branches of the logic tree and the final result is the weighted mean (according to the weights given to each branch).
|
| Figure 13. Scheme for calculating the seismic damage Scenario using a logic tree |
3 Application of SISMOTOOL to Adra town
Adra town, with around 20,000 inhabitants [20], an urban area of 3.0 km2, and 3,600 buildings [19], is located in the SW of Almería province (SE Spain). According to the new seismic hazard map of Spain [23], this region is one of the most hazardous seismic areas with an estimated PGA at rock of 0.19g and 0.24g for 475 and 975 years return period, respectively. The presence of active local Quaternary faults close to the urban area (e.g. [49,50]) can generate catastrophic damage, even for moderate earthquakes, as revealed the 2011 Lorca earthquake of 5.2 scale [5,16].
SISMOTOOL has been used to compute the shakemap and damage scenario in Adra town assuming a repetition of the 1910 offshore Adra earthquake ( 6.3; focal depth 16 km; latitude: 36.58 N; longitude: 3.08 W; Adra fault). This earthquake generated a macroseismic intensity VII-VIII (EMS-98 scale [1]) in the town [2].
To perform a validation test, the results obtained by SISMOTOOL have been compared with other results of [50], shakemap [51] and damage scenario [43] obtained for Adra town by using the same earthquake scenario (1910 Adra earthquake) and different methodologies.
3.1 Vs30 structure
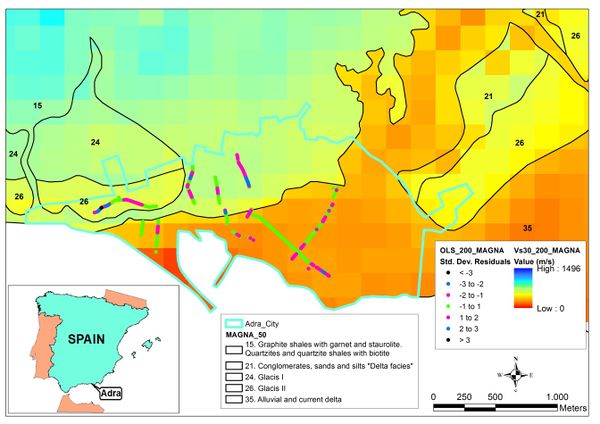
The identification and classification of urban geology is a first step to interpret the spatial geometry of geological/seismic formations and to perform an analysis of local site effects. According to the geological units from MAGNA_50 (Geological Map of Spain [52]), the Adra urban area can be divided into three main geomorphological zones (Figure 14). The first one (geological unit 15) is in the higher and older part of the town, delimited by normal faults ENE–WSW direction [4,53]. This unit is composed by graphite shales with garnet and staurolite, quartzites and quartzite shales with biotite. The second one (geological unit 26) is formed by narrow valleys that generally follow another fault system trending N–S [53] and mainly composed of continental glacis formed by clayey sands and gravels. And the third one (geological unit 35) is the deltaic plain of the Adra river, composed of Holocene alluvial sands and fine limes, whose thickness varies in the W-E direction [4].
A raster map of estimated Vs30 values is calculated (Figure 14) using a local specific correlation (Eq. (1)) between measured Vs30 values derived from previous research [50] on the study area, the geological units from MAGNA_50 [52] and topographic slope of the ground with 200 m resolution DEM (model V1). The results of estimated values show that the first geological unit (unit 15; Table 4) includes punctual zones where conditions for Eurocode 8 (EC8 [39]) A ground class have been found, prevailing areas with soil conditions EC8-B type. Estimated values vary in the 492-894 m/s range and the mean estimated value is 735±75 m/s. The second geological unit (unit 26; Table 4) has an average estimated Vs30 value of 535±41 m/s (EC8-B ground class) and the estimated values varied between 430 and 605 m/s. Finally, the alluvial fan of Adra river (unit 35; Table 4) shows predominantly conditions for EC8-C ground class with estimated Vs30 values vary in the 167-498 m/s range and a mean value of 349±59 m/s. These results are in agreement with the measured Vs30 values (Table 4) obtained in the study area using active and passive methods [50].
| Geological unit | Age | Geological formation | Estimated values | Measured values [50] | ||
|---|---|---|---|---|---|---|
| (m/s) | Average (m/s) | (m/s) | Average (m/s) | |||
| 15 | Triassic/ Paleozoic |
Graphite shales with garnet and staurolite. Quartzites and quartzite shales with biotite |
492-894 | 735±75 | 440-1044 | 676±121 |
| 26 | Pleistocene | Glacis | 430-605 | 534±39 | 442-998 | 604±146 |
| 35 | Holocene | Alluvial and current delta | 167-498 | 348±57 | 246-512 | 350±60 |
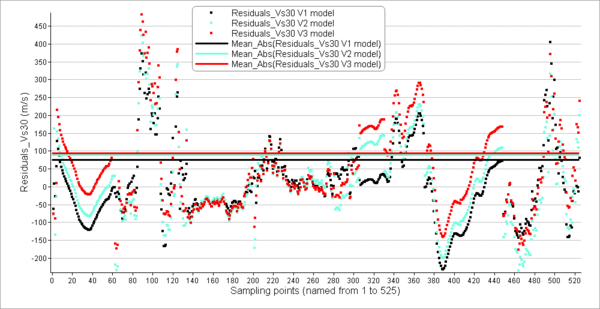
The specific correlation (Eq. (1)) can be performed without calculating , if information regarding geological units is not available (model V2). In order to assess the sensitivity of the results obtained by the different proxy methods, the residual obtained from Eq. (1) at the sampling points, including geological units (model V1), is compared with the calculated residual in model V2 and the residual of the Wald and Allen [27] correlation (model V3), using the corresponding coefficients associated with tectonically active regions. The deviation of the estimated values from the measured values of is the smallest one (74.7 m/s) with model V1. This value increases with model V2 (88.5 m/s) and takes the highest value (94.3 m/s) when the specific relationship found by Wald and Allen [27] (model V3) is used (Figure 15). This result highlights the importance of using site specific correlations including geological units.
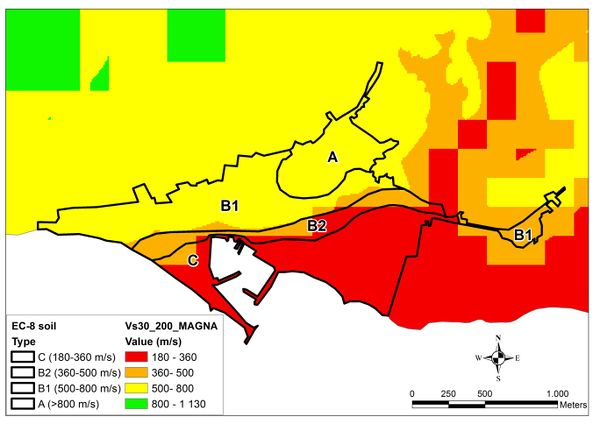
Soil classification according to EC8 [39] obtained by Martinez-Pagan et al. [54] and the proposed with SISMOTOOL (raster_vs30) using Eq. (1) is compared for the urban area of Adra (Figure 16). As can be seen, the predicted values from SISMOTOOL agree with the field measurements.
3.2 Shakemap
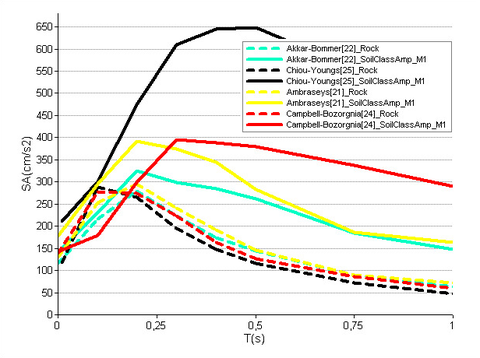
Morales et al. [55] carried out an exhaustive simulation of the PGA at rock due to this earthquake using empirical Green functions and they concluded that the PGA values may have reached 140 cm/s2 in the epicentral zone. Spectral accelerations at rock and soil obtained by SISMOTOOL for Adra town (site with higher acceleration) are compared in Figures 17 and 18 using different GMPEs and soil class amplification factors. Campbell and Bozorgnia [24] (139 cm/s2) is the GMPE which provides a PGA at rock closer to the obtained by Morales et al. [55], followed by Ambraseys et al. [21] (129 cm/s2), Chiou and Youngs [25] (117 cm/s2) and Akkar and Bommer [22] (116 cm/s2).
|
| Figure 17. Spectral acceleration for Adra town (site with higher acceleration), computed with SISMOTOOL using different GMPEs and soil class amplification factors according to M1 method |

|
| Figure 18. Spectral acceleration for Adra town (site with higher acceleration), computed with SISMOTOOL using different GMPEs and soil class amplification factors according to M2 method |
In order to compare with previously recorded earthquakes, a PGA at rock simulation has also been carried out for the 1994 Adra earthquake, described in Morales et al. [56] ( 4.9; focal depth 7 km; latitude: 36.56 N; longitude: 2.80 W; Adra fault). In this paper, authors stated that accelerograms were recorded at different IGN stations, whose PGA at rock data for the Adra station reached 30.5 cm/s2. SISMOTOOL estimated the PGA for the different GMPEs and the results are: (1) IGN-UPM [23], 8 cm/s2; (2) Akkar and Bommer [22], 25 cm/s2; (3) Ambraseys et al. [21], 32 cm/s2; (4) Campbell and Bozorgnia [24], 17 cm/s2; (5) Chiou and Youngs [25], 18 cm/s2.
So here, Ambraseys et al. [21] is the GMPE which provides a PGA closer to the recorded ground motion. Then, comparing both simulations is noted that one of the main sources of uncertainties in any seismic hazard or risk estimation comes from the GMPE chosen. Therefore, SISMOTOOL allows to the user to take into account these uncertainties by applying a logic tree.
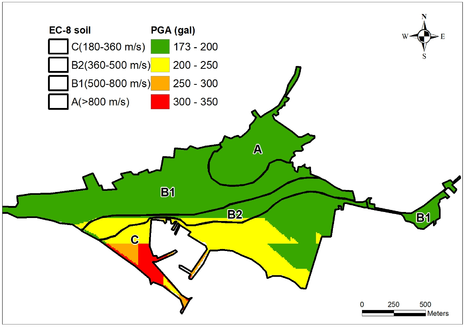
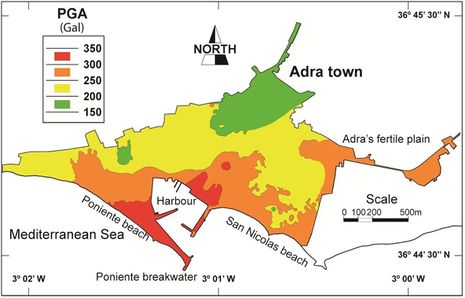
Figure 19 compares the distribution of PGA values obtained by SISMOTOOL for Adra town using the GMPE proposed by Campbell and Bozorgnia [24] and amplified by M2 method (Figure 19a), with the results obtained by Martinez-Pagan et al. [51] (Figure 19b). In the first case, the maximum PGA value is 302 cm/s2, while Martinez-Pagan et al. [51] estimates maximum PGA value of 350 cm/s2.
|
| (a) |
|
| (b) |
| Figure 19. Comparison of shakemaps: (a) obtained by SISMOTOOL; (b) from Martinez-Pagan et al. [51] |
3.3 Damage scenario
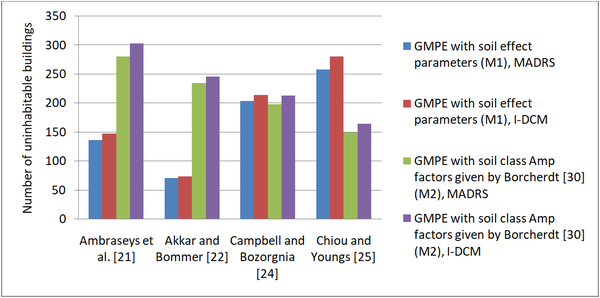
Uninhabitable buildings in Adra town were computed using SISMOTOOL for different GMPEs and with the analytical method (Figure 20). The performance point was obtained using the MADRS and I-DCM methods. The differences between MADRS and I-DCM methods are not very important (around a 5% to 10% higher with I-DCM); however, the use of the soil class amplification factors according to M2 instead of M1 method is responsible of a higher increase of the damage results except for the Chiou and Youngs [25] GMPE. This is due to the similar behaviour of the amplified ground motion (Figures 17 and 18).
|
| Figure 20. Uninhabitable buildings in Adra town (of 3,591 in total), computed by SISMOTOOL for the 1910 Adra earthquake |
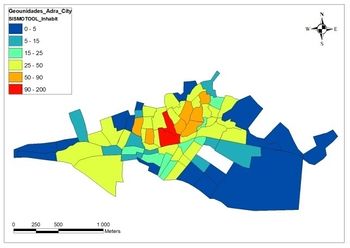
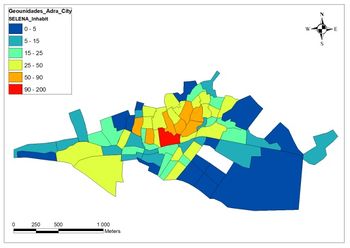
The comparison of uninhabitable buildings results (Figure 21) obtained by SISMOTOOL simulation for the amplified PGA proposed by Martinez-Pagan et al. [51] with a normalized elastic response spectrum according to Eurocode 8 [39] (Figure 21a), with respect to those obtained by Molina et al. [43] using the same spectrum and SELENA software (Figure 21b), shows good agreement between both tools, noting a deviation of 18% on the total uninhabitable buildings.
Additionally, a sensitivity analysis of uninhabitable buildings is carry out comparing the normalized spectra according to Eurocode 8 [39] and the specific spectral acceleration using different GMPEs and soil class amplification factors. In the first case, the design response spectrum at the ground surface is a uniform hazard spectra generated by multiplying the rock response spectrum with empirical factors to account the amplification of ground motion due to the underlying soil. On the second one, specific acceleration spectrum for earthquake scenario directly incorporate the amplification of ground motion due to underlying soil and provide spectral accelerations at the soil surface considering effects of individual sources. The number of uninhabitable buildings using the normalized spectrum (around 2,000, Figure 21) is much greater than the results calculated by specific elastic response spectra of each GMPE (Figure 20). This difference in an order of magnitude in the damage results cannot be justified only by the difference in the PGA used between both simulations (Figure 19).
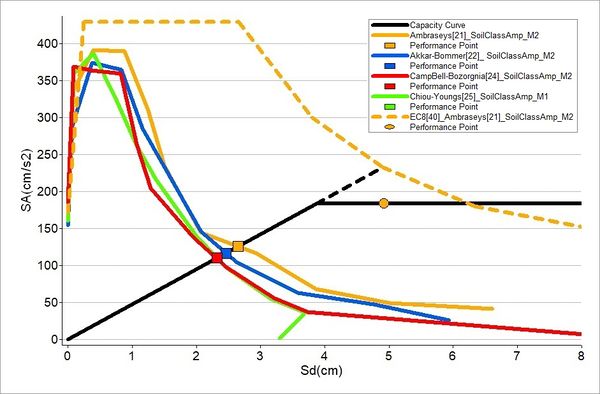
Figure 22 shows an example of calculating the performance points in both cases, and for a specific building in the city of Adra (with reinforced concrete typology, seven floors and year of construction 1998). Despite having used a normalized spectrum with Ambraseys et al. [21] PGA (172 cm/s2), and therefore lower than Martinez-Pagan et al. [51] (245 cm/s2), it can be seen that the use of normalized spectra of Eurocode 8 in the calculation of the estimated losses causes an overestimation of the spectral accelerations with respect to the specific spectra of the GMPEs. This result agrees with Haldar et al. [57] who also observed significant differences in the risk estimation for the code design spectra and the NGA model.
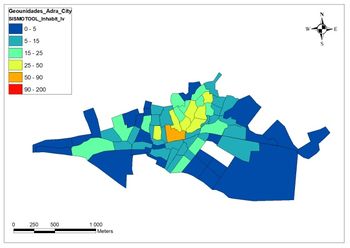
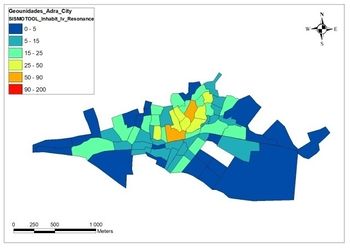
In order to analyze the influence of resonance effect on uninhabitable buildings, a comparison between the results obtained from empirical methods was made, using the specific elastic response spectra of GMPE according to Ambraseys et al. [21], soil class amplification factors by M2 method and vulnerability index with Milutinovic and Trendafiloski [32] modifiers, with and without resonance modifier (Figure 23). If the resonance modifier is not included, the total number of uninhabitable buildings is 868, while considering the resonance modifier the number of uninhabitable buildings increases by 14.4%. Figure 23 also identifies the areas where the soil-structures resonance is increasing the damage, allowing the users to adopt seismic management decisions.
|
| (a) |
|
| (b) |
| Figure 23. Comparison of uninhabitable buildings considering: (a) Without resonance modifier; (b) The resonance modifier |
4. Concluding remarks
The development of SISMOTOOL was due to the need of providing to Civil Protection with a complete and versatile tool for the Planning and Management of Seismic Emergencies. To achieve this objective, it has been considered important to find the following requirements: (1) The highest possible resolution in the results, e.g., damage computation at the building level, or maps with a 5-10 m pixel resolution; (2) High computing efficiency to obtain results allowing “real-time” decisions. For a small city as Adra, the computation time of the damage scenario is around 15 s, while at the regional level (e.g. the case of the province of Almería) is about 90 s; (3) The possibility of choosing different scales of calculation (from local to regional), which results in computing efficiency; (4) A friendly-user interface developed specifically for emergency managers allowing an easy interaction with other spatial databases.
Additionally, in the process of developing the previous objectives, a series of added-value tools were coded: (1) Regional processing of amplification of ground motion by geology (topographic slope as a proxy, including specific correlation) and by topographic effects (according to Eurocode 8 [26]), at a resolution (5 to 10 m); (2) Extraction and automated analysis of vulnerable elements (buildings). Furthermore, the user can define statistical parameters to automatically estimate the vulnerability (empirically or analytically) of each building; (3) Development of an own database of the spatial distribution of the population, to obtain the population affected (Homeless people, Human casualties).
The user can choose between several computation options: (1) Different ways of defining the basic parameters of the earthquake, choosing it from an included database and selection of the corresponding fault; (2) Design and edition of a database of possible earthquakes for the simulated scenario; (3) Different ground motion prediction models (GMPE) and ground motion amplification methods; (4) Damage estimation using the empirical method (EMS-98, Vulnerability Index [31]) or the analytical (MADRS, I-DCM [34]); (5) Possibility of choosing between the specific response spectrum predicted by the GMPE or the code design spectrum according to Eurocode 8 [39]; (6) Estimation of uninhabitable buildings, human casualties, population affected and structural economic losses.
All the scripts are accessible and adaptable through the VB.NET Visual Studio project, allowing users the development of new tools. Therefore, SISMOTOOL can be applied to any region of the world.
The analysis of unique vulnerable elements is not explicitly included in the current version of SISMOTOOL. However, essential facilities and heritage buildings are included in the current building database of the tool, and the user could define specific Vulnerability index [31] or Vulnerability functions [32] for them. In the case of lifelines (e.g. communication and industrial infrastructure) is planned to develop a specific module for the next version of SISMOTOOL that allows damage to be analyzed based on specific Fragility curves [32].
Using the mentioned options, a sensitivity analysis of the damage and losses results to the input parameters can carried out, allowing to quantify uncertainties. An example is shown for the city of Adra, pointing out the huge uncertainty related to the selection of the GMPE and the importance of using ground motion values from recorded earthquakes to choose one or more GMPE models and, besides, these uncertainties can be included in the damage and losses results using a logic tree.
SISMOTOOL incorporates the determination of the value of Vs30 from the topographic slope (proxy method [27,28]) in the estimation of site effects due to the soil class. This functionality is of great interest in the calculation of scenarios in regions where experimental measures are not available, or where it is intended to obtain a specific correlation better adapted to those measures. Moreover, topographic amplification can also be automatically deduced from that slope.
Additionally, the soil class amplification method is also a source of uncertainties. The ground motion amplification from geological empirical factors given by Borcherdt [30] provides, in general, higher amplified ground motion than the obtained with GMPE model with soil coefficients, with the exception of Chiou and Youngs [25].
One of the main advantages of this tool is the possibility of taking into consideration the soil-structures resonance using vulnerability modifiers. The results prove that the inclusion of the resonance modifier significantly increases the damage.
Finally, SISMOTOOL has been proven as an effective tool in the generation of useful results in a very short time for the Planning and Management of Seismic Emergencies and Territorial Planning.
Non-standard Abbreviations
Digital elevation model (DEM); Earthquake loss estimation (ELE); Database (DB); Ground motion prediction equation (GMPE); Next generation attenuation relationship (NGA); Building typology matrix (BTM); Resonance typology matrix (RTM); Improved displacement coefficient method (I-DCM); Modified acceleration-displacement response spectrum (MADRS).
Authors’ contributions
LF has conceived the idea of the tool, elaborated the necessary programming code and has drafted the manuscript. NM and MS have investigated the theoretical-analytical state of the art and have designed and revised the manuscript. All authors discussed the results and conclusions.
Code availability
SISMOTOOL has been developed by López F and the first beta version was available in 2019. SISMOTOOL has been encoded to be part of the toolbar of the software ArcGIS and works through an Add-in type customization. In this case, the VB.NET language and the ArcObjects software development kit integrated into a Microsoft Visual Studio programming environment have been used and the source code of the Visual Studio project is provided. Besides, any developer will have the possibility of modifying the tool or even including new functionalities just modifying the Visual Studio code.
Link to the code: https://drive.google.com/file/d/1ED6H56OAVwQvduTswVADrmoZkujt8Ir8/view?usp=sharing
Conflicts of interest
The authors declare that they have no known competing financial interests or personal relationships that could have appeared to influence the work reported in this paper.
Acknowledgments
The authors gratefully acknowledge the support provided by the Civil Protection Staff of Junta de Andalucía. We would like to thank Antonio Posadas Chinchilla for helping in the revision of the manuscript. We also thank anonymous referees for the constructive comments that significantly improved this article.
Funding: The Spanish Science and Innovation Ministry (Research Project CGL2011- 30187-C02-02) and CGL2016-77688-R (AEI/FEDER, UE) have funded this research.
References
[1] Grünthal G. European macroseismic scale. Cahiers du Centre Européen de Géodynamique et de Séismologie, Luxembourg, 27, pp. 99, 1998.
[2] Vidal F. Sismotectónica de la región Béticas-Mar de Albarán. Tesis Doctoral, Universidad de Granada, Granada, España, 1986.
[3] Navarro M., Sánchez F.J., Enomoto T., Vidal F., Rubio S. Relation between the predominant periods of soil ant the damage distribution after Mula 1999 earthquake. Sixth International Conference on Seismic Zonation (6ICSC), Palm Spring, California, USA, 12-15 November, 2000.
[4] Navarro M., Vidal F., Enomoto T., Alcalá F.J., Sánchez F.J., Abeki N. Analysis of site effects weightiness on RC building seismic response. The Adra (SE Spain) example. Earthquake Engineering and Structural Dynamics, 36:1363-1383, 2007.
[5] Navarro M., García-Jerez J.A., Alcalá F.J., Vidal F., Enomoto T. Local site effect microzonation of Lorca town (southern Spain). Bulletin of Earthquake Engineering, 12(5):1933-1959, 2014.
[6] Benito B., Capote R., Murphy P., Gaspar-Escribano J.M., Martinez-Diaz J.J., Tsige M. et al. An overview of the damaging and low magnitude Mw 4.8 La Paca earthquake on 29 January 2005: Context, seismotectonics, and seismic risk implications for southeast Spain. Bulletin of the Seismological Society of America, 97(3):671-690, 2007.
[7] García-Jerez A., Navarro M., Alcalá F.J., Luzon F., Pérez-Ruiz J.A., Enomoto T. et al. Shallow velocity structure using joint inversion of array and h/v spectral ratio of ambient noise: The case of Mula town (SE of Spain). Soil Dynamics and Earthquake Engineering, 27(10):907-919, 2007.
[8] Alguacil G., Vidal F., Navarro M., García-Jerez A., Pérez-Muelas J. Characterization of earthquake shaking severity in the town of Lorca during the May 11, 2011 event. Bulletin of Earthquake Engineering, 12(5):1889-1908, 2014.
[9] Dirección General de Protección Civil, Instituto Geográfico Nacional. Estimación rápida preliminar de daños potenciales en España por terremotos: Simulación de Escenarios Sísmicos (SES 2002), 2002.
[10] Federal Emergency Management Agency (FEMA). In: HAZUS®99: Earthquake loss estimation methodology. User Manual. Federal Emergency Management Agency, Washington DC, pp. 314, 1999.
[11] Anagnostopoulos S., Providakisb S., Salvaneschic P., Athanasopoulosa G., Bonacinad G. SEISMOCARE: An efficient GIS tool for scenario-type investigations of seismic risk of existing cities. Journal of Soil Dynamics and Earthquake Engineering, 28:73-78, 2008.
[12] Molina S., Lang D.H., Lindholm C.D. SELENA. An open-source tool for seismic risk and loss assessment using a logic tree computation procedure. Computers & Geosciences, 36:257-269, 2010.
[13] Cardona O.D., Ordaz M.G., Reinoso E., Yamín-Lacouture L.E., Barbat H.A. CAPRA - Comprehensive Approach to Probabilistic Risk Assessment: International initiative for risk management effectiveness. 15th World Conference on Earthquake Engineering, Lisboa, pp. 1-10, 2012.
[14] Sedan O., Negulescu C., Terrier M., Roulle A., Winter T., Bertil D. Armagedom. A tool for seismic risk assessment illustrated with applications. Journal of Earthquake Engineering, 17(2):253-281, 2013.
[15] Pagani M., Monelli D., Weatherill G., Danciu L., Crowley H., Silva V., Henshaw P., Butler L., Nastasi M., Panzeri L., Simionato M., Vigano D. OpenQuake engine: An open hazard (and risk) software for the global earthquake model. Seismological Research Letters, 85(3):692-702, 2014.
[16] [dataset] Instituto Geográfico Nacional (IGN). Catálogo de terremotos, 2019. Available online: https://www.ign.es/web/ign/portal/sis-catalogo-terremotos (accessed on 1 June 2019).
[17] [dataset] Instituto Geológico y Minero de España (IGME). Base de datos de fallas activas del cuaternario de Iberia (QAFI v.3), 2015. Available online: http://info.igme.es/QAFI (accessed on 1 June 2019).
[18] [dataset] IDEAndalucía. Modelo digital de elevaciones, 2010. Available online: http://www.ideandalucia.es (accessed on 1 June 2019).
[19] [dataset] Sede Electrónica del Catastro (SEC). Descarga de datos y cartografía, 2018. Available online: https://www.sedecatastro.gob.es (accessed on 1 June 2019).
[20] [dataset] Instituto Nacional de Estadística (INE). Secciones censales y padrón continuo, 2018. Available online: https://www.ine.es (accessed on 1 June 2019).
[21] Ambraseys N.N., Douglas J., Sarma S.K. Equations for the estimation of strong ground motions from shallow crustal earthquakes using data from Europe and the middle east: Horizontal peak ground acceleration and spectral acceleration. Bulletin of Earthquake Engineering, 3(1):1-53, 2005.
[22] Akkar S., Boomer J.J. Empirical equations for the prediction of PGA, PGV, and spectral accelerations in Europe, the Mediterranean region, and the middle east. Seismological Research Letters, 81:195-206, 2010.
[23] IGN-UPM Working Group. Actualización de mapas de peligrosidad sísmica de España 2012. Centro Nacional de Información Geográfica, Madrid, España, 2013.
[24] Campbell K.W., Bozorgnia Y. NGA-West2 Campbell-Bozorgnia ground motion model for the horizontal components of PGA, PGV, and 5%-damped elastic pseudo-acceleration response spectra for periods ranging from 0. 01 to 10 sec. Pacific Earthquake Engineering Research Center, University of California, Berkeley, USA, Report 2013/06, 2013.
[25] Chiou-Brian S.J., Youngs-Robert R. Update of the Chiou and Youngs NGA ground motion model for average horizontal component of peak ground motion and response spectra. Earthquake Spectra, 30(3):1117-1153, 2014.
[26] EN 1998-5: 2004. Eurocode 8: Design of structures for earthquake resistance. Part 5: Foundations, retaining structures and geotechnical aspects. European Committee for Standardization, 2004.
[27] Wald D.J., Allen T.I. Topographic slope as a proxy for seismic site conditions and amplification. Bulletin of the Seismological Society of America, 97:1379-1395, 2007.
[28] Wald D.J., McWhirter L., Thompson E., Hering A.S. A new strategy for developing Vs30 Maps. 4th IASPEI/IAEE International Symposium: Effects of Surface Geology on Seismic Motion, University of California, USA, August 2011.
[29] Borcherdt R.D. Estimates of site-dependent response spectra for design (methodology and justification). Earthquake Spectra, 10(4):617-653, 1994.
[30] Borcherdt R.D. Implications of next generation attenuation ground motion prediction equations for site coefficients used in earthquake resistant design. Earthquake Engineering & Structural Dynamics, 43:1343-1360, 2014.
[31] Giovinazzi S., Lagomarsino S. WP04: Guidelines for the implementation of the I level methodology for the vulnerability assessment of current buildings, Genova, Italy. RISK-UE project: An advanced approach to earthquake risk scenarios with applications to different European towns. Contract No.EVK4-CT-2000-00014. Institute of Earthquake Engineering and Engineering Seismology (IZIIS), 2002.
[32] Milutinovic Z.V., Trendafiloski G.S. WP04. Vulnerability of current buildings. RISK-UE project: An advanced approach to earthquake risk scenarios with applications to different European towns. Contract No.EVK4-CT-2000-00014. Institute of Earthquake Engineering and Engineering Seismology (IZIIS), 2003.
[33] Lagomarsino S., Giovinazzi S. Macroseismic and mechanical models for the vulnerability and damage assessment of current buildings. Bulletin of Earthquake Engineering, 4:415-443, 2006.
[34] Federal Emergency Management Agency (FEMA). In: HAZUS®MH 2.1: Multi-hazard loss estimation methodology maintenance. Technical and user manuals. Federal Emergency Management Agency, Washington DC, pp. 718, 2013.
[35] Federal Emergency Management Agency (FEMA). Improvement of non linear static seismic analysis procedures. Federal Emergency Management Agency, Washington DC, pp. 392, 2005.
[36] Coburn A., Spence R., Pomonis A. Factors determining human casualty levels in earthquakes: mortality prediction in building collapse. 10th World Conference on Earthquake Engineering, Balkema, Rotterdam, Holland, pp. 59-89, 1992.
[37] Wells D.L., Coppersmith K.J. New empirical relationships among magnitude, rupture length, rupture width and surface displacement. Bulletin of the Seismological Society of America, 84:974-1002, 1994.
[38] Bommer J., Stafford P.J. Selecting ground-motion models for site-specific PSHA: Adaptability versus applicability. Bulletin of the Seismological Society of America, 110(6):2801-2815, 2020.
[39] EN 1998-1: 2004. Eurocode 8: Design of structures for earthquake resistance. Part 1: General rules, seismic actions and rules for buildings. European Committee for Standardization, 2004.
[40] Crespo M.J., Benjumea B., Moratalla J.M., Lacoma L., Macau A., González A., Gutiérrez F., Stafford P.J. A proxy-based model for estimating in the Iberian Peninsula. Soil Dynamics and Earthquake Engineering, 155:107165, 2022.
[41] Navarro M., Oda Y., Martínez-Segura M., Enomoto T., García-Jerez A., López F. Vs30 structure of Murcia city (Southeast of Spain) derived from mini-array observations, MASW measurements and the topographic slope method. Proceeding of the 17th World Conference on Earthquake Engineering, Sendai, Japan, pp. 12, 2021.
[42] López F., Navarro M., Martínez-Pagán P., García-Jerez A., Pérez-Cuevas J., Enomoto T. Statistical analysis of the Vs30 structure of Almeria city (Southeast of Spain) inferred from topographic slope method. Proceeding of the online 14th SEGJ International Symposium, pp. 4, 2021.
[43] Molina S., Navarro M., Martínez-Pagán P., Pérez-Cuevas J., Vidal F., Navarro D., Agea-Medina N. Potential damage and losses in a repeat of the 1910 Adra (Southern Spain) earthquake. Natural Hazards, 92(3):1547-1571, 2018.
[44] Navarro M., Vidal F., Feriche M., Enomoto T., Sánchez F.J., Matsuda I. Expected ground RC buildings structures resonance phenomena in Granada city (Southern Spain). 13th World Conference on Earthquake Engineering, Paper No. 3308, Vancouver B.C., Canada, August 1-6, 2004.
[45] Oliveira C.S., Navarro M. Fundamental periods of vibration of RC buildings in Portugal from in-situ experimental and numerical techniques. Bulletin of Earthquake Engineering, 8:609-642, 2010.
[46] Gallipoli M.R., Mucciarelli M., Šket-Motnikar B., Zupanćić P., Gosar A., Prevolnik S., Herak M., Stipčević J., Herak D., Milutinović Z., Olumćeva T. Empirical estimates of dynamic parameters on a large set of European buildings. Bulletin of Earthquake Engineering, 8:593-607, 2010.
[47] Vidal F., Navarro M., Aranda C., Enomoto T. Changes in dynamic characteristics of Lorca RC buildings from pre- and post-earthquake ambient vibration data. Bulletin of Earthquake Engineering, 12(5):2095-2110, 2014.
[48] Sanz de Galdeano C., Lopez-Casado C., Delgado J., Peinado M.A. Shallow seismicity and active faults in the Betic Cordillera. A preliminary approach to seismic sources associated with specific faults. Tectonophysics, 248:293-302, 1995.
[49] García-Mayordomo J., Insua-Arévalo J.M., Martínez-Díaz J.J., Jiménez-Díaz A., Martín-Banda R., Martín-Alfageme S., Álvarez-Gómez J.A., Rodríguez-Peces M., Pérez-López R., Rodríguez-Pascua M.A., Masana E., Perea H., Martín-González F., Giner-Robles J., Nemser E.S., Cabral J. and the QAFI Compilers Working Group. The quaternary faults database of Iberia (QAFI v.2.0). [1] Journal of Iberian Geology, 38(1):285-302, 2012.
[50] Martínez-Pagán P., Navarro M., Pérez-Cuevas J., Alcalá F.J., García-Jerez A., Vidal F. Shear-wave velocity structure from MASW and SPAC methods: The case of Adra town, SE Spain. Near Surface Geophysics, 16:356-371, 2018.
[51] Martínez-Pagán P., Navarro M., Pérez-Cuevas J., García-Jerez A., Alcalá F.J., Vidal F. Application of detailed surface Vs structure data to simulated earthquake ground motion scenarios. The case of the 1910 Adra historic earthquake. SECED 2015 Conference: Earthquake Risk and Engineering towards a Resilient World. Cambridge, UK, July 2015.
[52] [dataset] Aldaya F., Baena J., Ewert K., Granados L.F., Pan-Arana T., Fernández-Luanco M.C., Ruiz P. Instituto Geológico y Minero de España (IGME). Mapa geológico de España a escala 1:50000 1983. Hoja 1057, Adra, 2003. Available online: http://info.igme.es/cartografiadigital/geologica (accessed on 1 June 2019).
[53] Alcalá-García F.J., Espinosa J., Navarro M., Sánchez F.J. Proposal of regional geologic division of Adra town (province of Almería). Application to the seismic zonation. Revista Sociedad Geológica España, 15:55–66, 2002.
[54] Martínez-Pagán P., Navarro M., Pérez-Cuevas J., Vidal F. Application of SPAC and MASW techniques to earthquake-shaking scenarios. The case of the 1993–1994 Adra earthquakes. Proccedings of the 21st European Meeting of Environmental and Engineering Geophysics-Near Surface Geosciences, Turin, Italy, pp. 1-5, 2015.
[55] Morales J., Benito B., Luján M. Expected ground motion in the south-east of Spain due to an earthquake in the epicentral area of the 1910 Adra earthquake. Journal of Seismology, 7(2):175-192, 2003.
[56] Morales J., Benito B., Luján M. Simulation of ground motion in south-east of Spain, using strong motion records and historical information. 12th European Conference on Earthquake Engineering, Paper reference 654, London, UK, September 2002.
[57] Haldar P., Singh Y., Lang D.H., Paul D.K. Comparison of seismic risk assessment based on macroseismic intensity and spectrum approaches using ‘SeisVARA’. Soil Dynamics and Earthquake Engineering, 48:267-281, 2013.
Document information
Published on 28/09/22
Accepted on 11/09/22
Submitted on 27/04/22
Volume 38, Issue 3, 2022
DOI: 10.23967/j.rimni.2022.09.007
Licence: CC BY-NC-SA license
Share this document
Keywords
claim authorship
Are you one of the authors of this document?
