Abstract
The quality of Global Navigation Satellite SystemsGlobal Navigation Satellite Systems Global Navigation Satellite Systems (Global Navigation Satellite Systems Global Navigation Satellite Systems Global Navigation Satellite Systems GNSS) data is one important factor for precise navigation and positioning by using GNSS technique. We proposed a new method to monitor GNSS single-frequency phase data quality by using high-rate epoch-by-epoch phase difference (EEPD). We analyzed the influence of ephemeris, carrier frequency (L1, L2 and L3) and latitude (high latitude, middle latitude and low latitude) on the phase data quality evaluation. It is concluded that the use of broadcast and final orbit has little effect on the phase data quality evaluation with EEPD. The broadcast ephemeris can be used while analyzing GNSS single-frequency data quality in real time. The results obtained by using L1, L2 and L3 observations are almost the same and the GNSS phase quality evaluation can be analyzed by using single-frequency data. The latitudes of stations have a great influence on the quality evaluation of phase data using EEPD. At the same time, Bernese software is used to analyze the feasibility and reliability of EEPD. The results obtained with EEPD are compared with those obtained by Bernese. The results by different methods show good consistency, which shows that EEPD can be reliably used to evaluate the GNSS data quality.
Keywords: GNSS, phase data quality, epoch-by-epoch phase difference
1. Introduction
The global navigation satellite system (GNSS) technique plays a key role in scientific research such as geodesy [1-3], atmosphere monitoring [4-5], early warning for tsunamis and earthquakes [5,6,7] in the past few years and other aspects [8-10]. With the rapid increase of continuous operational reference system (CORS) stations and International GNSS Service (IGS) stations in the world, the GNSS data quality is directly related to the construction of stations, the strategy of determining the orbital weighting and the coordinate precision [11,12]. Therefore, analyzing the quality of observational data is an important task to the wide applications of GNSS [13-18].
By analyzing the multipath effect, cycle slip and signal-to-noise ratio (SNR) of GPS data, it is found that more than 90% of GPS stations with better external environment have better data quality. Although the GNSS signal can be received in the sheltered environment, the data quality is poor [19,20]. By studying the visibility, multipath, SNR and positioning performance of Beidou data, it is found that the noise and multipath fluctuation of pseudo range measurement of geostationary orbit (GEO) satellites are less than 1.5 m, while the multipath variation of inclined geostationary orbit (IGSO) satellites and medium earth orbit (MEO) satellites is greater than that of GEOs. In addition, Beidou's absolute positioning accuracy and relative positioning accuracy are very close to those of GPS [21,22], and Beidou data quality is the same as GPS observation quality especially when the satellite altitude angle is small [23]. However, with the GNSS development, the above analysis methods cannot meet the needs of quality analysis of existing GNSS observation data [24]. These indicators do not accurately reflect the quality of the GNSS phase and are not directly related to positioning performance.
In order to effectively and directly analyze single-frequency phase data quality and assess GNSS positioning performance, we propose a high-rate epoch-by-epoch phase difference (EEPD) method to monitor GNSS single-frequency phase data quality. Several factors affecting data quality evaluation using EEPD are analyzed, such as ephemeris, carrier frequency and latitude. At the same time, Bernese software was used to verify the reliability of EEPD.
2. Methodology
High-rate data (like the sampling rate of 1s) can be observed using a user receiver. The phase to a satellite s at epoch is . The phase to the same satellite in the next epoch is . Then the observation equation can be expressed as
|
|
(1) |
|
|
(2) |
where and is the geometric distance between satellite s and receiver in epoch and ; is the ionospheric delay; is the tropospheric delay; is the receiver clock error; and are the receiver hardware and GNSS satellite hardware delay, respectively; is the satellite clock error; is the multipath effect; is the antenna phase center deviation; and are the residual errors. The coordinate of satellite s at epoch is . At epoch , the station coordinate is , and in which is the station displacement between adjacent epochs. In general, this displacement is very small.
The errors of high-rate GNSS data between adjacent two epochs such as clock error, tropospheric delay, ionospheric delay, hardware delay, multipath effect, integer ambiguity, antenna phase center deviation and their effects do not basically change. Eq. (1) subtracts Eq. (2) to get
|
|
(3) |
where . It can be seen from Eq. (3) that the phase difference of high-rate data epoch by epoch can effectively reduce or even eliminate the influence of common errors. Assuming that the phase precision is , the precision of the epoch-by-epoch phase difference is
|
|
(4) |
The initial coordinate of station is . When the station has a small displacement between adjacent epochs, then Eq. (3) is expanded by the Taylor series expansion at to get the linear form as
|
|
(5) |
where is the geometric distance from the station of epoch to satellite s of epoch . When the number of GNSS satellites observed in adjacent epochs is equal to or greater than 3, the position change between adjacent epochs can be accurately estimated from single-frequency phase observations. Eq. (5) can effectively attenuate or remove most of errors associated with GNSS satellites and user receiver. For continuous GNSS data, the coordinate difference time series can reflect the single-frequency phase quality for assessing positioning performance. For the high-rate GNSS phases at the same station, the clock error, atmospheric delay, hardware delay, multipath effect, tide, and antenna phase center deviation and their variation can be effectively reduced or even eliminated by epoch-by-epoch phase difference, especially the trouble of ambiguity resolution can be avoided. At the same time, can also reduce the influence of GNSS ephemeris accuracy, and the broadcast ephemeris can meet the solution requirements, which can realize real-time quality evaluation of single-frequency phase data.
Supposing that satellites are simultaneously observed in adjacent epochs and , Eq. (5) is expressed in the matrix form as
|
|
(6) |
where , , , .
In general, . Therefore, the least square method is used to solve Eq. (6) to get the optimal estimate of . Eq. (6) can eliminate common errors related to GNSS satellites and stations. Accurate results can be obtained by single-frequency phase data. The least squares solution of is
|
|
(7) |
with the covariance matrix as
|
|
(8) |
in which the unit weight variance is
|
|
(9) |
where is the weight matrix. The initial weight is , and in the iterative process where is one given constant.
According to Eq. (7), the coordinate difference time series , and of the station in adjacent epochs are obtained. Then the average value and standard deviation (, , , , , ) of each time series are obtained. The upper bound and the lower bound can be calculated by
|
|
(10) |
|
|
(11) |
where is a constant, in this study; , and are considered to be abnormal values if they are greater than the corresponding upper bound value or less than the corresponding lower bound value. anomalous solutions can be obtained from continuous high-rate observations of single frequency GNSS technique. The continuous observation anomaly percentage (AP) is defined as
|
|
(12) |
where is the number of observation epochs.
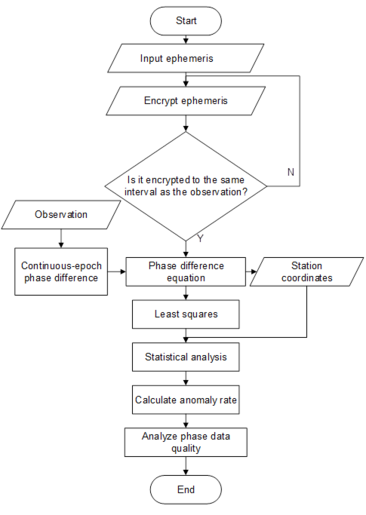
The algorithm flow of EEPD is shown in Figure 1.
|
| Figure 1. Algorithm flowchart of data quality evaluation by EEPD |
3. Experiment and analysis
In order to verify the reliability of EEPD, L1 data and the L3 data of HOFN (IGS station) are taken as examples. HOFN’s latitude and longitude are -15°6′55″ and 64°16′2″, respectively. The sampling rate of GPS data was 1 s, and the collecting data time was October 3, 2014. The high-rate data is available at ftp://cddis.gsfc.nasa.gov/highrate/2014/276/14d/. The time taken in this experiment is UTC 4-8h, October 3, 2014. Coordinate differences are solved for each epoch with Eq. (7). The results obtained by EEPD are compared with the results of single-epoch precise point positioning (PPP) [25] using Bernese software. The time series results of coordinate difference in the directions north (N), directions east (E) and directions up (U) between adjacent epochs of 4-8 hours are counted.
3.1 Comparison of phase difference results of L1 data
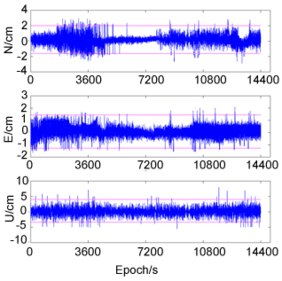
Using L1 data, the station coordinates of each epoch are estimated by PPP of Bernese software, and the three-dimensional (N, E and U) coordinate difference between adjacent epochs under continuous epochs is calculated, as shown in Figure 2(a). At the same time, the coordinate difference between adjacent epochs is estimated by EEPD (Figure 2(b)).
|
|
| (a) | (b) |
| Figure 2. Coordinate difference time series using L1 data. (a) Coordinate difference time series by PPP of Bernese. (b) Coordinate difference time series by EEPD | |
From Figure 2 and Table 1, we can find that the coordinate difference time series in three directions obtained by EEPD and PPP are similar. The outliers are mainly concentrated in the start and end periods.
Table 1 shows the results obtained by PPP are more stable in direction N. The normal solution range is -0.98 cm~1.12 cm with 212 outliers. The normal solution range of the coordinate difference obtained by EEPD is -1.85 cm~2.01 cm. It has a total of 252 outliers.
| Statistical item | Max (cm) | Min (cm) | Mean (cm) | STD (cm) | UB (cm) | LB (cm) | Number of abnormal solutions | AP (%) | |
|---|---|---|---|---|---|---|---|---|---|
| N | PPP | 1.88 | -2.22 | 0.07 | 0.42 | 1.12 | -0.98 | 235 | 1.63 |
| EEPD | 2.51 | -2.85 | 0.08 | 0.77 | 2.01 | -1.85 | 252 | 1.75 | |
| E | PPP | 0.9 | -1.32 | 0.003 | 0.27 | 0.68 | -0.67 | 231 | 1.61 |
| EEPD | 2.14 | -1.86 | 0.08 | 0.49 | 1.3 | -1.15 | 247 | 1.72 | |
| U | PPP | 3.25 | -4.95 | -0.03 | 0.94 | 2.37 | -2.31 | 187 | 1.31 |
| EEPD | 6.72 | -5.89 | 0.13 | 1.86 | 4.78 | -4.52 | 206 | 1.43 | |
For the E direction, the results obtained by PPP are more stable. The normal solution range is -0.67 cm~0.68 cm, and 222 results are considered to be outliers. The normal solution range of the coordinate difference obtained by EEPD is -1.15 cm~1.30 cm, and 247 results are considered to be outliers.
For the U direction, the results obtained by PPP are more stable. The normal solution range is -2.31 cm~2.37 cm, and 145 results are considered to be outliers. The normal solution range of the coordinate difference obtained by EEPD is -4.52 cm~4.78 cm, and 206 results are considered to be outliers.
3.2 Comparison of phase difference results of L3 data
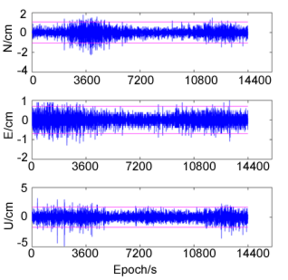
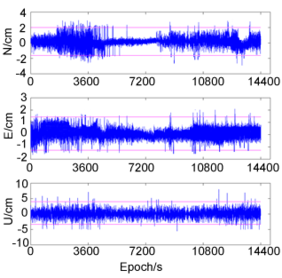
We use the same method as the above section to process L3 data and get results (Figure 3).
|
|
| (a) | (b) |
| Figure 3. Coordinate difference time series using L3 data. (a) Coordinate difference time series by PPP. (b) Coordinate difference time series by EEPD | |
| Statistical item | Max (cm) | Min (cm) | Mean (cm) | STD (cm) | UB (cm) | LB (cm) | Number of abnormal solutions | AP (%) | |
|---|---|---|---|---|---|---|---|---|---|
| N | PPP | 1.83 | -2.32 | 0.07 | 0.41 | 1.07 | -1.1 | 278 | 1.93 |
| EEPD | 2.47 | -2.88 | 0.09 | 0.77 | 2.03 | -1.84 | 302 | 2.1 | |
| E | PPP | 0.97 | -1.31 | 0.03 | 0.29 | 0.75 | -0.7 | 247 | 1.72 |
| EEPD | 2.12 | -1.81 | 0.08 | 0.48 | 1.29 | -1.13 | 261 | 1.81 | |
| U | PPP | 3.25 | -4.91 | -0.02 | 0.93 | 2.34 | -2.3 | 185 | 1.28 |
| EEPD | 6.72 | -5.89 | 0.13 | 1.86 | 4.78 | -4.52 | 206 | 1.43 | |
It can be seen from Figure 3 and Table 2 that for the N direction, the coordinate difference time series obtained by PPP fluctuates greatly in the vicinity of 2000 s-5000 s and 12000 s-14400 s, and the number of abnormal solutions is 278, accounting for 1.93% of the total epochs. The coordinate difference time series obtained by EEPD fluctuates greatly in 2000 s-5000 s and 1000 s-14400 s, and 302 values are abnormal values, accounting for 2.10% of the total.
For the E direction, the results obtained using PPP are unstable in the initial 5000 s, then tend to be stable for a period of time, and the instability occurs again around 9000 s. The results obtained by EEPD are similar to those obtained by PPP, but the outliers are more than those obtained by PPP. In addition, the results obtained using PPP are considered to be normal solutions in the range of -0.70 cm to 0.75 cm, and there are 278 abnormal solutions, accounting for 1.93% of the total. The normal solution range obtained by EEPD is -1.13 cm~1.29 cm, and there are 302 abnormal solutions, accounting for 2.10% of the total.
For the U direction, the trend of the coordinate difference obtained by using these two methods is relatively consistent, and the abnormal solutions are mainly concentrated in the initial stage and the final stage. The results obtained using PPP are considered to be normal solutions in the range of -2.30 cm~2.34 cm, and there are 185 abnormal solutions, accounting for 1.28% of the total. The normal solution range obtained by EEPD is -4.55 cm~4.76 cm, and there are 302 abnormal solutions, accounting for 1.93% of the total.
4. Discussion
In order to study the influence of different factors on the quality of phase data, the effects of different ephemeris files, different carrier frequencies and different latitudes of stations on the quality of phase data are analyzed respectively.
4.1 Effect of ephemeris on phase data quality
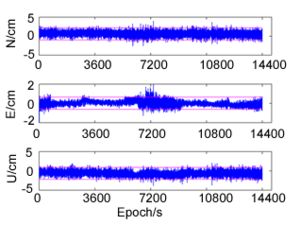
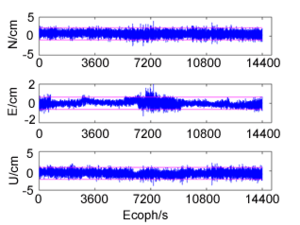
In order to compare the influence of different ephemeris on the EEPD solutions, the same station (low latitude KOKB station), the same sampling rate (1s), the same collecting time (0-4h, October 3, 2014), and the same frequency (L1 frequency) are used in this case study. Broadcast, ultra rapid orbit, rapid orbit, and final orbit are used to process L1 GPS data with EEPD in Figure 1. The results are shown in Figure 4 and Table 3.
|

|
| (a) | (b) |
|
|
| (c) | (d) |
| Figure 4. Coordinate difference time series using different ephemeris. (a) Broadcast. (b) Ultra rapid orbit. (c) Rapid orbit. (d) Final orbit, respectively | |
| Orbit | Directions | Max (cm) | Min (cm) | Mean (cm) | STD (cm) | UB (cm) | LB (cm) | Number of abnormal solutions | AP (%) |
|---|---|---|---|---|---|---|---|---|---|
| Broadcast | N | 3.92 | -2.6 | 0.61 | 0.63 | 2.19 | -0.97 | 240 | 1.67 |
| E | 2.00 | -1.95 | 0.02 | 0.25 | 0.65 | -0.61 | 303 | 2.1 | |
| U | 2.04 | -3.77 | -0.64 | 0.62 | 0.91 | -2.19 | 215 | 1.49 | |
| Ultra rapid orbit | N | 3.93 | -2.57 | 0.61 | 0.63 | 2.2 | -0.97 | 239 | 1.66 |
| E | 1.99 | -1.25 | 0.02 | 0.25 | 0.65 | -0.62 | 309 | 2.15 | |
| U | 2.03 | -3.81 | -0.63 | 0.62 | 0.91 | -2.18 | 210 | 1.46 | |
| Rapid orbit | N | 3.94 | -2.56 | 0.61 | 0.63 | 2.2 | -0.97 | 242 | 1.68 |
| E | 2.01 | -1.28 | 0.02 | 0.25 | 0.65 | -0.62 | 294 | 2.04 | |
| U | 2.05 | -3.79 | -0.63 | 0.62 | 0.91 | -2.18 | 210 | 1.46 | |
| Final orbit | N | 3.92 | -2.58 | 0.61 | 0.63 | 2.2 | -0.97 | 242 | 1.68 |
| E | 2.00 | -1.26 | 0.02 | 0.25 | 0.65 | -0.61 | 294 | 2.04 | |
| U | 2.06 | -3.77 | -0.64 | 0.62 | 0.91 | -2.19 | 210 | 1.46 |
It can be seen from Figure 4 and Table 3 that the N direction fluctuates within ±5 cm and the E direction changes within ±2 cm. After about 20 min of initialization, the coordinate difference change is small and the coordinate difference time series is relatively stable. The U direction also changes within ±5 cm. The fluctuation trends in the N, E and U directions are the same, and do not change depending on the ephemeris used. It can be seen from Table 3 that the coordinate differences calculated by different ephemeris are very close. The number of anomalies in each direction and the anomaly ratio are also small.
In summary, the different ephemeris has little effect on the evaluation of phase data quality using EEPD. So the broadcast can be used instead of the final orbit to monitor the quality of the data in real time.
4.2 Influence of carrier frequency
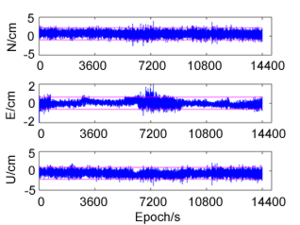
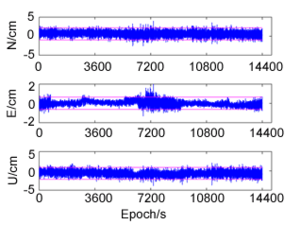
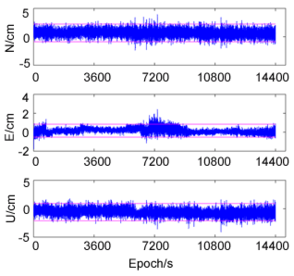
In order to compare the effects of different frequencies on phase data quality, the same station (low latitude KOKB station), the same sampling rate (1s), the same observation time (0-4h, October 3, 2014), and the same satellite ephemeris file (broadcast ephemeris file) are used in the case study. The influence of L1, L2 and L3 on phase data quality is studied with EEPD. The analysis results of the three directions (N, E and U) of KOKB are shown in Figure 5 and Table 4.
|
|
| (a) | (b) |
| |
| (c) | |
| Figure 5. Comparison of phase data quality using different frequencies. (a) L1. (b) L2. (c) L3, respectively | |
| Frequency | Directions | Max (cm) | Min (cm) | Mean (cm) | STD (cm) | UB (cm) | LB (cm) | Number of abnormal solutions | AP (%) |
|---|---|---|---|---|---|---|---|---|---|
| L1 | N | 3.92 | -2.6 | 0.61 | 0.63 | 2.19 | -0.97 | 240 | 1.67 |
| E | 2.00 | -1.95 | 0.02 | 0.25 | 0.65 | -0.61 | 303 | 2.1 | |
| U | 2.04 | -3.77 | -0.64 | 0.62 | 0.91 | -2.19 | 215 | 1.49 | |
| L2 | N | 3.39 | -2.24 | 0.6 | 0.54 | 2.2 | -0.97 | 242 | 1.68 |
| E | 2.38 | -1.28 | 0.01 | 0.25 | 0.65 | -0.61 | 302 | 2.1 | |
| U | 2.1 | -3.8 | -0.64 | 0.65 | 0.91 | -2.18 | 213 | 1.48 | |
| L3 | N | 3.91 | -2.58 | 0.61 | 0.63 | 2.21 | -0.97 | 242 | 1.68 |
| E | 2.4 | -1.96 | 0.02 | 0.23 | 0.65 | -0.62 | 315 | 2.19 | |
| U | 1.97 | -3.77 | -0.64 | 0.62 | 0.91 | -2.18 | 215 | 1.49 |
It can be seen from Figure 5 and Table 4 that the results obtained from different carrier frequencies in the same direction are basically the same. The N and U directions change within ±5 cm, and the fluctuation is relatively flat, indicating that the phase difference in both directions is relatively stable. The E direction changes within ±2 cm as a whole. After about 20 min of initialization, the coordinate difference change is small, and then becomes larger in the vicinity of 2h, and then tends to be stable. It can also be seen from the statistical results in Table 4 that the values of the phase differences obtained by EEPD are also very close.
It can be fully explained that there is no substantial difference in the evaluation of phase data quality using L1, L2 and L3 data by EEPD, and phase data quality analysis can be directly performed using single frequency data.
4.3 Effect of latitude on phase data quality
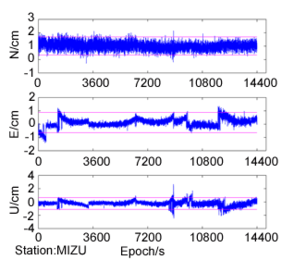
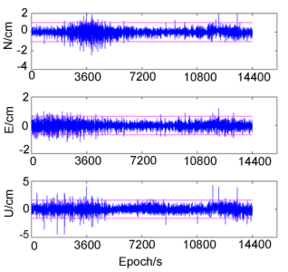
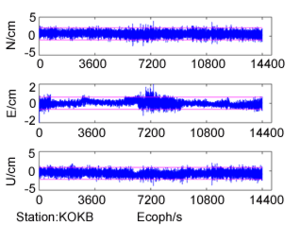
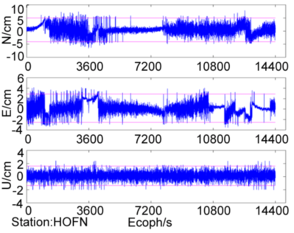
In order to verify the influence of stations at different latitudes on the phase data quality by EEPD, the same variables are guaranteed to be the same sampling rate (1s), the same observation time (0-4h on October 3, 2014), the same frequency (L1) and the same satellite ephemeris are used. One low-latitude station (KOKB), one mid-latitude station (MIZU) and one high-latitude station (HOFN) are used to study the effects on phase data quality. The results by EEPD are shown in Figure 6 and Table 5.
|
|
| (a) | (b) |
| |
| (c) | |
| Figure 6. Comparison of phase data quality of stations at different latitudes. (a) KOKB. (b) MIZU. (c) HOFN | |
| Site | Directions | Max (cm) | Min (cm) | Mean (cm) | STD (cm) | UB (cm) | LB (cm) | Number of abnormal solutions | AP (%) |
|---|---|---|---|---|---|---|---|---|---|
| KOKB | N | 3.92 | -2.6 | 0.61 | 0.63 | 2.19 | -0.97 | 240 | 1.67 |
| E | 2.00 | -1.95 | 0.02 | 0.25 | 0.65 | -0.61 | 303 | 2.1 | |
| U | 2.04 | -3.77 | -0.64 | 0.62 | 0.91 | -2.19 | 215 | 1.49 | |
| MIZU | N | 2.13 | -0.27 | 1.02 | 0.27 | 1.69 | 0.34 | 193 | 1.34 |
| E | 1.33 | -1.4 | 0.12 | 0.31 | 0.88 | -0.64 | 295 | 2.05 | |
| U | 2.65 | -2.44 | -0.24 | 0.35 | 0.65 | -1.12 | 352 | 2.44 | |
| HOFN | N | 7.21 | -6.84 | 0.12 | 1.94 | 4.98 | -4.75 | 218 | 1.51 |
| E | 4.34 | -3.85 | 0.05 | 1.97 | 2.41 | -2.32 | 196 | 1.36 | |
| U | 2.45 | -1.98 | 0.004 | 0.07 | 0.18 | -0.17 | 244 | 1.69 |
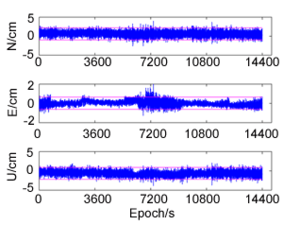
As can be seen from Figure 6 and Table 5, the effect of stations at different latitudes using the same ephemeris file and frequency on the quality evaluation of phase data is different. For the low-latitude KOKB station, the coordinate difference time series of the N direction and the U direction are relatively smooth. The coordinate difference time series in the N direction is considered to be the normal value within the range of -0.97 cm to 2.19 cm, and the abnormal ratio is 1.67%. The coordinate difference time series in the U direction is considered to be the normal value within the range of -2.19 cm~0.91 cm, and the abnormal ratio is 1.47%. The E direction fluctuates greatly near 7200s and the phase is unstable, but the overall variation range of the coordinate difference time series in this direction is smaller than that in the other two directions. The coordinate difference time series between -0.61 cm and 0.65 cm is considered to be normal and the abnormal ratio is 2.10%.
For the mid-latitude MIZU station, N direction has less abrupt values than E direction and U direction. The normal coordinate difference within the range of 0.34 cm to 0.61 cm, and the abnormal rate is 1.34%. For E direction and U direction, the variation trend of coordinate difference time series is similar, and there are larger abrupt values near 1200 s, 3400 s, 6000 s, 9000 s, and 11800 s. The normal coordinate difference in E direction fluctuates within - 0.64 cm ~ 0.88 cm, and the abnormal ratio is 2.05%; the normal coordinate difference in U direction fluctuates within - 1.12 cm ~ 0.65 cm, and the abnormal ratio is 2.44%.
For the high-latitude HOFN station, the coordinate difference fluctuation range in the N direction is large, and the value changed within -4.75 cm to 4.98 cm is considered to be normal, and the abnormal ratio is 1.51%. The phase data quality in the E direction is poor. The value changed from -2.32 cm to 2.41 cm is considered to be normal, and the abnormal ratio is 1.36%. The coordinate difference in the U direction is relatively smooth, and the coordinate difference between -0.17 cm and 0.18 cm is considered to be normal. The anomaly ratio is 1.69%.
5. Conclusion
In order to analyze the GNSS data quality and its applications, we propose a new method to evaluate the phase data quality by using the EEPD. The method can efficiently remove the effects of GNSS orbit errors, atmospheric delay, multipath effect, clock error and ambiguity when evaluate the phase data quality. GNSS data of single frequency and linear combining frequency can be evaluated by analyzing the time series of coordinate differences epoch by epoch.
The results of phase quality evaluation with EEPD by using broadcast, ultra rapid orbit, rapid orbit and final orbit are basically consistent. The broadcast ephemeris can be used while analyzing GNSS data quality in real time. By analyzing the influence of different frequency carriers (L1, L2 and L3) on the coordinate difference time series epoch by epoch, we find that the results obtained by using L1, L2 and L3 observations are almost the same. It is concluded that the GNSS phase quality evaluation can be analyzed by using single-frequency data. By analyzing the influence of different latitude (high latitudes, middle latitudes, low latitudes) stations on the time series of coordinate difference between adjacent epochs, it is found that the latitude of stations has an influence on the quality evaluation of phase data.
We also compared the results obtained with EEPD and the Bernese software, and found that it has good consistency with the two methods above. The results determined with these two methods are consistent, which shows that the new method is reliable to evaluate the GNSS data quality in real time.
Acknowledgments
We are very grateful to IGS for providing GNSS data. This study is supported by the National Natural Science Foundation of China (grant Nos. 41774001, 41774021, 41374009, 41874091), the Special Project of Basic Science and Technology of China (grant No. 2015FY310200), and the SDUST Research Fund (grant No. 2014TDJH101).
References
[1] Zhang X., Andersen O.B. Surface ice flow velocity and tide retrieval of the Amery ice shelf using precise point positioning. J. Geod., 80(4):171–176, 2006. https://doi.org/10.1007/s00190-006-0062-8.
[2] Geng J., Teferle F., Meng X., Dodson A. Kinematic precise point positioning at remote marine platforms. GPS Solut., 14(4):343–350, 2010. https://doi.org/10.1007/s10291-009-0157-9.
[3] Li X., Zus F., Lu C., Ning T., Ge M., Wickert J., Schuh H. Retrieving of atmospheric parameters from multi-GNSS in real time: validation with water vapor radiometer and numerical weather model. J. Geophys. Res. Atmos., 120:7189–7204, 2015a. https://doi.org/10.1002/2015JD023454.
[4] Rocken C., Johnson J., Hove T. V., Iwabuchi T. Atmospheric water vapor and geoid measurements in the open ocean with GPS. Geophys. Res. Lett., 32:L12813, 2005. https://doi.org/10.1029/2005GL022573.
[5] Li X., Ge M., Zhang X., Zhang Y., Guo B., Wang R., Klotz J., Wickert J. Real-time high-rate co-seismic displacement from ambiguity-fixed precise point positioning: application to earthquake early warning. Geophys. Res. Lett., 40(2):295–300, 2013. https://doi.org/10.1002/grl.50138.
[6] Xu P., Shi C., Fang R., Niu X., Zhang Q., Yanagidani T. High-rate precise point positioning (PPP) to measure seismic wave motions: an experimental comparison of GPS PPP with inertial measurement units. J. Geod., 87(4):361–372, 2013. https://doi.org/10.1007/s00190-012-0606-z.
[7] Guo J., Li W., Yu H., Zhao C., Kong Q. Impending ionospheric anomaly preceding the Iquique Mw8.2 earthquake in Chile on 2014 April 1. Geophys. J. Int., 203(3):1461-1470, 2015. https://doi.org/10.1093/gji/ggv376.
[8] Guo J., Yuan Y., Kong Q., Li G., Wang F. Deformation caused by 2011 eastern Japan great earthquake monitored by GPS single-epoch precise point positioning technique. Appl. Geophys., 9(4):483-493, 2012. https://doi.org/10.1007/s11770-012-0360-2.
[9] Jeongrae K., Young J.L. Using ionospheric corrections from the space-based augmentation systems for low earth orbiting satellites. GPS Solut., 19(3):423-431, 2015. https://doi.org/10.1007/s10291-014-0402-8.
[10] Li W., Yue J., Wu S., Li Z., Bi J., Zhang K. Ionospheric responses to typhoons in Australia during 2005-2014 using GNSS and FORMOSAT-3/COSMIC measurements. GPS Solut., 22(3):61, 2018. https://doi.org/10.1007/s10291-018-0722-1.
[11] Kim M.C., Lee J.Y. Data quality analysis of Korean GPS reference stations using comprehensive quality check algorithm. Journal of the Korean Society for Aeronautical and Space Sciences, 41(9):689-699, 2013. https://doi.org/10.5139/JKSAS.2013.41.9.689.
[12] Herring T.A., Melbourne T.I., Murray M.H., Floyd M.A., Szeliga W.M., King R.W., Phillips D.A., Puskas C.M., Santillan M., Wang L. Plate boundary observatory and related networks: GPS data analysis methods and geodetic products. Rev. of Geophys., 54(4):759-808, 2016. https://doi.org/10.1002/2016RG000529.
[13] Comp C.J., Axelrad P. Adaptive SNR-based carrier phase multipath mitigation technique. IEEE Trans. Aerosp. Electron. Syst., 34(1):264–276, 1998. https://doi.org/10.1109/7.640284.
[14] Park K.D., Nerem R.S., Schenewerk M.S., Davis J.L. Site-specific multipath characteristics of global IGS and CORS GPS sites. J. Geodesy., 77(12):799-803, 2004. https://doi.org/10.1007/s00190-003-0359-9.
[15] Fath-Allah T.F. A new approach for cycle slip repairing using GPS single frequency data. World Applied Sciences Journal, 3(8):315-325, 2010.
[16] Liu Z. A new automated cycle slip detection and repair method for a single dual-frequency GPS receiver. J. Geodesy., 85(3):171-183, 2011. https://doi.org/10.1007/s00190-010-0426-y.
[17] Dai Z. MATLAB software for GPS cycle-slip processing. GPS Solut., 16(2):267-272, 2012. https://doi.org/10.1007/s10291-011-0249-1.
[18] Zhou M., Guo J., Shen Y., Kong Q., Yuan J. Extraction of common mode errors of GNSS coordinate time series based on multi-channel singular spectrum analysis. Chin. J. Geophys. (in Chinese), 61(11):4383-4395, 2018. https://doi.org/ 10.6038/cjg2018L0710.
[19] Li J, Wang J., Xiong X., Xu H. Quality checking and analysis on GPS data in Northeast Asia. Geomatics and Information Science of Wuhan University, 31(3):209-212, 2006. https://doi.org/10.13203/j.whugis2006.03.005.
[20] Ji S., Chen W., Weng D., Wang Z., Ding X. A study on cycle slip detection and correction in case of ionospheric scintillation. Adv. Space Res., 51(5):742–753, 2013. https://doi.org/10.1016/j.asr.2012.10.012.
[21] Xu Y., Ji S. Data quality assessment and the positioning performance analysis of BeiDou in Hong Kong. Surv. Rev., 47(345):446-457, 2015. https://doi.org/10.1179/1752270615Y.0000000005.
[22] Bramanto B., Gumilar I., Abidin H., Prijatna K., Fajar S. Assessment of the BeiDou data quality and the positioning performance: A perspective from Bandung, Indonesia. Journal of Aeronautics, Astronautics and Aviation, 49(2):111-123, 2017. https://doi.org/ 10.6125/17-0202-929.
[23] Zhang X., Ding L. Quality analysis of the second generation Compass observables and stochastic model refining. Geomatics and Information Science of Wuhan University, 38(7):832-836, 2013. https://doi.org/10.13203/j.whugis2013.07.019.
[24] Yang Y. Progress, contribution and challenges of Compass/Beidou Satellite Navigation System. Acta Geodaetica et Cartographica Sinica, 39(1):1-6, 2010.
[25] Guo J., Dong Z., Tan Z., Liu X., Chen C., Hwang C. A crossover adjustment for improving sea surface height mapping from in-situ high rate ship-borne GNSS data using PPP technique. Cont. Shelf Res., 125:54-60, 2016. https://doi.org/10.1016/j.csr.2016.07.002.
Document information
Published on 09/09/20
Accepted on 05/09/20
Submitted on 28/01/20
Volume 36, Issue 3, 2020
DOI: 10.23967/j.rimni.2020.09.003
Licence: CC BY-NC-SA license
Share this document
claim authorship
Are you one of the authors of this document?
