Abstract
Influencing factors, and variations and trends of Antarctic ozone hole in recent decades are analyzed, and sudden change processes of ozone at Zhongshan station and the effect of atmospheric dynamic processes on ozone changes are also discussed by using the satellite ozone data and the ground-measured ozone data at two Antarctic stations as well as the NCEP/NCAR reanalysis data. The results show that equivalent effective stratospheric chlorine (EESC) and stratospheric temperature are two important factors influencing the ozone hole. The column ozone at Zhongshan and Syowa stations is significantly related with EESC and stratospheric temperature, which means that even though the two stations are both located on the edge of the ozone hole, EESC and stratospheric temperature still played a very important role in column ozone changes, and mean while verifies that EESC is applicable on the coast of east Antarctic continent. Decadal changes in EESC are similar with those of the ozone hole, and inter-annual variations of ozone are closely related with stratospheric temperature. Based on the relation of EESC and ozone hole size, it can be projected that the ozone hole size will gradually reduce to the 1980’s level from 2010 to around 2070. Of course there might exist many uncertainties in the projection, which therefore needs to be further studied.
Keywords
Antarctic ozone hole ; equivalent effective stratospheric chlorine (EESC) ; stratospheric temperature ; trend
1. Introduction
Since the mid-1980s, scientists in Japan and the United Kingdom [ Chubachi, 1984 ; Farman et al ., 1985 ] have successively found that the total amount of atmospheric ozone observed in the Antarctic station in spring (from September to November) was decreased by 30%–40% compared with the value ten years ago; later, the American scientists confirmed the existence of ozone hole over the Antarctic in spring with the satellite data [ Stolarski et al., 1986 ]; since then, the observation of the ozone hole and the research of its formation mechanism have become hot issues at home and abroad. From the space point of view, the ozone hole over the Antarctic appears to the south of 60°S. It is the low-value area of ozone within the polar vortex and the high-value area outside the vortex. From the time point of view, the total amount of ozone over the Antarctic drops suddenly and dramatically during September and October each year, forming a low-value period. The existing main research [ Lu et al., 1997 ] hold that, the Antarctic ozone hole is the result of the joint action of the atmospheric dynamics and the atmospheric chemical processes. The reason for a large number of ozone depletion is closely related to the unique geography and climatic environment in the Antarctic as well as the atmospheric circulation, particularly the polar vortex activities in the stratosphere. It is unable to fully explain the formation of the ozone hole in the Antarctic with the atmospheric dynamics, solar activity, atmospheric chemistry and other individual factors. The Antarctic ozone hole size is mainly affected by chlorine (Cl) and bromine (Br) in the stratosphere, followed by the temperature inside the polar vortex [ Newman and Nash, 2005 ; Newman et al ., 2006 ]. The inter-annual change of the Antarctic ozone is influenced by the planetary waves and polar temperature [ Huck et al., 2005 ]. At present, many studies [ Lu et al ., 1997 ; Hofmann et al ., 1997 ; WMO, 2003 ] suggest that the Antarctic ozone will recover to the level before 1980, but due to many existing uncertainties, it needs further research. China established the observation station of the total ground-level ozone with the internationally advanced Brewer ozone spectrophotometer in Zhongshan station in the Antarctic in 1993 and has obtained the continuous data [ Zheng et al., 1995 ]. In order to know the vertical structure of the ozone hole over the Zhongshan station, 12 ozone sondes were released during September and November in the same year to obtain the partial pressure profile of the atmospheric ozone [ Kong et al., 1996 ]. In addition, 56 times of atmospheric ozone sounding were carried out in Zhongshan station from February 2008 to February 2009, which laid a foundation for the analysis of the troposphere, stratospheric structure and seasonal variation characteristics of ozone in the Antarctic. The research of the spatial and temporal variation characteristics of ozone in the Antarctic shows that the average total ozone has a clear decreasing trend [ Zhou and Lu, 1998 ; Zhou et al ., 1997 ]. The ozone depletion in the South Pole is the severest with a decrease of 6% every 10 years. The decreasing rate slows down with the latitude. The total atmospheric ozone in Zhongshan station shows a big change by the day, which is associated with the changes of the intensity and central position of the polar vortex. The total amount of ozone begins to decrease from September. The minimum generally occurs in October and the largest area of ozone loss is between 13 and 23 km [ Zheng et al ., 1995 ; Kong et al ., 1996 ; Guo et al ., 1997 ].
Based on the ozone observations by the spectrophotometer in the Antarctic station, the ozone data by satellite detection and NCEP/NCAR reanalysis data, and with reference to the chloride and bromide parameters in the Ozone Assessment Report by the World Meteorological Organization [ WMO , 2006 ], this paper analyzes the key factors affecting the Antarctic ozone changes and the changing trends to provide a reference for further assess the ozone’s role in climate change. Nonlinear regression method is used to establish the statistical relationship between the ozone hole size and equivalent effective stratospheric chlorine (EESC) and the stratospheric temperature during 1980–2008.
2. Information and method
The total ozone detected by satellite in this paper is during September 7 and October 13 from 1980 to 2008. The stratospheric temperature for calculation is the NCEP/NCAR reanalysis data in the same period. The total ground-level ozone in the mainland coast of the Southeast Antarctic is the observation materials observed day by day by spectrometer in Zhongshan station (1993–2008) and Syowa station (1980–2007). It should be noted that Dobson spectrometer is used in Syowa station for the observation of the total ozone and Brewer spectrometer is used in Zhongshan station. Two spectrometers have been identified by WMO with high accuracy. Stratospheric temperature is the average data of 50 hPa temperature in 60°-90°S. The Antarctic ozone hole size (OHS) refers to areas less than 220 DU total ozone. The parameter calculation of EESC adopts the correction method of WMO calculation method proposed by Newman et al. [2006] . The equation is as follows:
|
|
( 1) |
In the Eq. (1) : E is EESC; t is the year; nCI and nBr are respectively the atom number of chlorine and bromine in various ozone depleting substances; α is the release efficiency of bromine to chlorine in the process of ozone destruction, and its value is 50; f (Γ) is release rate of chlorine to bromine; ρi and ρj are the mixing ratio of chlorine and bromine compounds respectively [ WMO , 2006 ]. The multiple regression method is used to make OHS (O) as the dependent variable and EESC and stratospheric temperature as the independent variables to get the regression equation to explore the changing trend of ozone. The relationship is as follows:
|
|
( 2) |
In the formula, E is the chlorine and bromine halide equivalent in the stratosphere; T is the 50 hPa temperature; a, b, c, d, and e are the regression coefficients; S is the total ozone of single station. Taking into account the influence of the EESC and the stratospheric temperature on the change of the ozone hole size, the yearly regressed ozone hole size is calculated by Eq. (2) by the use of EESC parameters and the stratospheric temperature.
3. The changes of the Antarctic OHS
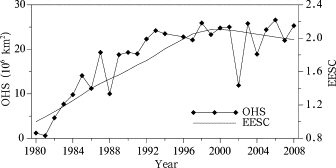
Figure 1 shows the temporal series of the Antarctic ozone hole size since 1980. From Figure 1 , the ozone hole size significantly increased in 1980–1990 with a speed of 1.73×10⁶ km2 each year. The growth rate was gradually slow after 1990s and tended to be stable in the 21st century. In 2002, the ozone hole size was suddenly reduced by almost 50%. WMO ozone assessment report [ WMO, 2006 ] pointed out that this mutation was because that the upload of planetary wave energy in the tropospheric layer in the Antarctic in September 2002 resulted in the sudden warming in the stratosphere, which made the deceleration of polar night current and the increase of the temperature and ozone concentration inside the polar vortex, undermining the strong polar vortex in winter.
|
|
|
Figure 1. Time series of OHS and EESC from 1980 to 2008 |
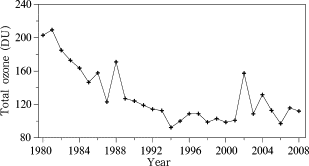
Figure 2 shows the time series of the minimum total ozone during the ozone hole. Compared with Figure 1 , it can be seen that the minimum total ozone and the ozone hole size change reversely and the correlation coefficient between them is −0.99. In other words, the greater the ozone hole size is, the smaller the minimum total ozone is.
|
|
|
Figure 2. Time serie of Antarctic column ozone minimum value from 1980 to 2008 |
4. The relationship between the ozone changes in the Antarctic and EESC and temperature
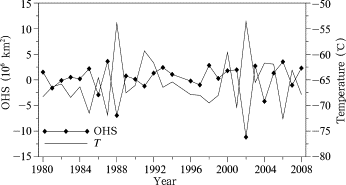
As the chemicals that depleting the ozone observed based on the ground is on the decrease, many studies suggest that the ozone over the Antarctic will restore to the level of the 1980s [ Newman et al., 2006 ]. Currently, the changes of the Antarctic ozone hole are forecasted to show three trends: to stop decreasing, to begin increasing, and to return to the level in 1980. Recently, it enters the state of stopping decrease [ Huck et al., 2005 ]. Figure 1 showed that the ozone hole size was significantly correlated with EESC during 1980–2008 with the correlation coefficient of 0.8. EESC showed an increasing trend year by year during 1980–1998, which was basically the same trend as the change of the ozone hole size. The ozone hole size tended to remain stable since 1995 and maintained to be around 2,300×106 km2 and the EESC parameters tended to decrease slowly. In 2002, the ozone hole size suddenly decreased, but EESC did not do so, indicating the changes of EESC parameters can only be part of the reasons that result in the changes of the ozone hole size to a large extent. Figure 3 shows the temporal series of the ozone hole size and 50 hPa mean temperature after the separation of EESC effect. The two series show the same change with the correlation coefficient of −0.77 and the relevant significant level of 0.001. Thus, the inter-annual fluctuation of the stratospheric temperature will cause the ozone hole size changes and is an important factor affecting the ozone hole size.
|
|
|
Figure 3. Time series of OHS and stratospheric average temperature from 1980 to 2008 |
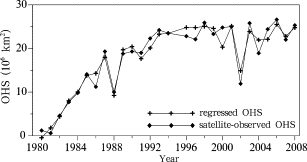
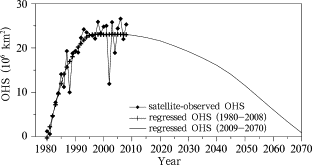
Figure 4 shows the time series of the regressed ozone hole size and the ozone hole size observed by the satellite. The correlation coefficient between them reaches 0.97 and the correlation significant level reaches 0.001. This relationship shows that the changes of the ozone hole size in the Antarctic in spring is the result of the joint action of EESC and the stratospheric temperature, in which EESC reflects the decadal changes of the ozone hole size while the stratospheric temperature shows the inter-annual changes of the ozone hole size. In order to analyze the future changing trend of the Antarctic ozone, based on the physical parameters of the ozone depletion in the stratosphere under the A1 emission scenario in next 100 years given by WMO [2006], Eq. (1) is used to calculate the future changing trend of EESC, and the regression experience (Eq. 2 ) for 1980–2008 is applied to calculate the future changes of ozone hole size, as shown in Figure 5 . The ozone hole size will remain stable until around 2010, then begin to decrease slowly, and return to the 1980 level in about 2070.
|
|
|
Figure 4. Time series of regressed OHS and satellite-observed OHS during 1980–2008 |
|
|
|
Figure 5. Trend of OHS from 1980 to 2070 |
In order to verify the applicability of the EESC parameters given by WMO in the mainland cost of the Southeast Antarctic, the data of Zhongshan station and Syowa station are used to analyze the relationship between the EESC and the stratospheric temperature and the total ozone during the period of the ozone hole. Figure 6 demonstrates the temporal series of the observed and regressed total ozone of the two stations. Although the two stations are located at the edge of the ozone hole, the total ozone changes can still be determined by the equivalent of the ozone depletion in stratosphere and the stratospheric temperature. For the two stations based on these two factors, the total regressed ozone based on those two factors in the two stations and the total ground-level observed ozone are significantly correlated (the correlation coefficients are 0.96 and 0.97).
|
|
|
Figure 6. Time series of observed and regressed column ozone at the ground surface of (a) Zhongshan station and (b) Syowa station |
5. Case analysis of ozone change and the dynamic process
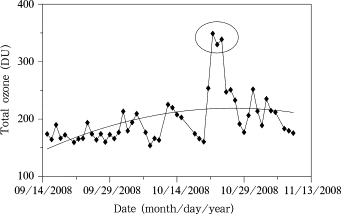
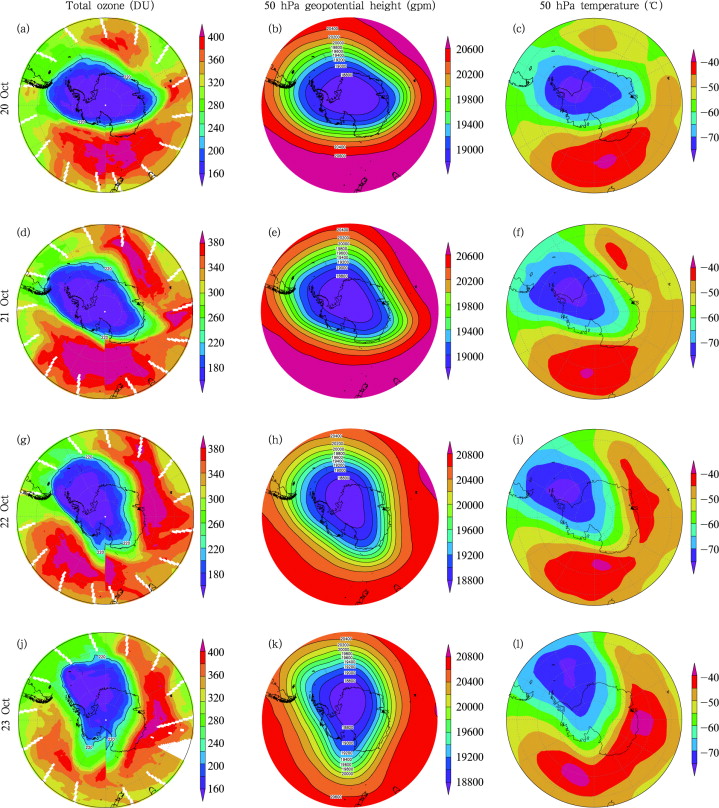
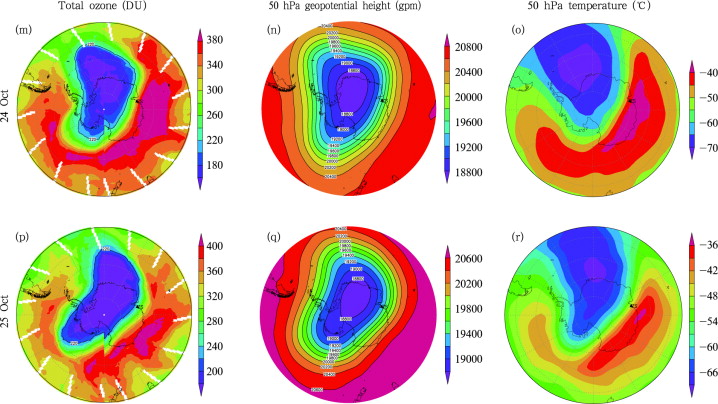
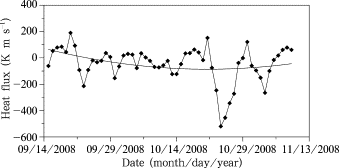
According to the above analysis, the key factors of the ozone depletion in the Antarctic during the period of the ozone hole are EESC and the stratospheric temperature. In order to further reveal the role of the atmospheric dynamics on ozone change, we choose the case of the sudden ozone hole change in Zhongshan station for analysis. Figure 7 shows the time series of the total ozone at Zhongshan station during September 15 and October 10 in 2008. The figure shows that with the gradual increase of the sun elevation in spring, the total ozone showed an upward trend, but it suddenly increased between October 22 and 24, reaching more than 320 DU, and then decreased rapidly. From the spatial distribution of the total ozone, 50 hPa geopotential height and the temperature filed in the Antarctic during October 20 and 25 in 2008 (Fig. 8 ), Zhongshan station was located in the ozone hole (the total ozone was 160.5 DU), and within the high-altitude polar vortex (the geopotential height was 1,900 dam) on October 20. The stratospheric temperature was below −65°C. On October 21, the total ozone in Zhongshan station increased to 253.7 DU, the geopotential height rose to 1,920 dam and the temperature rose to −55°C. With the deviation of the polar vortex from the station region, it was covered by high concentrations of ozone, reaching 320 DU or more. Meanwhile, 50 hPa temperature quickly rose to −40°C or less. Later, with the invasion of the polar vortex, Zhongshan station was located at the edge of the ozone hole and the polar vortex, and the temperature was reduced accordingly. Thus, the mutation process of the ozone in Zhongshan station during October 22 and 24 was caused by the movement and intensity change of the polar vortex. Figure 9 shows the temporal series of 50 hPa meridional thermal flux over the areas around Zhongshan station (75°–80°E, 60°–70°S) during September 15 and October 9 in 2008. The mutation process of the ozone was associated with the sudden increase process of the meridional thermal flux, resulting in a sudden increase heat transport from north to south and leading to the rapid warming and polar vortex position changes in stratosphere and the transport of the high ozone concentration in low latitude to the area over Zhongshan station. Therefore, the abnormal increase of the total ozone in Zhongshan station is the role of the atmospheric dynamics. Feng and Chipperfield [2005] has simulated and compared the similar process occurred in the past and confirmed the dynamic effect of the large-scale horizontal transport on the polar vortex and the ozone.
|
|
|
Figure 7. Time series of column ozone (solid line with squares) from 15 September to 9 November 2008 at Zhongshan station, and its time trend (thin solid curve) |
Figure 8.
Column ozone, 50 hPa geopotential height, and temperature fields over the Antarctica during 20–25 October 2008 (triangle: the location of Zhangshan station)
|
|
|
Figure 9. Time series of meridional heat flux (solid line with squares) at the 50 hPa in the vicinity of Zhongshan station from 15 September to 9 November 2008 (positive/negative value means the heat flux from south to north/north to south) |
6. Conclusions and discussion
The observations by the space-based and ground-based satellites show that the total ozone over the Antarctic decreased rapidly and then formed the ozone hole during the 1980s and the early 1990s, and the ozone hole size changed slowly in the late 1990s and remained stable in the 21st century. EESC is the key factor affecting the ozone hole size and the total ozone changes in the Antarctic. The significant relationship between them shows that the EESC calculation program given by WMO is reliable; in addition, the stratospheric temperature is also an important factor affecting the ozone hole size and the total ozone changes in the Antarctic. The impacts of two factors on the ozone hole in the Antarctic have different roles. EESC determines the decadal change of the ozone while the stratospheric temperature determines its inter-annual changes.
The total ozone and the stratospheric temperature are significantly correlated in Zhongshan station and Syowa station in the Antarctica during the period of the ozone hole, indicating that although the two stations are located at the edge of the ozone hole, the total ozone changes can still be determined by the EESC and the stratospheric temperature, which also verifies the EESC parameters’ applicability in the mainland coast of the Southeast Pole.
EESC given by WMO A1 program, the ozone hole size and the EESC regression results show that the ozone hole size will gradually decrease after 2010, and may return to the 1980 level in 2070 or so. It should be noted that this result still has great uncertainty and needs further study.
Acknowledgements
This work was supported by the program of China Polar Environment Investigation and Assessment(2011–2015) and by the National Nature Science Foundation of China (No. 41076132). We thank the China Meteorological Administration and Chinese Arctic and Antarctic Administration under the National Oceanic Administration that provided support for building the atmosphere monitoring site at Zhongshan station. All the members of the 24th and 25th Chinese Antarctic Expedition are acknowledged for their help in collecting the data.
References
- Chubachi, 1984 S. Chubachi; Preliminary result of ozone observations at Syowa station from February 1982 to January 1983; Mem. Nati. Inst. Polar Res, 34 (special issue) (1984), pp. 13–19
- Farman et al., 1985 J.D. Farman, B.G. Gardiner, J.D. Shanklin; Large losses of total ozone in Antarctica reveal seasonal CIOx /NOx interaction ; Nature, 315 (1985), pp. 207–210
- Feng and Chipperfield, 2005 W. Feng, M.P. Chipperfield; Threedimensional model study of the Antarctic ozone hole in 2002 and comparison with 2000; J. Atmos. Sci, 62 (2005), pp. 822–837
- Guo et al., 1997 S. Guo, X.-J. Zhou, X.-D. Zheng, et al.; The measurements and analyses of ozone profile during the ozone hole period over Zhongshan station, Antarctica; Chinese Journal of Polar Research (in Chinese), 9 (1) (1997), pp. 78–82
- Hofmann et al., 1997 D.J. Hofmann, S.J. Oltmans, J.M. Harris, et al.; Ten years of ozonesonde measurements at the South Pole: Implications for recovery of springtime Antarctic ozone; J. Geophys. Res, 102 (D7) (1997), pp. 8931–8944 http://dx.doi.org/10.1029/96JD03749
- Huck et al., 2005 P.E. Huck, A.J. McDonald, G.E. Bodeker, et al.; Interannual variability in Antarctic ozone depletion controlled by planetary waves and polar temperature; Geophys. Res. Lett, 32 (L13819) (2005) http://dx.doi.org/10.1029/2005GL022943
- Kong et al., 1996 Q.-X. Kong, G. Liu, G.-H. Wang; Observations and analyses of atmospheric ozone over Antarctic Zhongshan station in the spring of 1993; Chinese Journal of Atmospheric Sciences (in Chinese), 20 (4) (1996), pp. 395–400
- Lu et al., 1997 L.-H. Lu, L.-G. Bian, P.-Q. Jia; Short term climatic change of Antarctic ozone; Journal of Applied Meteorological Science (in Chinese), 8 (4) (1997), pp. 402–412
- Newman and Nash, 2005 P.A. Newman, E.R. Nash; The unusual Southern Hemisphere stratosphere winter of 2002; J. Atmos. Sci, 62 (3) (2005), pp. 614–628
- Newman et al., 2006 P.A. Newman, E.R. Nash, S.R. Kawa, et al.; When will the Antarctic ozone hole recover? Geophys; Res. Lett, 33 (L12814) (2006) http://dx.doi.org/10.1029/2005GL025232
- Stolarski et al., 1986 R.S. Stolarski, A.J. Kreuger, M.R. Schoeberl, et al.; Nimbus-7 satellite measurements of the springtime Antarctic ozone decrease; Nature, 322 (6082) (1986), pp. 808–811
- WMO, 2003 WMO (World Meteorological Organization); Scientific assessment of ozone depletion: 2002; Global Ozone Research and Monitoring Project-Report No. 47 (2003) Geneva, Switzerland
- WMO, 2006 WMO (World Meteorological Organization); Scientific assessment of ozone depletion: Chapter 8, halocarbon scenarios, ozone potentials and global warming potentials; Geneva, Switzerland (2006)
- Zheng et al., 1995 X.-D. Zheng, X.-J. Zhou, L.-H. Lu, et al.; Observational study of the 93 “ozone hole” at Zhongshan station; Antarctica. Chinese Science Bulletin, 40 (6) (1995), pp. 533–535
- Zhou and Lu, 1998 X.-J. Zhou, L.-H. Lu; Characteristics of ozone variation and its mechanism over Antarctica; Chinese Committee on Antarctic Research (Ed.), Proceedings of the Progresses of Antarctic Research (in Chinese), China Oceanology Press (1998), pp. 50–57
- Zhou et al., 1997 X.-J. Zhou, L.-H. Lu, L.-G. Bian, et al.; Recent variations of Antarctic temperature, sea ice and ozone; Journal of Nature Science Progress (in Chinese), 7 (4) (1997), pp. 460–466
Document information
Published on 15/05/17
Submitted on 15/05/17
Licence: Other
Share this document
Keywords
claim authorship
Are you one of the authors of this document?
