Abstract
In 1972 mural paintings of Takamatsuzuka tumulus were discovered and have been conserved on site for 35 years, but fungi growth on the mural paintings was not suppressed. In 2007 the stone chamber was dismantled and removed to the facility for conservation and restoration. The purposes of our study are to clarify the main cause of the deterioration and to propose a suitable method to prevent the deterioration for preserving them on site. In this paper, we developed the two-dimensional analysis model by considering the actual change of the surrounding mound because of the excavation in 1972, and perform the analysis of heat behavior of Takamatsuzuka tumulus before and after excavation and compare effects of different sun-shading methods on heat behavior of the stone chamber. The main results are as follows: (1) after the excavation, the inside surface temperature distribution of the stone chamber and the amplitude of indoor temperature become larger. (2) Using the sun-shading panel in the area of excavation is an effective method to reduce the average indoor temperature; however, it has no influence on reducing the temperature distribution of the stone chamber and the temperature difference between the inside wall and indoor.
Keywords
Effect ; Excavation ; Heat transfer ; Sun-shading ; Conservation
1. Introduction
Takamatsuzuka tumulus in Asuka village, Nara Prefecture, Japan, is estimated to be built in the late seventh century. It consists of a stone chamber, which is made of tuff, and the surrounding mound. There are mural paintings on the lime-plastered walls inside the chamber, which were discovered in 1972. At that time, the degree of damage or deterioration of the mural paintings were little confirmed. The mural paintings were designated as national treasure in 1974. It was decided that the mural paintings should be preserved on-site, retaining its original status. For this purpose, a conservation structure, which consists of three antechambers, was constructed in 1976. Since then, however, the occurrence of fungi has accelerated the deterioration of the mural paintings, especially after 2001. Due to the continuing deterioration of the mural paintings, the process of on-site preservation of Takamatsuzuka tumulus was given up. It was decided to dismantle the stone chamber for the purpose of conservation and restoration (Home Page of Agency of Cultural Affairs, 2004–2006 ; Japan Agency of Cultural Affairs Edit, 1987 ).
The primary causes of the deterioration of the mural paintings are the occurrence of fungi, the salt deposition and the exfoliation of the lime plaster on the wall surfaces. In order to inhibit the growth of fungi, the environment should be maintained at lower indoor temperature and relative humidity. However, in order to prevent peeling and dropping of the plaster caused by shrinkage, the environment should be kept at higher indoor relative humidity (larger than 70–80 %) (Takatori et al ., 2010 ; Sedlbauer, 2002 ; Johansson et al ., 2010 ). As can be seen, there is a fundamental contradiction between the appropriate conditions for preserving the paintings and for stabilizing the fungi growth.
In order to conserve the mural paintings on site, it is important to mitigate these influences by means of controlling the temperature and humidity inside the stone chamber. However, a proper approach has not yet been established. Thus, the purposes of our study are to identify the primary causes of the deterioration of the mural paintings of Takamatuzuka tumulus originated during the course from discovery to dismantlement and to propose a proper approach to prevent the deterioration during the process from excavation to on-site conservation. In this paper, in order to identify heat behaviors of the stone chamber during the process from discovery of the mural paintings to the installation of the conservation structure, heat transfer between the stone chamber and the surrounding mound before and after excavation is analyzed, as the first step of research work.
2. Methods
2.1. Fundamental equations
In the analysis, heat balance equation for material is written as follows:
|
|
( 1) |
The boundary equations at the ground surface and the inner surfaces of the stone chamber are as follows:
|
|
( 2) |
|
|
( 3) |
Heat balance equation inside the stone chamber is as follows:
|
|
( 4) |
where cρ is the volumetric specific heat capacity of the material [J/m3 K], T is the temperature [K ], λ is the thermal conductivity [W/m K], αi ,αo are the indoor and outdoor heat transfer coefficient respectively [W/m2 K], Qsol , Qnoc are the adsorption of solar radiation and nocturnal radiation respectively [W/m2 ], cγ is the volumetric specific heat capacity of air [J/m3 K], Sj is the the area of inner surface of the stone chamber [m2 ], n is the air change rate [s−1 ], V is the air volume in the stone chamber [m3 ].
2.2. Analysis model
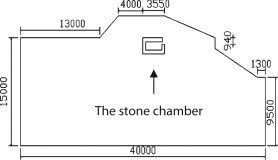
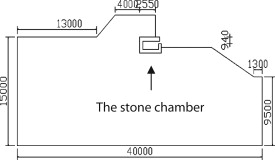
In this analysis, the two-dimensional plane containing the stone chamber shown in Figure 1 ; Figure 2 is analyzed. The stone chamber, which is 1 m wide, 2.6 m long and 1.1 m high, consists of a single-layered tuff with the thickness of about 0.6 m, and is surrounded by the mound (Japan Agency of Cultural Affairs Edit, 1987 ).
|
|
|
Figure 1. Schematic of tumulus before excavation. |
|
|
|
Figure 2. Schematic of tumulus after excavation. |
To estimate the heat behaviors of the stone chamber before and after excavation, the following two cases are examined:
- Case 1 : Mound status before excavation—The schematic of the tumulus before the mural paintings were discovered is shown in Figure 1 as Case 1.
- Case 2 : Mound status after excavation—When the mural paintings were discovered on March 21, 1972, the south wall and a part of ceiling of the stone chamber were directly exposed to the outside atmosphere. Sun-shading covering was built on the area of excavation on April 5 after the first examination. The schematic of tumulus during this period based on the literature ( Home Page of Agency of Cultural Affairs, 2004–2006 ; Japan Agency of Cultural Affairs Edit, 1987 ) is shown in Figure 2 as Case 2.
2.3. Method of numerical analysis
An explicit control volume method is applied with time step of 60 s. To obtain the periodic steady state solution, the calculation is carried out for the duration of 3 years. The result of the third year is discussed. Direct solar radiation reaching on the slope of the outside surface, diffuse sky radiation and nocturnal radiation are all taken into account. However, effects of clouds on solar and nocturnal radiation are neglected. Outdoor temperature is presented as sine curve composed of annual and diurnal cycle. The outdoor annual average temperature and annual amplitude are 14.6 °C and 11 °C respectively, which are based on the meteorological data of Nara. It is assumed that the temperature of soil in the depth of 18 m is constant at 15 °C.
3. Results and discussion
3.1. Indoor temperature variation before and after excavation
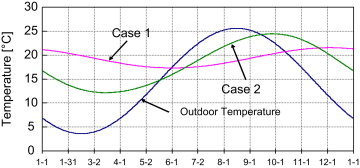
Figure 3 shows the indoor temperature change of Cases 1 and 2. As seen in Figure 3 , before excavation, the outdoor temperatures change periodically between 17.3 °C and 21.5 °C with annual average temperature and the fluctuation of indoor temperatures as 19.4 °C and 2.2 °C respectively. After excavation, the outdoor temperatures change periodically between 12.1 °C and 24.5 °C with annual average temperature and the fluctuation of indoor temperatures as 18.1 °C and 6.4 °C respectively. It can be seen that, before the tumulus was excavated, the indoor temperatures had small amplitude and maintained relatively stable. After excavation, the indoor temperature variation was more close to the outdoor temperature variation. The maximum and the amplitude of the indoor temperatures became much greater.
|
|
|
Figure 3. Annual variation of indoor temperature. |
3.2. Temperature variation on inner wall surfaces
As shown in Figure 4 , Figure 5 ; Figure 7 , the ceiling, the south wall, the floor and the north wall are designated as edges of AB , BC , CD and DA respectively, with A , B , C and D are the corners of related walls. The outside temperatures on February 14th and August 15th are the lowest and the highest throughout the year respectively. As Figure 4 shows, in Case 1 on February 14th, the greatest temperature difference occurred among inner walls is 0.26 °C while the greatest temperature difference between inner walls and the room is 0.15 °C, which appears at corner A. However, in Case 2 on February 14th, such temperature differences are respectively 4.2 °C and 2.6 °C. The latter temperature difference appears at corner B where the temperature is much lower than indoor temperature. On the other hand, as Figure 5 shows on August 15th, such temperature differences in Case 1 are 0.6 °C and 0.3 °C, respectively. In Case 2, they are 4.0 °C and 2.4 °C respectively. The latter temperature difference appears at corner B where the temperature is much higher than indoor temperature.
|
|
|
Figure 4. Temperatures of inner walls and indoor temperature at 12:00 a.m., February 14th. |
|
|
|
Figure 5. Temperatures of inner walls and indoor temperature at 12:00 a.m., August 15th. |
It can be seen, before excavation, the temperature distribution of the inner surfaces of the stone chamber was relatively even and the temperature differences between inner walls and the room are very small throughout the year. After excavation, these temperature differences became much greater. Since at corner B , there occurred greater temperature difference between inner walls and the room, it is highly possible that condensation occurred on corner B in winters. On the other hand, there is a high possibility that the plaster surface on the same place became dry and shrank in summers. The condensation on inner surfaces caused the growth of fungi and the dryness caused the exfoliation of the plasters. Therefore, these impacts are harmful to the conservation of the mural paintings and should be prevented as much as possible.
3.3. The influence on indoor temperatures of using the sun-shading covering after excavation
It seemed that, when the tumulus was excavated it was relatively better way of covering the exposed surfaces with sun-shading panels in order to prevent further deterioration of the mural paintings. The three different cases of sun-shading methods are analyzed.
- Case 3.1 : Covering the entire exposed surface with sun-shading panels.
- Case 3.2 : Covering the excavation site. It better fits the actual situation on site.
- Case 3.3 : Covering only the exposed surface of the stone chamber.
Cases 1 and 2 are further investigated, as one case with better conditions and one without sun-shading covering, respectively.
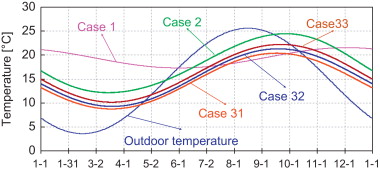
Table 1 shows the annual mean, maximum, minimum and amplitude of indoor temperatures. Figure 6 shows the annual variation of indoor temperatures. As shown in Figure 6 and Table 1 , for all the Cases with sun-shading covering, the indoor temperatures are always lower than the outdoor temperature in summer. Each of the annual average temperature in these three Cases is lower than that in the Case without sun-shading covering. However, the indoor temperatures in Case 3 (including Cases 3.1–3.3) are closer to outdoor temperature. Furthermore, the difference of indoor temperatures between Cases 1 and 3 is very large. Therefore, the method with the sun-shading panels covering all exposed surface applied after excavation is effective on reducing the annual average and the peak temperature, although the variation of indoor temperatures is obviously different from that before excavation.
| Outside | Case 1 | Case 2 | Case 3.1 | Case 3.2 | Case 3.3 | |
|---|---|---|---|---|---|---|
| Tav | 14.6 | 19.4 | 18.1 | 14.6 | 15.3 | 16.2 |
| Tmax | 25.6 | 21.5 | 24.5 | 20.5 | 21.3 | 22.2 |
| Tmin | 3.6 | 17.3 | 12.1 | 8.8 | 9.3 | 10.2 |
| Amplitude | 11.0 | 2.2 | 6.4 | 5.8 | 6.0 | 6.0 |
Tav =annual average of indoor temperature [°C]; Tmax =maximum of indoor temperature [°C]; Tmin =minimum of the indoor temperature [°C].
|
|
|
Figure 6. Annual variation of indoor temperatures. |
3.4. The influence on inner wall temperatures of using the sun-shading covering after excavation
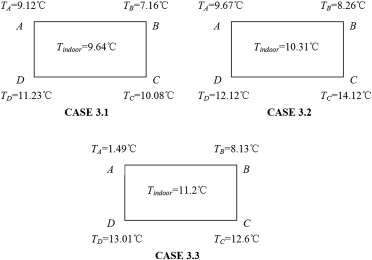
Figure 7 shows the inner wall temperatures and indoor temperature on 12:00 a.m., February 14th. As shown in Figure 7 , in Case 3.1, the greatest temperature difference among inner walls is 4.1 °C, and the greatest temperature difference between inner walls and the room is 2.5 °C. In Case 3.2, these temperature differences are 3.9 °C and 2.1 °C respectively. In Case 3.3, they are 4.9 °C and 3.0 °C respectively. Compared to the above results from Cases 1 and 2, it can be seen that applying the sun-shading covering after excavation has not much influence on even the temperature distribution of the inner walls or mitigate the temperature difference between the inner walls and the room.
|
|
|
Figure 7. Temperatures of inner walls and indoor temperature at 12:00 a.m., February 14th. |
4. Conclusions and perspectives
In this study, heat behaviors of Takamatsuzuka tumulus before and after excavation are analyzed by applying two-dimensional heat transfer equations. Effects of various sun-shading methods are investigated. After the excavation, the annual average and the amplitude of indoor temperatures become larger. On the other hand, the temperature distribution of inner walls is obviously more fluctuated and the temperature differences between inner walls and the room are greater, causing the deterioration of the mural painting. Using the sun-shading panels covering the area of the excavation site is an effective method to reduce the average indoor temperature and the amplitude of indoor temperatures. However, this method has little influence on the evenness of temperature distribution of inner walls as well as the reduction of temperature differences between inner walls and the room. Therefore, it is necessary to use alternative methods to resolve this problem. As a result, we will propose the methods of reducing temperature differences between inner walls and the room. Investigation on heat and moisture behaviors in the stone chamber, considering coupled heat and moisture transfer and the actual outdoor climate, will be the next step of research work.
Acknowledgements
This research was supported by the JSPS (Japan Society for the Promotion of Science) KAKENHI (20560549 ), NSF (National Science Foundation) of China (Grant no. 51108072 ), and Specialized Research Fund for the Doctoral Program of Higher Education of China (Grant no. 20110092120003 ).
References
- Home Page of Agency of Cultural Affairs, 2004–2006 Home Page of Agency of Cultural Affairs, 2004–2006 .〈http://www.bunka.go.jp〉 .
- Japan Agency of Cultural Affairs Edit, 1987 Japan Agency of Cultural Affairs Edit, 1987 National Treasure Takamatuzuka Tumulus Preservation and Maintenance. pp. 36–40 (in Japanese).
- Johansson et al., 2010 S. Johansson, L. Wadsö, K. Sandin; Estimation of mould growth levels on rendered façades on surface relative humidity and surface temperature measurements; Building and Environment, 45 (2010), pp. 1153–1160
- Sedlbauer, 2002 K. Sedlbauer; Prediction of mould growth by hygrothermal calculation; Journal of Building Physics, 25 (4) (2002), pp. 321–336
- Takatori et al., 2010 K. Takatori, M. Takatori, Y. Kumeda, R. Kigawa, C. Sano; Physiological and biological studies on the growth of fungi isolated from Takamatsuzuka Tumulus; Science for Conservation, 49 (2010), pp. 61–71
Document information
Published on 12/05/17
Submitted on 12/05/17
Licence: Other
Share this document
Keywords
claim authorship
Are you one of the authors of this document?
