Summary
This paper focuses on an investigation of an improved longitudinal joint with headed bar details connecting precast decked bulb tee girders for accelerated bridge construction. The testing study included two phases. In phase I, five beam specimens with various headed bar details and a continuous reinforced specimen were tested under flexure loadings. A headed bar detail with 152 mm lap length was recommended for further study. In phase II, two slabs connected by the selected joint were tested under flexure and flexure-shear loadings. Test results were evaluated based on structural behaviors including capacity, deflection, and failure mode. At last, a validated strut-and-tie model was developed to anticipate the capacity of the improved longitudinal joint. It shows that the proposed headed bar details can provide a continuous force transfer in the joint. The lap length interacting with the spacing of the headed bar is the most significant parameter of the improved joint details. To develop a full strength joint, the lap length should not be less than 152 mm and be designed by the strength requirement. The strut-and-tie model can provide a conservative strength anticipation of the joint and it is the lower bound of the ultimate capacity of the joint.
Keywords
Lap length ; Headed reinforcement ; Joint zone ; Strut-and-tie model ; Accelerated construction
Introduction
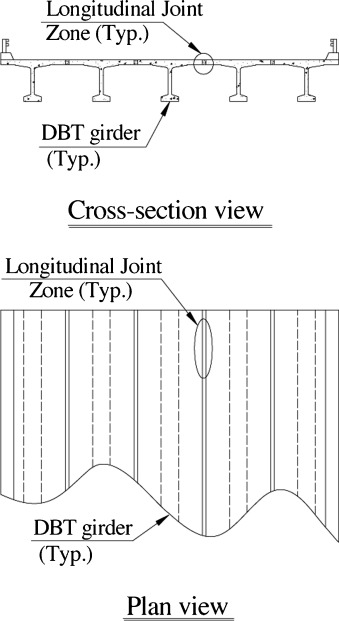
The rapid speed of bridge constructions, as well as the safety of bridges during the operation schedule has become a more critical issue than ever before, considering the disruption of the traffic and the cost of on-site labors. One of promising systems for accelerated bridge construction is the use of the decked bulb-tee (DBT) girder for bridge superstructures (Stanton and Mattock, 1986 , Ralls et al., 2005 , Li et al., 2010a and Li et al., 2010b ). The precast DBT girder includes a wide top flange which can be exploited as the bridge deck, and DBT girders are erected such that flanges of adjacent units abut with each other. Load transfer between adjacent top flanges is provided by longitudinal joints (parallel to traffic direction). Fig. 1 shows a typical simple span bridge consisting of 5 DBT girders connected by 4 longitudinal joints.
|
|
|
Figure 1. A bridge consisting of 5 typical DBT girders connected by 4 longitudinal joints. |
This system eliminates the time necessary to form, place, and cure concrete beams or decks at bridge sites. Currently, the joint zone consists of welded steel connectors and a grouted shear key (Ma et al., 2007 ), which has the strength to transfer shear and limited moment from one girder to adjacent ones. Besides, the width of the joint zone is small to facilitate accelerated construction. Despite major benefits of this type of the system, the use has been limited to isolated regions of United States, particularly in northwestern states of Washington, Oregon, Idaho, and Alaska. One of the main concerns is that there is no design guideline and standard details for the joint which has features of both producing full strength and allowing for rapid construction.
Proposed joint with headed bar details
The desirable joint details shall have the following features. First, it should be a full strength joint to transfer internal forces including moment and shear between girders. Besides, the failure mode shall be ductile rather than brittle. Furthermore, the width of the joint should be kept as narrow as possible to help accelerated construction.
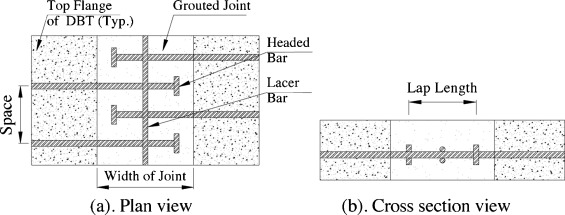
Proposed headed bar details along the joint zone (Li et al., 2010a and Li et al., 2010b ) consist of distributed headed bars shown in Fig. 2 . The headed bars project from the top flange of DBT; and embed in the joint to provide mechanical anchorage that is necessary to transfer loads in the joint. The width of the joint is determined by the lap length of the headed bars, which is kept as small as possible to facilitate the accelerated construction. The headed bars provide continuity of the deck reinforcement along the joint by staggering from the adjacent top flanges. The space of the staggering cannot be too large to transfer forces across the joint efficiently. The joint is grouted to connect the adjacent top flanges as an integrated bridge deck. From the view of protection for reinforcement, 51 mm of top cover and 25 mm of bottom cover shall be maintained (AASHTO LRFD, 2010 ). One lacer bar is placed above and below the staggered headed bars to provide the reinforcement confinement along the perpendicular direction.
|
|
|
Figure 2. Proposed headed bar details. |
Summary of experimental programs
Tests were conducted to validate the performance of the improved joints with spliced headed bar details. The tests consisted of two stages. In stage I, six beam specimens with various reinforcement details were fabricated and tested by flexure loadings only. Based on the structural behaviors including load capacities and failure modes, one selected headed bar detail was tested further. In stage II, two slab specimens connected by the selected headed bar detail and grouted joint were subjected to both flexure loading and flexure-shear loading, respectively.
Testing phrase I
Specimen dimensions
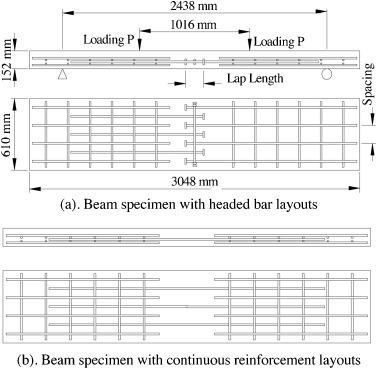
A total of six beam specimens with variable reinforcement details were fabricated. Fig. 3 (a) shows the dimension of the five beam specimens (B1, B2, B3, B4, and B5) with variable headed bar details. The variables in the specimens are the lap length of the headed bar, headed bar spacing, as well as the concrete compressive strength in the joint zone. B6 is reinforced by continuous bar across the joint as shown in Fig. 3 (b) for comparison purpose. All the six specimens were of 610 mm width, 3048 mm length, and 152 mm depth. The specimens had four layers of reinforcement both at the left side and the right side to simulate the deck reinforcement in the top flange of the precast girders. The headed bars spliced with the deck reinforcement long enough to avoid pulling out.
|
|
|
Figure 3. Specimen dimensions. |
All the spliced headed bars are grade 60 with diameter of 16 mm (No. 5 bar). The lacer bar was grade 60 with diameter of 13 mm (No. 4 bar). The diameter of the head is 51 mm. The main variables of each specimen including concrete strength , headed bar lap length l , and spacing s were listed in Table 1 .
| Specimen | (MPa) | l (mm) | s (mm) |
|---|---|---|---|
| B1 | 72.7 | 152 | 152 |
| B2 | 56.7 | 64 | 152 |
| B3 | 61.1 | 152 | 102 |
| B4 | 61.7 | 64 | 102 |
| B5 | 58.5 | 102 | 152 |
| B6 | 72.7 | NA | 152 |
Instrumentation and test setup
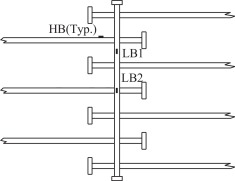
To gain a better understanding of the behavior of the improved joint details, the spliced headed bar and the lacer bar were instrumented with strain gages. As shown in Fig. 4 , the strain gages were place on the spliced headed bar in the joint zone, as well as at the middle and the quarter of the lacer bar.
|
|
|
Figure 4. Strain gage instrumentation. |
The longitudinal joint connecting the adjacent top flange of precast girders is a part of the bridge deck. Since the joint locates at the middle of the bridge deck between two adjacent girder webs, the flexural behavior is significant under the dead load and vehicle loads. As shown in Fig. 3 (a), all six specimens were simply supported. Two P loadings were applied at the same value simultaneously and the joint zone has the pure flexural behavior.
Test results
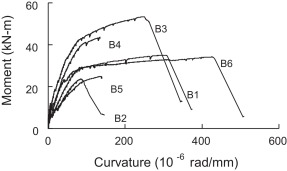
Fig. 5 compares the moment curvature response for each of the beam specimens. Three specimens (B2, B4, and B5) failed prematurely and the maximum curvature could not be reported. The beam failed with a low curvature will be undesirable in the engineering application because the failure will be brittle and unexpected. It could be clearly seen that the 152 mm lap length specimens (B1 and B3) provided much more ductility than the 64 mm or 102 mm lap length specimens (B2, B4 and B5). The maximum curvatures in B1 and B3 were almost twice as large as those in specimens B2, B4, and B5. In 152 mm lap length specimen moment curvature response curves, there were considerable flatting of the curves followed by a dropping off which meant that the reinforcement yielded after the specimen reached the nominal moment until the compression zone of concrete crushed, and the specimen could not take any more load.
|
|
|
Figure 5. Moment curvature diagrams. |
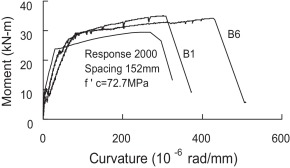
Response 2000 (Bentz and Collins, 2006 ) was used to predict the moment curvature behavior of a continuously reinforced specimen. The yield stress of 476 MPa and the elasticity modulus of 208 GPa of the reinforcement were used in the Response 2000 analysis. Fig. 6 plotted the moment curvature curve for specimen B1, B6, and Response 2000 with 152 mm reinforcement spacing. Both testing specimens had a higher moment capacity and higher ductility than Response 2000. B1 had a little bit more moment capacity (3%) than B6. The B6 was more ductile than B1 with the maximum curvature which was 36% larger than that of B1. However, the 152 mm lap length had considerable anchorage to provide desirable loading capacity and ductility.
|
|
|
Figure 6. Comparison of moment curvature curves. |
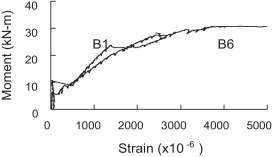
Fig. 7 compared the moment strain response in the joint between the specimen B1 and the comparison specimen B6. The moment strain curves matched very well which confirmed that reinforcement would fully develop in 152 mm lap length headed bar connection.
|
|
|
Figure 7. Comparison of the strain. |
Testing phrase II
Specimen dimensions
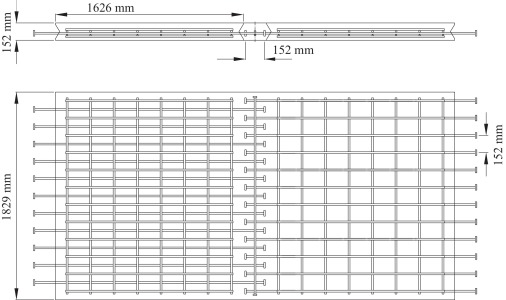
Based on the testing results in phrase I, specimen B1 with joint details of 152 mm lap length and 152 mm spacing was selected for further study. Fig. 8 shows the dimension of the slab specimen in testing phase II. The slab specimen consists of two panels. Each panel is 1829 mm in width, 1626 mm in length, and 152 mm along depth. The female to female shear key was provided at the vertical edge of both ends in the panel length direction, which connected the two panels as one slab. The lap length and spacing of the headed bar was 152 mm. All the reinforcement has 420 MPa yielding stress and epoxy coated. The headed reinforcement was 16 mm diameter (No. 5 bar) with a standard 51 mm diameter circular friction welded head. The head thickness was 13 mm.
|
|
|
Figure 8. Slab dimensions. |
Instrumentation and test setup
The headed reinforcement around the joint zone was instrumented with strain gages as shown in Fig. 4 to have a better understanding of the behavior of the slab connected by the joint. Each panel was set on the steel girder and was leveled to ensure the two panels were on the same plane. At the joint zone, the two panels were positioned carefully to satisfy the overlapped length and the spacing of the headed reinforcement (Fig. 9 (a)). The wood forms were provided at the bottom and both ends of the joint to prevent the leakage when grouting. After grouting, the slab consisting of two panels connected by the joint was ready to be tested (Fig. 9 (b)).
|
|
|
Figure 9. (a) Panel positioning and (b) slab fabrication. |
Two slab specimens were tested under different loadings as shown in Fig. 10 : (a) flexure test, and (b) flexure-shear test. The specimens were simply supported with a 1828 mm span and the joint zone located in the center of the span. The neoprene pad with two layers of plastic sheets placed between the wood support and slab bottom to achieve the roller boundary condition while the use of neoprene pad only simulated pinned boundary condition. Linear voltage displacement transducers (LVDTs) were employed to measure the specimen displacement and settlement.
|
|
|
Figure 10. Testing setup. |
The flexure testing specimen was loaded with two equal loads spaced at 305 mm about the center of the span until specimen failed. The joint zone experienced the maximum constant moment without shear. After the flexure test, the slab was cut along the joint zone. Then, the detached two panels were re-connected along the other edge to be fabricated the second slab specimen for the flexure-shear testing. The flexure-shear testing specimen was loaded with one load located at 305 mm about the center of the span until specimen failed. The joint zone experienced the combination of moment and shear.
The compressive strength of concrete panel and grouted joint at the time of testing for each specimen are shown in Table 2 .
| Specimen | Panel (MPa) | Joint (MPa) |
|---|---|---|
| Flexure | 52 | 38 |
| Flexure-shear | 52 | 51 |
Test results
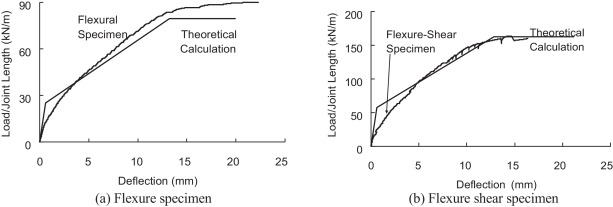
Fig. 11 compares the load deflection curves between the testing specimen and the theoretical calculation based on the beam theory (labeled Theoretical Calculation). The theoretical curve consists of three parts: before cracking, after cracking until yielding of the reinforcement, and the stage of plastic hinge development at middle span after reinforcement yielding. Before cracking, the development of the deflections of both flexure specimen as well as flexure-shear specimen was faster than the theoretical analysis based on beam theory. The theoretical cracking loading was larger than the correspondence testing loading. It is probably due to the different compressive strength between the precast panel and the cast-in-place grouted joint, and there was an interface between the panel and the joint. However, after cracking, the slopes of the two curves were about to be convergent. This indicates that the loading deflection behavior of the slab connected by the improved headed bar joint was the same as the members connected by continuous reinforcement after cracking. After yielding of the reinforcement, the plastic hinge is developed fully in the joint zone of the flexure specimen with large deformation until failure. Both flexure specimen and flexure-shear specimen had larger loading capacities than theoretical ones.
|
|
|
Figure 11. Load deflection curve. |
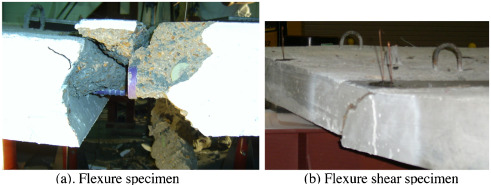
As shown in Fig. 12 (a), the failure mode of the flexure specimen is a typical flexure failure. After the headed reinforcement yields, both the concrete in the panel and the grout in the joint crushes. The grout under the reinforcement spalls off along the joint due to the bending of the spliced headed bars. The slab specimen experiences a ductile failure and spliced headed bars hold the crushed concrete to prevent the separation of the panels. The failure mode of the flexure-shear specimen is a typical flexural shear failure. Fig. 12 (b) shows that the shear crack crosses the joint zone when the slab fails. It can be seen that the shear crack is widened from the lower left part of the joint interface. Then, it crosses the whole grouted joint and reaches to the top right part of the joint interface.
|
|
|
Figure 12. Failure mode. |
Prediction by strut-and-tie model
Since headed bars are staggered and they are not continuous in the joint, the load transfer in the joint is related to the interaction between the distributed bars and the surrounding concrete. The strut-and-tie model (STM) is a detailing and ultimate strength method for analyzing discontinuity regions in reinforced concrete structures (Schlaich and Schafer, 1991 ).
STM in joint zone
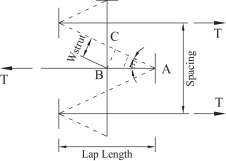
The improved joint shown in Fig. 2 is reinforced by the spliced headed bar, where the internal forces transferred between the staggered headed bars, the lacer bar, and the surrounding concrete. The force transfer mechanism in the region can be idealized by the STM (right angled triangles such as the triangle ABC) shown in Fig. 13 . The headed bars and lacer bar are the tie members represented by solid line which take internal tension force (T). The concrete between two opposite spliced headed bars is the strut member represented by dash line resisting compression force (C). The head of the bar provides enough anchorage in the nodal zone. The compression force and the tension force are balanced at the node A, so the improved joint detail is the C–C–T node. The angle between the axle of the strut and the axle of the tie is θ .
|
|
|
Figure 13. STM for joint zone. |
Force balance in STM
The load capacity of each member of the STM (such as model ABC) is controlled by the crushing of the diagonal concrete strut AC, the yielding of the headed bar AB and the lacer bar BC. The tension forces in lacer bars for all STMs are equal because the lacer bar member is the same rebar. The idealized failure mode of the joint zone is the crushing of the concrete AC or the yielding of the lacer bar BC after the yielding of the headed bar AB. Otherwise, the capacity of the headed bar cannot be obtained, and the load failure of the joint is brittle instead of ductile. From force equilibrium, the internal force of each member in the STM can be expressed by:
|
|
( 1) |
|
|
( 2) |
|
|
( 3) |
where T is the tensile force on the headed bar; Fs , Fh , Fl are the internal forces in the concrete strut, headed bar, and lacer bar respectively; θ is determined in terms of the headed bar lap length l and the spacing s by the expression of .
According to the design code (ACI Committee 318, 2011 ), the ultimate strength of the strut and tie are and Ft = Atfy , respectively. Substituting the ultimate strength of strut and tie into Eqs. (1) , (2) and (3) , the ultimate tension strength of the STM controlled by each member is expressed as:
|
|
( 4) |
|
|
( 5) |
|
|
( 6) |
where Tus , Tuh , Tul are the ultimate tension capacity of the STM controlled by strut, headed bar, and lacer bar respectively; Ah and Al are the area of the headed bar and lacer bar respectively; fyh and fyl are the yielding strength of the headed bar and lacer bar respectively; is the compressive strength of concrete; Astrut is cross sectional area of a strut determined by
|
|
( 7) |
where D is the depth of the diagonal strut, which equals to the heads diameter of the headed bar for conservative purpose. Wstrut is the width of the diagonal strut shown in Fig. 13 , which is calculated as the determination of the diagonal strut width in the truss model for a reinforced concrete beam (Collins and Mitchell, 1991 ). For the specimen anchored by N headed bars on one side, the ultimate tension capacity Tu can be determined by
|
|
( 8) |
For the longitudinal joint where the flexure behavior is significant, the moment capacity can be estimated by the sectional force equilibrium. The ultimate compression force Cu in the top zone is equal to the tension force Tu in the bottom zone. Since the stress limit of is imposed when the failure of the concrete occurs, the depth of the neutral axis c and the ultimate moment capacity of the longitudinal joint Mu can be obtained by:
|
|
( 9) |
|
|
( 10) |
where b is the width of the specimen, and ds is the distance from the extreme compressive fiber to the centroid of the reinforcement.
Comparisons between testing and STM
Table 3 lists the predicted Tus , Tuh , Tul , Tu , and Mu for each specimen with headed bar details according to Eqs. (1) , (2) , (3) , (4) , (5) , (6) , (7) , (8) , (9) and (10) based on the STM. The sectional analysis (Bentz and Collins, 2006 ) was conducted to predict the moment capacity of the comparison specimen with continuous reinforcement in the joint zone.
| Specimen | Moment capacity (kN m) | ||||||||
|---|---|---|---|---|---|---|---|---|---|
| Test | Anticipation | ||||||||
| S A | STM | ||||||||
| Tus | Tuh | Tul | Tu | Mu | |||||
| B1 | 35 | 28 | 574 | 279 | 1281 | 279 | 25 | 1.39 | 1.25 |
| B2 | 24 | 27 | 230 | 279 | 534 | 230 | 21 | 1.14 | 0.89 |
| B3 | 53 | 40 | 603 | 465 | 3203 | 465 | 40 | 1.33 | 1.33 |
| B4 | 44 | 41 | 413 | 465 | 1334 | 413 | 36 | 1.21 | 1.07 |
| B5 | 25 | 27 | 369 | 279 | 854 | 279 | 25 | 1.00 | 0.93 |
| Flexure | 99 | 89 | 1100 | 1024 | 4697 | 1024 | 87 | 1.13 | 1.11 |
| Flexure-Shear | 91 | 91 | 1477 | 1024 | 4697 | 1024 | 89 | 1.02 | 1 |
Note: SA is the notation of sectional analysis.
From Table 3 , it can been seen that the capacity controlled by strength of the lacer bar Tul is much larger than the value either controlled by strength of the headed bar Tuh or the concrete strut Tus for all specimens. The lacer bars were far away to the yielding when specimens failed. The four specimens B1, B3, Flexure, and Flexure-Shear with 152 mm lap length have full strength joint where the spliced headed bars (tie) are well yielded before the concrete (strut) crushing based on the STM prediction (Tus is larger than Tuh ). The STM predictions are consistent with the testing specimens that there were lots of well distributed cracks in the joint zone, and the concrete in the top compression zone was crushed until failure.
For specimens B2 and B4 with 64 mm lap length, the spliced headed bars (tie) were not yielded yet until the crushing of the concrete (strut) based on the STM prediction (Tuh is larger than Tus ). It indicates that the capacities of the specimens B2 and B4 are controlled by the concrete strength in the joint zone. The predictions were correspond to the testing specimens with concrete in the top compression zone in good shape at failure, and a large diagonal crack propagating cross the joint when the specimen cannot carry any more loadings. Specimen B5 has 102 mm lap length with 152 mm spacing, and the spliced headed bars (tie) were barely yielded when the concrete (strut) crushed. Specimens B2, B4 and B5 experienced the brittle failure and the deformation is small.
It shows that the anticipated ultimate capacities of specimens by STM match with the experimental values well. The ratio of the testing capacity and predicted capacity by STM is greater than unity for all specimens, and the average is 1.17. The proposed STM is a rational analysis method for discontinuous region based on strength capacity, and it provides safe and conservative predictions.
Conclusions
Based on the analysis of the experimental programs of proposed spliced headed bar details and comparison between STM predictions and testing results, following conclusions were made:
- The proposed headed bar details can provide a continuous force transfer in the longitudinal joint with small width to accelerate construction.
- The reinforcement spacing has an effect on the structural behavior. The smaller spacing provides more load resistance with less ductility due to more reinforcement in the cross sectional area.
- The lap length interacting with the spacing of the headed bar is the most significant parameter of the improved headed bar details. In order to develop a full strength joint, the lap length can be designed by the strength requirement: yielding of the headed bar before the crushing of the concrete with considering the depth of specimen, as well as the concrete strength. The lap length of headed bars should not be less than 152 mm where No. 5 reinforcement is recommended.
- The STM can provide a conservative strength anticipation of the joint anchored by spliced headed bars. The prediction is based on the internal force equilibrium, and it is the lower bound of the ultimate capacity of the joint zone.
Conflict of interest
The authors declare that there is no conflict of interest.
Acknowledgments
The research is supported by the National Cooperative Highway Research Program 12-69 project, and Fundamental Research Funds for the Central Universities (Grant No. SWJTU12CX076 ).
References
- AASHTO LRFD, 2010 AASHTO LRFD; Bridge Design Specifications; (5th ed.)American Association for State Highway and Transportation Officials, Washington, DC (2010)
- ACI Committee 318, 2011 ACI Committee 318; Building Code Requirements for Structural Concrete (ACI 318-11) and Commentary; American Concrete Institute, Farmington Hills, MI (2011)
- Bentz and Collins, 2006 E.C. Bentz, M.P. Collins; Response-2000 Reinforced Concrete Sectional Analysis; (2006) A software downloaded
- Collins and Mitchell, 1991 M.P. Collins, D. Mitchell; Prestressed Concrete Structures; Prentice-Hall, Englewood Cliffs, NJ (1991)
- Li et al., 2010a L. Li, et al.; Improved longitudinal joint details in decked bulb tees for accelerated bridge construction: concept development; ASCE J. Bridge Eng., 15 (3) (2010), pp. 327–336
- Li et al., 2010b L. Li, et al.; Improved longitudinal joint details in decked bulb tees for accelerated bridge construction: fatigue evaluation; ASCE J. Bridge Eng., 15 (5) (2010), pp. 511–522
- Ma et al., 2007 Z. Ma, et al.; Field test and 3D FE modeling of decked bulb-tee bridges; ASCE J. Bridge Eng., 12 (3) (2007), pp. 306–314
- Ralls et al., 2005 M.L. Ralls, et al.; Prefabricated Bridge Elements and Systems in Japan and Europe Rep. No. FHWA-PL-05-003; Federal Highway Administration, Washington, DC (2005)
- Schlaich and Schafer, 1991 J. Schlaich, K. Schafer; Design and detailing of structural concrete using strut-and-tie models; Struct. Eng., 69 (6) (1991), pp. 113–125
- Stanton and Mattock, 1986 J. Stanton, A.H. Mattock; Load Distribution and Connection Design for Precast Stemmed Multibeam Bridge Superstructures. NCHRP Rep. 287; (1986)
Document information
Published on 05/10/16
Licence: Other
Share this document
Keywords
claim authorship
Are you one of the authors of this document?
