Abstract
Background
Aortic valve stenosis (AS) is characterized by chronic left ventricular pressure overload, leading to left ventricular hypertrophy (LVH). We assessed correlations in left ventricular volumes and function between echocardiography and quantitative gated SPECT (QGS) in patients with AS.
Methods and results
The study population consisted of 28 patients with AS defined as a peak velocity of > 3.0 m/s and 28 age- and sex-matched control subjects. Patients with AS had a peak pressure gradient of 73.4 ± 24.5 mm Hg and a larger LVM index compared to control subjects (115.5 ± 29.2 g/m2 vs 78.3 ± 12.1 g/m2, p < 0.01). There were good correlations in end-diastolic volume and end-systolic volume between echocardiography and QGS in patients with AS as well as control subjects. Bland–Altman plot for end-systolic volume showed a significant negative slope of − 0.51 in patients with AS. There was a good correlation in ejection fraction between the 2 methods in patients with AS as well as control subjects. However, Bland–Altman plots showed significant negative slopes of − 0.40 in patients with AS and − 0.74 in control subjects.
Conclusions
Our data suggested that QGS was a useful method for assessing left ventricular volumes and function even in patients with AS. Cardiologists should recognize its specific characteristics.
Keywords
Ventricular function;Ventricular volume;Ejection fraction
1. Introduction
Aortic valve stenosis (AS) is currently the most common valvular heart disease characterized by chronic left ventricular pressure overload, leading to left ventricular hypertrophy (LVH) [1]; [2] ; [3]. Previous studies have shown that left ventricular ejection fraction (EF) is strongly associated with outcome in patients with AS [4]; [5] ; [6], and it is clinically important to assess left ventricular volumes and function. Echocardiography and quantitative gated single photon emission computed tomography (SPECT) [QGS] are commonly used for assessing left ventricular volumes and function, and several studies have shown good correlations between the 2 methods [7]; [8] ; [9]. However, their correlations in patients with AS remain to be investigated.
In the current study, we compared left ventricular geometric pattern between patients with AS and control subjects. We also assessed correlations in left ventricular volumes and function between echocardiography and QGS.
2. Methods
2.1. Patients
The study population consisted of 28 patients with AS defined as a peak velocity of > 3.0 m/s and 28 age- and sex-matched control subjects. Control subjects were selected according to the absence of both valvular heart disease and left ventricular hypertrophy (LVH). Patients with evidence of heart failure, renal failure (serum creatinine > 2 mg/dl), atrial fibrillation or ventricular pacing were excluded in this study.
2.2. Echocardiography
Comprehensive echocardiographic assessment was conducted by 2 experienced sonographers using commercially available ultrasound systems with 3.5 MHz probes. Interventricular septal thickness (IVS), posterior wall thickness (PWT) and left ventricular internal dimension (LVID) were measured at end-diastole according to established standards of the American Society of Echocardiography (ASE). Left ventricular end-diastolic volume (EDV), end-systolic volume (ESV) and EF were obtained using a modified biplane Simpsons method from the apical 2- and 4-chamber views [10]. These echocardiographic measurements were considered as the reference standard method. Left ventricular mass (LVM) was calculated according to the ASE-recommended formula [11]: LVM (g) = 0.8 × {1.04[(IVS + LVID + PWT)3 − (LVID)3]} + 0.6. LVM was divided to body surface area to obtain the LVM index. LVH was diagnosed as LVM index > 115 g/m2 in men and 95 g/m2 in women.
2.3. Thallium-201 gated SPECT
All patients fasted overnight, and underwent stress–rest thallium-201 (Tl-201) gated SPECT. Adenosine was infused over 6 min (120 μg/kg/min), and Tl-201 (111 MBq) was injected 3 min after the initiation of adenosine infusion. The stress Tl-201 SPECT acquisition was started 5 min after the stress test. Four hours later, rest Tl-201 SPECT images were also obtained. Gated SPECT images were acquired with a dual-head gamma camera system (Siemens E-CAM, Siemens Medical Solutions). Gating was performed with 16 frames per cardiac cycle, using a 60% beat acceptance window. Tl-201 SPECT images were acquired with a 10% symmetric window over the 80-keV Tl photopeak. The raw projection datasets were filtered with a Butterworth filter. No scatter or attenuation correction was applied.
Quantitative analysis of EDV, ESV or EF was performed on rest Tl-201 SPECT using a commercially available software package (QGS [quantitative gated SPECT], Cedars-Sinai Medical Center, Los Angeles, CA) [12]. Semiquantitative visual interpretation of Tl-201 SPECT images was performed with the short and vertical long axes divided into 17 segments. Each segment was graded using a 5-point scoring system (0, normal uptake; 1, mildly reduced uptake; 2, moderately reduced uptake; 3, severely reduced uptake; 4, absence of detectable radiotracer in a segment). Patients with sum of rest score > 6 were excluded in this study because it might affect QGS measurements.
2.4. Statistical analysis
All data are expressed as mean ± SD. Students unpaired test and chi-square test were used to evaluate the difference in values between patients with AS and control subjects. Students paired t-test was used to evaluate the difference in values between echocardiographic and QGS methods in each group. Pearsons correlation coefficient and regression analysis were used to evaluate the correlation between the 2 methods. Bland–Altman plot was applied to assess the agreement between the 2 methods. The regression of the mean and the difference between values assessed by echocardiography and QGS were analyzed. Differences were considered significant if the p value was < 0.05.
3. Results
3.1. Patient characteristics
Patient characteristics are shown in Table 1. There was no significant difference in age, gender or BMI between patients with AS and control subjects. Patients with AS had a peak pressure gradient of 73.4 ± 24.5 mm Hg. Patients with AS had a larger RWT (0.44 ± 0.08 vs 0.36 ± 0.05, p < 0.01) and a larger LVM index (115.5 ± 29.2 g/m2 vs 78.3 ± 12.1 g/m2, p < 0.01) compared to control subjects.
| Patients with AS | Control subjects | p value | |
|---|---|---|---|
| (n = 28) | (n = 28) | ||
| Age (years) | 78.0 ± 8.0 | 77.6 ± 6.5 | ns |
| Male gender | 14 (50%) | 14 (50%) | ns |
| Body mass index (kg/m2) | 23.4 ± 4.0 | 23.5 ± 3.3 | ns |
| Peak pressure gradient (mm Hg) | 73.4 ± 24.5 | – | – |
| Interventricular septal thickness (mm) | 10.5 ± 2.0 | 8.3 ± 0.8 | < 0.01 |
| Posterior wall thickness (mm) | 10.4 ± 1.5 | 8.3 ± 0.9 | < 0.01 |
| Left ventricular internal dimension (mm) | 47.2 ± 4.9 | 45.8 ± 3.5 | ns |
| Relative wall thickness | 0.44 ± 0.08 | 0.36 ± 0.05 | < 0.01 |
| Left ventricular mass index (g/m2) | 115.5 ± 29.2 | 78.3 ± 12.1 | < 0.01 |
| Left ventricular hypertrophy | 16 (57%) | 0 (0%) | < 0.01 |
| Sum of rest score | 1.0 ± 1.7 | 0.6 ± 1.2 | ns |
3.2. Left ventricular volumes and function
Left ventricular volumes and function assessed by echocardiography and QGS are shown in Table 2. On the 2 methods, EDV was significantly larger in patients with AS than control subjects. EF was similar between the 2 groups. Underestimate of EDV on QGS was significantly lower in patients with AS than control subjects (20.5% vs 31.8%, p < 0.01). Underestimate of ESV (21.7% vs 32.6%, p = ns) or EF (− 0.9% vs − 0.4%, p = ns) on QGS was similar between the 2 groups.
| Patients with AS | Control subjects | p value | |
|---|---|---|---|
| (n = 28) | (n = 28) | ||
| Echocardiographic measurements | |||
| Left ventricular end-diastolic volume (ml) | 86.9 ± 27.5 | 71.2 ± 13.5 | < 0.01 |
| Left ventricular end-systolic volume (ml) | 33.9 ± 22.0 | 25.7 ± 5.6 | 0.07 |
| Left ventricular ejection fraction (%) | 63.1 ± 9.3 | 64.0 ± 4.0 | ns |
| QGS measurements | |||
| Left ventricular end-diastolic volume (ml) | 69.8 ± 31.9⁎ | 48.6 ± 11.0⁎ | < 0.01 |
| Left ventricular end-systolic volume (ml) | 28.5 ± 26.5⁎ | 17.5 ± 5.9⁎ | < 0.05 |
| Left ventricular ejection fraction (%) | 64.1 ± 13.5 | 64.2 ± 7.0 | ns |
⁎. p < 0.01 vs echocardiography.
3.3. Correlations in left ventricular volumes
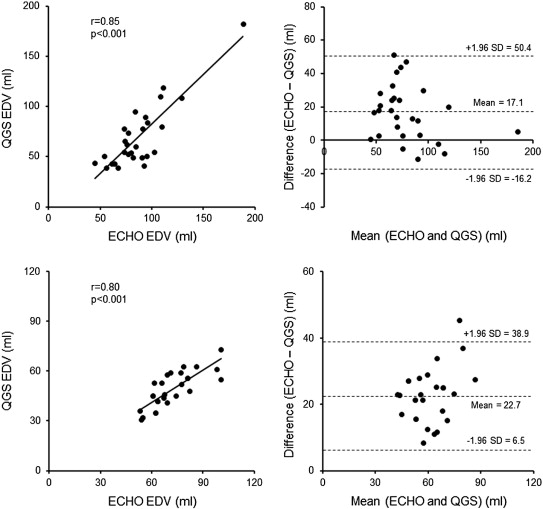
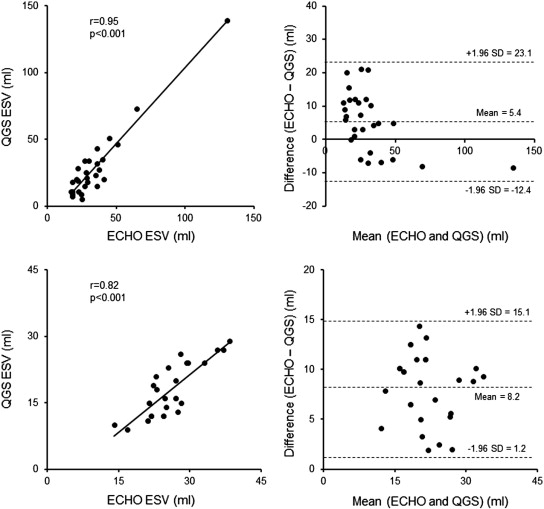
There were good correlations in EDV and ESV between echocardiography and QGS in patients with AS as well as control subjects (Fig. 1 ; Fig. 2). Bland–Altman plot for ESV showed a significant negative slope of − 0.51 in patients with AS.
|
|
|
Fig. 1. Correlation in left ventricular end-diastolic volume between echocardiography and quantitative gated SPECT in patients with aortic valve stenosis (upper panels) and control subjects (lower panels). |
|
|
|
Fig. 2. Correlation in left ventricular end-systolic volume between echocardiography and quantitative gated SPECT in patients with aortic valve stenosis (upper panels) and control subjects (lower panels). |
3.4. Correlations in left ventricular function
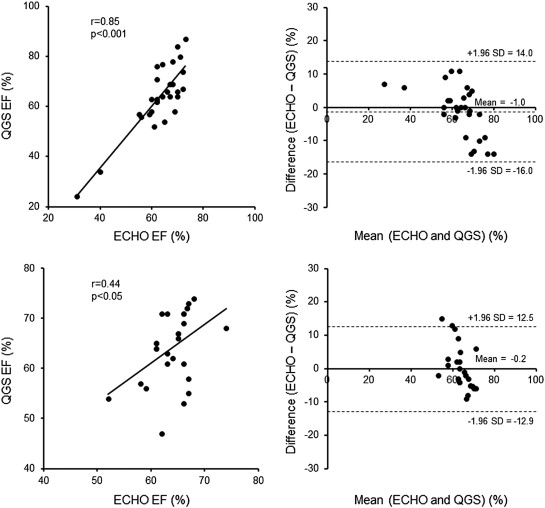
There was a good correlation in EF between echocardiography and QGS in patients with AS as well as control subjects (Fig. 3). However, Bland–Altman plots showed significant negative slopes of − 0.40 in patients with AS and − 0.74 in control subjects. In both groups, the difference in EF between the 2 methods was smallest in the median value, and increased when EF increased or decreased from the median value. This effectwas manifested in control subjects rather than patients with AS.
|
|
|
Fig. 3. Correlation in left ventricular ejection fraction between echocardiography and quantitative gated SPECT in patients with aortic valve stenosis (upper panels) and control subjects (lower panels). |
4. Discussion
In the current study, we demonstrated the following: 1) patients with AS had a larger LVM index and a larger EDV compared to control subjects; 2) there were good correlations in EDV and ESV between echocardiography and QGS even in patients with AS and 3) there was a good correlation in EF between the 2 methods even in patients with AS, but Bland–Altman plot for EF showed a negative proportional error.
Compared to technetium-99m (Tc-99m)-labeled agents, Tl-201 is considered to possess poor image quality due to its lower photon energy [13]. However, recent development of myocardial collimeters and its better physiological properties have resulted in a renewed interest in the use of Tl-201 for gated SPECT. Maunoury et al. showed good correlations in left ventricular volumes and function between Tc-99m sestamibi gated SPECT and Tl-201 gated SPECT [14]. We as well as other groups have shown that gated Tl-201 gated SPECT is a reliable method for assessing left ventricular volumes and function with good correlation when compared to echocardiography [7]; [8]; [9] ; [15]. However, there has been no report assessing its reliability in patients with AS.
AS is a representative condition of chronic left ventricular pressure overload, and causes LVH and left ventricular remodeling. Previous echocardiographic studies revealed that LVH with large RWT was the most common geometric pattern in this condition [16] ; [17]. In the current study, about half of patients had this geometric pattern, and our results were consistent with those of previous reports. The current study demonstrated that there were good correlations in left ventricular volumes between echocardiography and QGS even in patients with AS. However, Bland–Altman plot for ESV showed a negative proportional error. There is a known scatter of photons from myocardial walls to the left ventricular cavity [18]. Small left ventricular cavity may likely intensify the scatter problem, creating difficulties for the automatic QGS to define the endocardial surface properly. In the current study, patients with AS had various geometric patterns, and ESV widely ranged from 17.0 ml to 130.5 ml on echocardiography. Smaller ESV is likely to be more underestimated on QGS, possibly resulting in a negative proportional error. Previous studies demonstrated a good correlation in EF between echocardiography and QGS. However, most studies have only used Pearsons correlation coefficient for comparison between the 2 methods. The current study also showed a good correlation in EF between the 2 methods even in patients with AS, but Bland–Altman plot for EF showed a negative proportional error. In the current study, EF was negatively associated with EDV and ESV. Therefore, more underestimates of small ESV on QGS lead to less underestimate of preserved EF, and less underestimate of large ESV on QGS lead to more underestimate of depressed EF. This was the most possible reason causing a negative proportional error in EF. QGS is useful in assessing left ventricular volumes and function even in patients with AS, but cardiologists should recognize its specific characteristics.
There were several limitations in this study. First, this study included only patients with moderate to severe AS, and provided no information in patients with mild AS. Second, cardiac magnetic resonance is increasingly utilized for dynamic imaging with the expectation that will provide more accurate measurements of left ventricular volumes and function compared to echocardiography [19] ; [20]. However, it is expensive, and of limited availability. Finally, a small sample size was the major limitation of this study.
In conclusion, QGS is a useful method for assessing left ventricular volumes and function even in patients with AS, but cardiologists should recognize its specific characteristics.
Conflict of interest
The authors report no relationships that could be construed as a conflict of interest
References
- [1] K.D. Kennedy, R.A. Nishimura, D.R. Holmes Jr., K.R. Bailey; Natural history of moderate aortic stenosis; J. Am. Coll. Cardiol., 17 (1991), pp. 313–319
- [2] J.P. Dal-Bianco, B.K. Khandheria, F. Mookadam, F. Gentile, P.P. Sengupta; Management of asymptomatic severe aortic stenosis; J. Am. Coll. Cardiol., 52 (2008), pp. 1279–1292
- [3] B.R. Lindman, R.O. Bonow, C.M. Otto; Current management of calcific aortic stenosis; Circ. Res., 113 (2013), pp. 223–237
- [4] B. Lung, A. Cachier, G. Baron, et al.; Decision-making in elderly patients with severe aortic stenosis: why are so many denied surgery?; Eur. Heart J., 26 (2005), pp. 2714–2720
- [5] P. Varadarajan, N. Kapoor, R.C. Bansal, R.G. Pai; Clinical profile and natural history of 453 nonsurgically managed patients with severe aortic stenosis; Ann. Thorac. Surg., 82 (2006), pp. 2111–2115
- [6] K. Shibayama, H. Watanabe, M. Tabata, et al.; Impact of ejection fraction on long-term outcome after elective aortic valve replacement in octogenarians with aortic stenosis; Circ. J., 76 (2012), pp. 1761–1767
- [7] E. Cwajg, J. Cwajg, Z.X. He, et al.; Gated myocardial perfusion tomography for the assessment of left ventricular function and volumes: comparison with echocardiography; J. Nucl. Med., 40 (1999), pp. 1857–1865
- [8] C.D. Patel, M.R. Nadig, S. Kurien, S. Barai, R. Narang, A. Malhotra; Left ventricular ejection fraction and volumes on rest gated 201Tl perfusion SPECT: comparison with two-dimensional echocardiography; Nucl. Med. Commun., 27 (2006), pp. 425–429
- [9] D. Harpaz, A. Asman, R. Kuperstein, M. Boaz, P. Chouraqui; Left ventricular ejection fraction assessment by Tl-201 gated SPECT: a comparison with echocardiography; Clin. Cardiol., 33 (2010), pp. E56–E62
- [10] J.E. Otterstad, G. Froeland, M. St John Sutton, I. Holme; Accuracy and reproducibility of biplane two-dimensional echocardiographic measurements of left ventricular dimensions and function; Eur. Heart J., 18 (1997), pp. 507–513
- [11] R.M. Lang, M. Bierig, R.B. Devereux, et al.; Chamber Quantification Writing Group; American Society of Echocardiographys Guidelines and Standards Committee; European Association of Echocardiography. Recommendations for chamber quantification: a report from the American Society of Echocardiographys Guidelines and Standards Committee and the Chamber Quantification Writing Group, developed in conjunction with the European Association of Echocardiography, a branch of the European Society of Cardiology; J. Am. Soc. Echocardiogr., 18 (2005), pp. 1440–1463
- [12] G. Germano, H. Kiat, P.B. Kavanagh, et al.; Automatic quantification of ejection fraction from gated myocardial perfusion SPECT; J. Nucl. Med., 36 (1995), pp. 2138–2147
- [13] E.G. DePuey, S. Parmett, M. Ghesani, A. Rozanski, K. Nichols, H. Salensky; Comparison of Tc-99 m sestamibi and Tl-201 gated perfusion SPECT; J. Nucl. Cardiol., 6 (1999), pp. 278–285
- [14] C. Maunoury, C.C. Chen, K.B. Chua, C.J. Thompson; Quantification of left ventricular function with thallium-201 and technetium-99 m-sestamibi myocardial gated SPECT; J. Nucl. Med., 38 (1997), pp. 958–961
- [15] S. Kurisu, T. Iwasaki, H. Ikenaga, et al.; Influence of left ventricular geometry on thallium-201 gated single-photon emission tomographic findings in patients with known or suspected coronary artery disease; Ann. Nucl. Med., 28 (2014), pp. 120–127
- [16] P. Faggiano, C. Rusconi, G. Ghizzoni, T. Sabatini; Left ventricular remodeling and function in adult aortic stenosis; Angiology, 45 (1994), pp. 1033–1038
- [17] F. Antonini-Canterin, G. Huang, E. Cervesato, et al.; Symptomatic aortic stenosis: does systemic hypertension play an additional role?; Hypertension, 41 (2003), pp. 1268–1272
- [18] G. Germano, D.S. Berman; On the accuracy and reproducibility of quantitative gated myocardial perfusion SPECT; J. Nucl. Med., 40 (1999), pp. 810–813
- [19] N.G. Bellenger, M.I. Burgess, S.G. Ray, et al.; Comparison of left ventricular ejection fraction and volumes in heart failure by echocardiography, radionuclide ventriculography and cardiovascular magnetic resonance; are they interchangeable?; Eur. Heart J., 21 (2000), pp. 1387–1396
- [20] J. Greupner, E. Zimmermann, A. Grohmann, et al.; Head-to-head comparison of left ventricular function assessment with 64-row computed tomography, biplane left cineventriculography, and both 2- and 3-dimensional transthoracic echocardiography: comparison with magnetic resonance imaging as the reference standard; J. Am. Coll. Cardiol., 59 (2012), pp. 1897–1907
Document information
Published on 19/05/17
Submitted on 19/05/17
Licence: Other
Share this document
Keywords
claim authorship
Are you one of the authors of this document?


