1 Abstract
The main objective of this document is to present an idea of calibration tests used to improve an input material model in the DEM simulations in the D-DEMPack package programme in the Kratos application, which is developed in CIMNE. Presented method lets increase the precision and validity of discrete element modeling work.
The calibration tests presented in this protocol may be used for granular non-cohesive materials ( for loose, dry granular material). They concern only the sphere shape of particles. The tests were conducted on couple different sizes of particles, in this work are presented results for average diameter of grains equal to 5cm (normal distribution with standard deviation equal to 0,05).
The results of research may provide a basis for proper computing project data for preparing material model for loose, dry granular material. Tested by the author methods have been developed based on an article [1] .
2 Introduction
Physical characteristics are important in analyzing the behavior of grains flow in DEM simulations. Each analysis should start by gathering information about the tested material. The author believes that information which should be determined experimentally is distribution of particles sizes, bulk density angle of repose and friction angle between material and surfaces. Other data might be obtained from the literature.
In the literature we could find definitions and differences of bulk density and particle density. The bulk density is defined as the mass of many particles of the material divided by the total volume they occupy (includes particle volume, inter-particle void volume, and internal pore volume). The particle density (true density) is the density only of solids that make up the material.
Usually in the literature is given the bulk density, but DEMPack requires to provide the value of particle density. Particle density of real material is different than the modeled one (because of not ideal image of particles size and distribution in the model).
In the example presented in this protocol we would like to get bulk density equal to 2000 kg/m3. It is known that the particle density is higher than bulk density and therefore we started calculation for density amounting to 2500 kg/m3. This test required ones calculations – the relationship between the measured output and the parameter to be calibrated is linear.
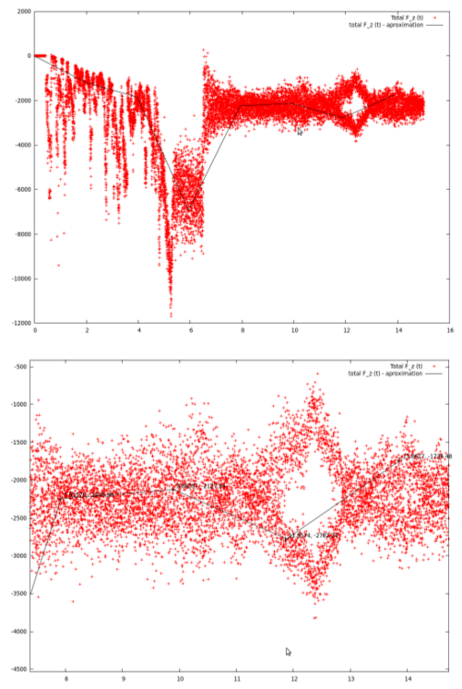
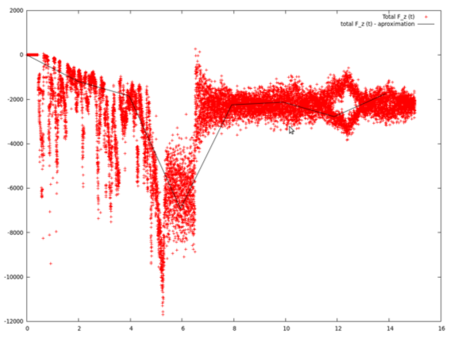
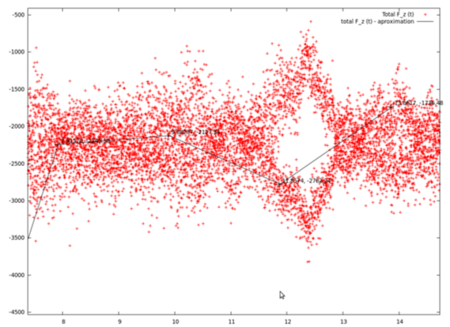
To obtain the total weight of all the particles in a box we used the function of printing force evolution with time. The easiest way to get the value of total force in z direction is creating a graph from data from “files_name_Graphs” folder. In this protocol Gnuplot data plotting program is used. Graphs below show the relationship of the force (z direction) and the time. Clearly fall of the force after 6,5 s is due to starting the function of bounding box.
In the Post-Process we have to read a value of a total force for Z direction. This amount divided by the acceleration of gravity used in the programme (g=9,81m/s) gave us the mass of particles in the box (). The chart above let us think that the particles were in constant motion, that is why approximated graph was used (black line).
The next step was to use the simple expression which determines the value of particles density we need to use in future calculations with the value of the received mass () and other fixed features used in the model. Presented formula was obtained from the relation between the densities:
searched particles density
real bulk density of the material
particels density used in the calculated model
mass obtained in the calculated model, mass of the particles in the box
volume of the box
It is know from the literature that for dry cohesionless granular material the angle of repose is a good indication of the internal friction angle. In practice that information let us use in this protocol the experimental value of angle of repose as a coefficient of friction for the DEM material.
To get a realistic behavior of material in simulations we must have an experimental value of the coefficient of friction between the DEM particles and surfaces (walls) that they will come in contact with. For calculations in the Kratos for Hertz Contact Laws the value of friction angle of the DEM-FEM wall is calculated as an average of real friction angle of a surface and friction angle of the DEM material.
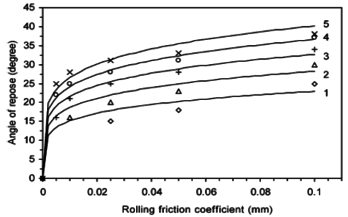
In the last test (poured angle of repose) the relationship between the measured output of an angle and the parameter to be calibrated (coefficient of rolling friction) is not linear – finding an accurate coefficient of rolling friction between DEM particles is an iterative process. Sample values and the nature of the graph are shown below. Figure below comes from a paper [6].
In order to ensure stability for the model, an upper limit is imposed on time step (called “delta time” in GID; Δt). On the other hand time step cannot be too low, because it significantly prolongs time of calculations. There are different approaches determining the value of time step but in this report estimating time is based on inter alia the information from [3].
Particles have associated DEM Material which defines density ρ, and also define particle’s Young’s modulus E. Rmin in the formula is the minimum radius of used particles.
Let us note at this place that not only used features have influence on assuring numerical stability. It happens that for reasonable results the lower various of time step than estimated should be used. However, the formula is a good approximation for radius bigger than 2cm, for smaller one it is recommended to reduce the value by forty percent.
3 Model and results
The first of two tests is bulk density test. DEMPack requires to provide the value of particle density. Particle density of real material is different than the modeled one (because of not ideal image of particles size and distribution in the model). The dimensions of the geometry in the test depended on the average diameter of the grains used in the model.
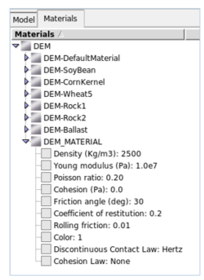
In the example presented in this report a real bulk density of considered material is equal to 2000 kg/m3. It is known that the particle density is higher than bulk density therefore the calculation started for density amounting to 2500 kg/m3. This test requires ones calculations – the relationship between the measured output and the parameter to be calibrated is linear. The figure below illustrated initial material parameters used in the example.
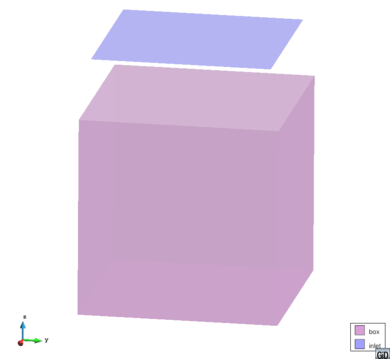
It was adopted to use as a geometry model one cubic container having a side length equal to 10*d, with the upper lid spaced at a distance not less than 2*d. In the protocol there is created a cubic box with side length equal to 0,5m (10·d=10·5cm=50cm), center of the base coincides with point (0.25,0.25,0). The next figure shows the result of correctly assigning DEM groups:
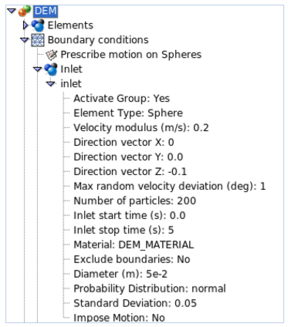
To generate the DEM particles in this report an inlet was used For – we had to create about 1,000 particles (for relatively small values of standard deviation of particles distribution).
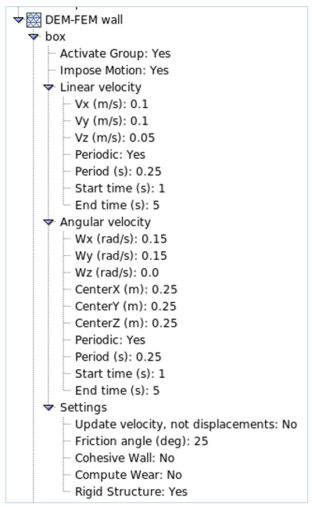
It is important to remember that the container during injection have to be vibrated – it lets to get more natural composition of particles in the box. In the example this was achieved through the use of periodic movement. The next figure shows the values of velocities:
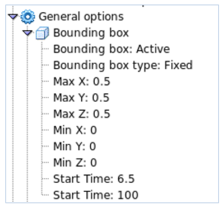
To remove all excess material from outside the container a function of bounding box was used. Start time should allow particles to reach a static equilibrium after filling (at least two seconds of pause after filling) and dimensions should be same as container’s.
For the first simulation with the value of particle density the following amount of time step was used:
For calculation, the number of was used. After receiving a new particle density the value of timestep was calculated again.
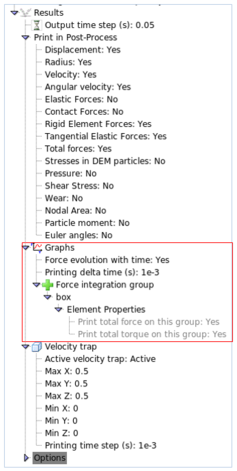
To obtain the total weight of all the particles in a box in Post Process the function of printing force evolution with time was used.
As it was mentioned in the Introduction we got the value of total force in z direction is creating a graph. Graphs below show the relationship of the force (z direction) and the time. Clearly fall of the force after 6,5 s is due to starting the function of bounding box.
In the Post-Process we read values of a total force for Z direction. This amount divided by the acceleration of gravity used in the programme (g=9,81m/s) gave us the mass of particles in the box (). The chart above let us think that the particles are in constant motion, that is way approximated graph was used (black line).
The next step was to determine the value of particles density we had to use in next calculations with the value of the received mass () and other fixed features used in the model:
The next step was calculation of friction angle if DEM-FEM wall. The presented example assumed that an amount for friction angle (measured experimentally) was equal to :
- 30° between the DEM particles
- 20° between the DEM particles and surfaces (walls) that they will come in contact with
The value of friction angel of DEM-FEM wall for use in the program was calculated as follows:
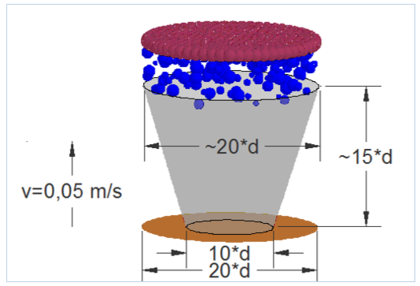
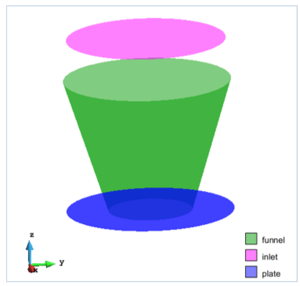
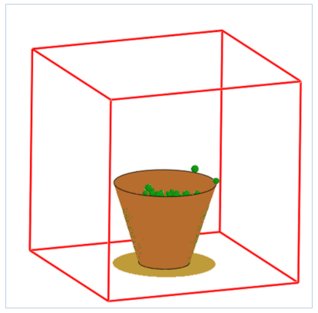
The second and the final test is Internal Friction Test – Poured Angle of Repose. The last test began with the creation of geometry as shown at the figure below (symbol “d” in dimensions means the average diameter of the grains used in the model).
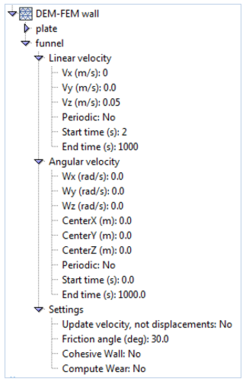
After generating DEM particles the cone had to start moving upward. It is important that the lifting speed could not be too high, as this might affect on the correctness of results. A funnel had only linear velocity (z direction), no angular one. Components from others groups did not move.
Next move was assigning properties to the “inlet” group. Properties of material were the same as in the first test (with new particle density!). It was proposed to generate around 1500 of DEM particles – it would let obtain proper result for higher values of angles of repose (greater amount of particles is needed).
Next step was creating a bounding box: to reduce the total time of calculations we had to create a limit of the bounding box just below the plate. For a starting moment for the bounding box it was=set t=0s. In figure below the boundaries of the box are marked in red color.
In this test, it was very important to select an appropriate time to allow particles to obtain stability. We suggest to set the whole time calculation of the high number (for example 60s) and monitor during the calculation current particle velocity results. The first situation was carried out for value of rolling friction equal to 0,1.
After obtaining a balanced model, next step was to measure the height of the cone (we knew the dimension of the plate) and then calculate the angle of repose. Measurement should be made at least two different views.
After comparing the results with the actual value of the rate of the coefficient of rolling friction we adjusted parameter (increased the coefficient of rolling friction by 0,05) and carry out the simulation again, until we achieve the desired accuracy between real and experimental angle of repose.
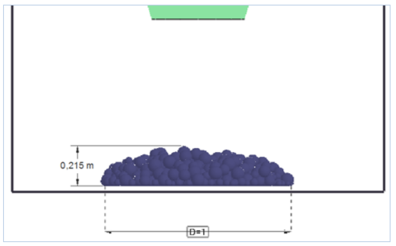
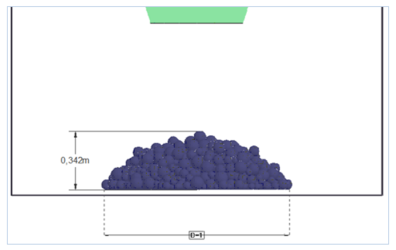
In the figures below rates of angle of repose for different values of coefficient of rolling friction.
4 Conclusions
The objective of presented calibration tests is to improve the precision of DEM simulations for granular non-cohesive materials. We believe that these calibration tests should be a starting point for all the DEM consulting works.
However, presented tests require several improvements. In the first test we measured weight of the container with a large approximation. We suggest the creation of additional functions in the DEMPack porgramme, which will allow to read a weight or volume of particles in the boundary box.
Furthermore, it is recommended to ensure which test method was used to measure the angle of repose – there are different methods of measuring and calculating the results.
5 Reference List
[1] Adrian Jansen, Kirk Fraser, George Laird, Improving the Precision of Discrete Element Simulations through Calibration Models, 13th International LS-DYNA Users Conference
[2] Y. C. Zhou, B. H. Xu, and A. B. Yu, Numerical investigation of the angle of repose of monosized spheres
[3] https://yade-dem.org/doc/formulation.html
[4] Andrew Phillip Grima Peter Wilhelm Wypych, (2011),"Discrete element simulations of granular pile formation", Engineering Computations, Vol. 28 Iss 3 pp. 314 - 339
[5] A.P. Grima, P.W. Wypych, Investigation into calibration of discrete element model parameters for scale-up and validation of particle–structure interactions under impact conditions
[6] Zhou, Y.C. Xu, B.H., Yu, A.B., and Zulli, P. 2002. An experimental and numerical study of the angle of repose of coarse spheres. Powder Technology 125, 45–54
[7] Li YJ, Xu Y, Thornton C. A comparison of discrete element simulations and experiments for ‘sandpiles’ composed of spherical particles. Powder Technol 2005;160:219–28.
[8] Hiroshi Nakashima, Yasuyuki Shioj, Taizo Kobayashi, Determining the angle of repose of sand under low-gravity conditions using discrete element method
[9] Mahaveer D. Kurkuri, Cooper Randall, Dusan Losic, Determining the angle of repose of sand under low-gravityn conditions using discrete element method
[10] Fraczek, J., Zlobecki, A. et al. (2007). “Assessment of angle of repose of granular plant material using computer image analysis.” Journal of Food Engineering, 83: 17-22.
[11] Zhichao Liu, MEASURING THE ANGLE OF REPOSE OF GRANULAR SYSTEMS USING HOLLOW CYLINDERS
[12] Zamri Chik and Luis E. Vallejo, Characterization of the angle of repose of binary granular materials
[13] J. M. Boac, M. E. Casada, R. G. Maghirang, J. P. Harner III, MATERIAL AND INTERACTION PROPERTIES OF SELECTED GRAINS AND OILSEEDS FOR MODELING DISCRETE PARTICLES
[14] Mical Wiliam Johnstone, Calibration of DEM models for granular materials using bulk physical test
Document information
Published on 01/01/2015
Licence: CC BY-NC-SA license
Share this document
Keywords
claim authorship
Are you one of the authors of this document?
