Abstract
This paper aims to investigate the changes in the virtual perception on the built heritage at the traditional core settlement of Kumbakonam Town at Tamilnadu and to analyze their implications. Specifically, the major objectives of the study are (1) to identify the architectural elements that manifest the built heritage of Kumbakonam Town and (2) to assess the contributions of these elements to the changes in the visual perception of the town. To achieve these objectives, this study adopts an empirical model that analyzes the architectural elements of the buildings in the study area. Direct observations and documentations of 373 buildings are collected to analyze those elements that contribute to the changes in the visual perception on the built heritage of Kumbakonam Town. An ordinary regression model is used to examine the characteristics of the built heritage across the chariot processional route of the town. Several architectural elements, including pilasters, horizontal cornices, arched windows, and ornamental parapets, improve the image of the town. These empirical findings support the policy framework that enhances the visual perception of Kumbakonam Town.
Keywords
Visual perception ; Built heritage ; Ordinal regression ; Architectural elements ; Historic town
1. Introduction
Born out of their deep-rooted heritage, historic towns all over the world have evolved into spaces for immortals. Built heritage is more than stone and mortar; these spaces represent the lifestyles, cultures, and traditions that are being passed across generations. Most historic towns exhibit townscape qualities and a great scope for learning the planning concepts (Gast, 2007 ). The physical elements of these towns, including their streetscapes and skylines, add to their beauty, their history, and the sense of belonging of their inhabitants (Lynch, 1960 ). Over the years, the history of these towns has become a symbol of their image, which generally reflects the elements of imperial architecture.
Historical towns have confronted new challenges and changes over the last few decades. Their monuments, sacred precincts, processional streets, and public squares are all endowed with moonstones and have remained in obscurity. Increasing the number of ubiquitous buildings and insensitively modifying the heritage buildings beyond recognition can make these historic towns look identical. Significantly changing these towns and their heritage only decay their transformation (Feilden and Jokilehto, 1998 ). The historical town of Kumbakonam is no exception. This town has colorful gopurams that point to the sky and serve as a reminder that Kumbakonam was previously considered a center of medieval South Indian power (Nanda, 1996 ). The visual perception of this town is reflected in its architectural elements. Silva (2006) argued that given the limited visual perception of historic towns, particularly on their physical elements, special preservation programs must be launched to improve the image of these areas. Therefore, an empirical study on the historic town of Kumbakonam must be performed to understand the significance of the architectural elements of their built heritage.
This paper aims to examine the significance of the visual perception on the built heritage of Kumbakonam Town. The main objectives of this paper are (1) to identify the architectural elements that manifest the built heritage of Kumbakonam Town and (2) to assess the contributions of these elements to the changes in the visual perception of the town. Direct observations and documentations of 373 buildings are collected to analyze the architectural elements that may contribute to the visual perception of the town. An ordinal regression model is adopted to achieve the aforementioned objectives. This study also discusses various conceptions of visual perception, forecasts its significance, and suggests improvements in the current policy framework.
This paper is divided into six segments. Section 2 describes Kumbakonam Town and its heritage settings. Section 3 presents the study area, the conceptual framework, and the methodology for the empirical study. Section 4 presents the empirical study, highlights the significance of the ordinal regression model, and discusses the dependent and independent variables. Section 5 presents and discusses the results. Section 6 concludes the paper.
2. Kumbakonam town
2.1. Profile
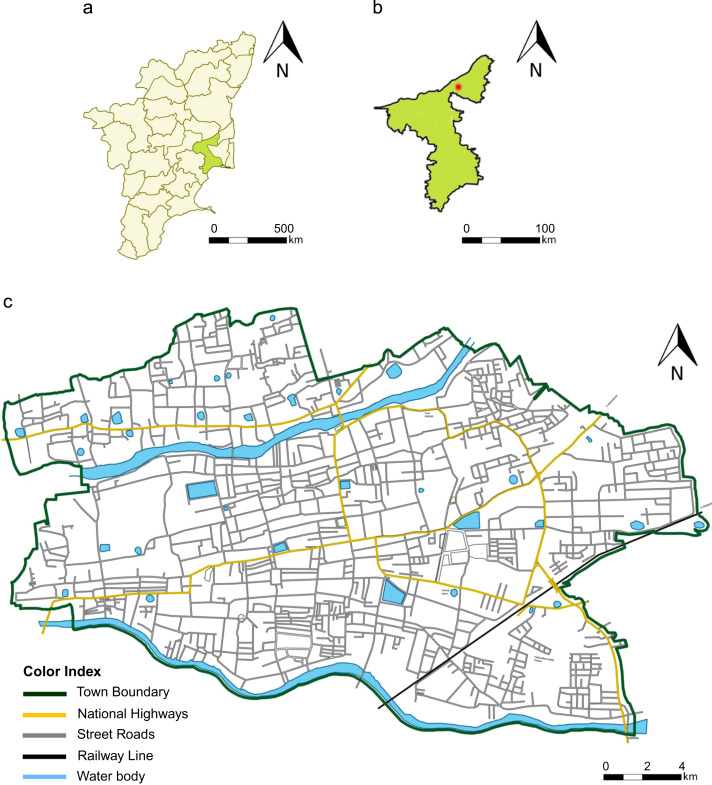
Located 10°57′N latitude and 79°23′ longitude, Kumbakonam Town is a river-edge settlement in Tamilnadu, India. Figure 1 shows a map of the town, its districts, and location. The town is bounded by two rivers, namely, the Cauvery River to the north and the Arasalar River to the south. Kumbakonam Town has a gentle slope from the north to the south. With more than 188 temples scattered throughout the area (Conversion of City, 2007 ), Kumbakonam Town also serves as a religious center in the region. The town is famous for its Mahamaham festival, which is celebrated once every 12 years.
|
|
|
Figure 1. (a) Tamilnadu State map showing Thanjavur District; (b) Thanjavur District map showing Kumbakonam Town; (c) Kumbakonam Town map. |
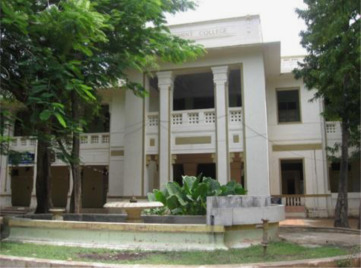
Kumbakonam Town has large-scale agricultural, trading, and commercial activities. The town has a large silk weaving segment and is famous for its Thirupuvanam sarees. Since the ninth century, Kumbakonam Town has been famous for its crafts, including textiles, sculptures, bronze casting, brassware, and gold jewelry, which also contribute to its commercial prosperity (Hunter, 1908 ). The town has also become a center of scholarship and was previously called the “Cambridge of South India” (Nanda, 1996 ). The brilliance of its scholars has been widely acknowledged since the 20th century. One of the oldest educational institutions in Tamilnadu established in 1867 is also located in Kumbakonam Town (Figure 2 ).
|
|
|
Figure 2. Government Arts College, Kumbakonam. |
2.2. Heritage and historic settings
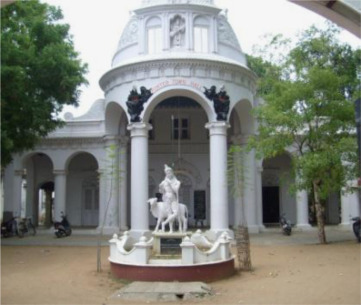
Kumbakonam Town occupies a unique position in Hindu mythology because of its invaluable inscriptions, iconography, and religious architecture. The town highly articulates cosmic geography and idiosyncrasy in its urban structure. The urban configuration of the town, such as its temples, tanks, civic buildings, religious institutions, Brahmin elite, arts, and crafts, contributes to the urban Tamil culture. The urban fabric of the town, including its temples, chattrams, matams, agraharams, and paditorais, has made Kumbakonam one of the best surviving ancient Tamil towns. Given its complex evolution, Kumbakonam Town has achieved an esteemed position among other temple towns in India (Nanda, 1996 ) (Figure 3 ).
|
|
|
Figure 3. Porter Town Hall, Kumbakonam. |
The town has become a popular pilgrimage center over the past centuries. The two holy tanks of Kumbakonam, namely, Mahamaham tank (Figure 4 ) and Pottramarai, are recognized as the most sacred and beautiful tanks in India and have been associated with Hindu mythology (Ayyar and Jagadisa, 1920 ). Possibly the best sacred and ancient temple town in India, Kumbakonam is one of the few remaining old settlements in the country where ancient rituals and traditions remain intact (Ring et al., 1996 ). The infrastructure of Kumbakonam Town can be traced back to its Chola origins over a thousand years ago. The 15–17th centuries Vijayanagara Nayaka compilations as well as the 18th century Maratha intervention elegantly manifest the history and heritage of the town (Kathleen, 1981 ). Cholas, Pandyas, Krishnadevaraya, and Nayakas ruled Kumbakonam Town until the British colonization, and these periods have considerably affected the heritage settings of the town.
|
|
|
Figure 4. Mahamaham Tank with AbhiMukheswarar Temple. |
2.3. Mahamaham festival
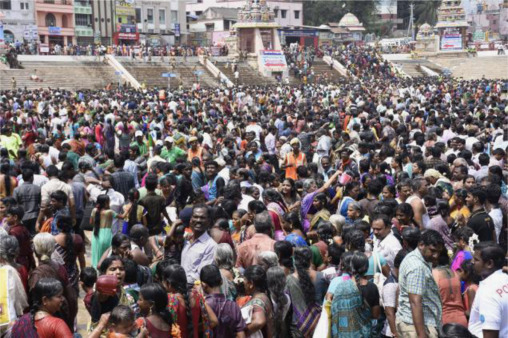
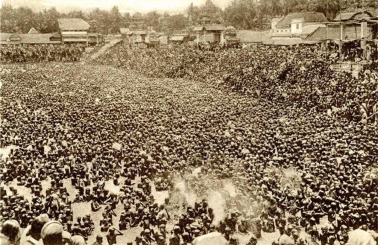
The Mahamaham Festival in Kumbakonam Town is similar to the Kumbha Mela Festival in North India. This festival happens once every 12 years in either February or March. The last festival was celebrated on 22 February 2016 (Figure 5 ), during which 0.1 million people participated in the holy bath. The date of the festival is decided based on certain astrological positions, such as full moons, the conjunction of the sun in Aquarius with Jupiter, and the conjunction of the moon in Leo (the Mahamaham star), which is considered very auspicious (Bansal, 2008 ). The origins of this festival can be traced back to the 13th century. Figure 6 shows one of the earliest photos of the festival. During Nayaka, the Mahamaham tank was reconstructed with 16 elegant pavilions and steps descending into the water (Vriddhagirisan, 1995 ). The Mahamaham tank is currently located at the town center, has 21 wells, and has an area extending to 6.2 acres. Among these wells, nine represent the Holy River that flows across India, while the other wells are named after their associated deities. The divinity of the tank has been associated with the complex mythology and creation myth of the town. Hindus strongly believe that taking a bath in this tank during the Mahamaham Festival will absolve them of their sins (Gajarani, 2004 ).
|
|
|
Figure 5. Mahamaham Festival on 22nd Feb 2016. |
|
|
|
Figure 6. Thousands of people take the holy dip at the Mahamaham tank at Kumbakonam in Tamil Nadu, India during the Mahamaham Festival, known as the Kumbamela of South India. Mahamaham is performed once in 12 years (source: Wiele and Klein, Madras). |
2.4. Land use
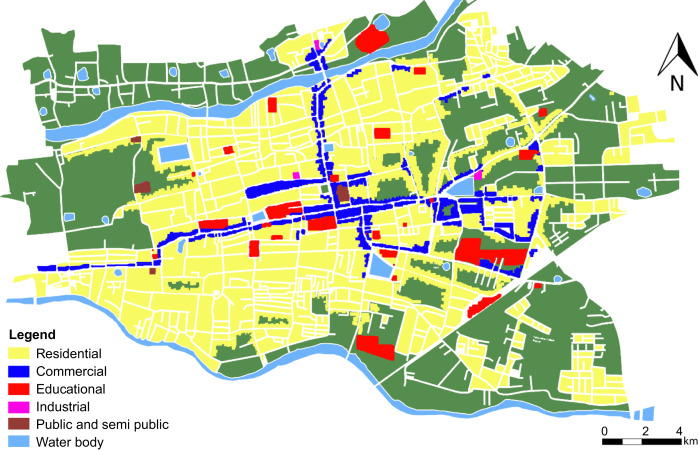
Kumbakonam is a special grade municipal town and the second largest town in the Thanjavur district in terms of its administrative status. The town comprises 45 wards and covers an area of 12.58 sq. km. The robust characteristics of this town have been regularly associated with the similarity in its land use or development patterns (Figure 7 ). Table 1 presents the land use pattern in Kumbakonam Town. The land use in this area is generally residential, with the commercial activities primarily located in the town center and along the highways, Bazaar Street, TSR Big Street, Nageshwara Koil Street, and Mahamaham tank precincts. The public and semi-public zones are located in the traditional core of the town along with temples, tanks, schools, and the town hall. The government offices and institution buildings are located to the east, where new buildings are also being developed.
|
|
|
Figure 7. Land use in Kumbakonam town. |
| S.no | Land use type | Area (in Ha) | % of total | |||||
|---|---|---|---|---|---|---|---|---|
| 1 | Residential | 403.68 | 32.09 | |||||
| 2 | Commercial | 34.61 | 2.75 | |||||
| 3 | Industrial | 15.27 | 1.21 | |||||
| 4 | Public and semi public | 81.48 | 6.48 | |||||
| 5 | Roads | 125.44 | 9.97 | |||||
| 6 | Vacant | 17.18 | 1.37 | |||||
| 7 | Miscellaneous | 17.75 | 1.41 | |||||
| 8 | Non-Urban areas | 562.61 | 44.72 | |||||
| Total | 1258.00 | 100 | ||||||
Architectural style, scale, mass, overall pattern, texture, building type, use, activity, and inhabitants that can be seen throughout Kumbakonam reflect the physical characteristics of the town. Most of the organized residential neighborhoods demonstrate the similar development patterns that can be seen in the traditional core of the town, including their street lights, lot sizes, building façades, and building scales. The architectural style, the similarity in land use patterns, and the arrangement of these characteristics in terms of their harmony, homogeneity, and order altogether improve the image of Kumbakonam Town.
3. Methods and data
3.1. Study area
The heritage areas of Kumbakonam Town comprise temples and sacred temple tanks. The temples include the Adi Kumbeswarar Temple, Sarangapani Temple, Someshwara Temple, Nageswaran Temple, Kasi Vishwanath Temple, and Chakrapani Temple, while the sacred tanks include the Porthamarai Theertham and Mahamaham tanks (with the latter being famous for its Mahamaham Festival held every 12 years). Nanda (1996 ) showed that the sacred and royal configuration of Kumbakonam, as reflected in its royal temples and holy tanks, has made this town one of the earliest settlements of the Chola kings.
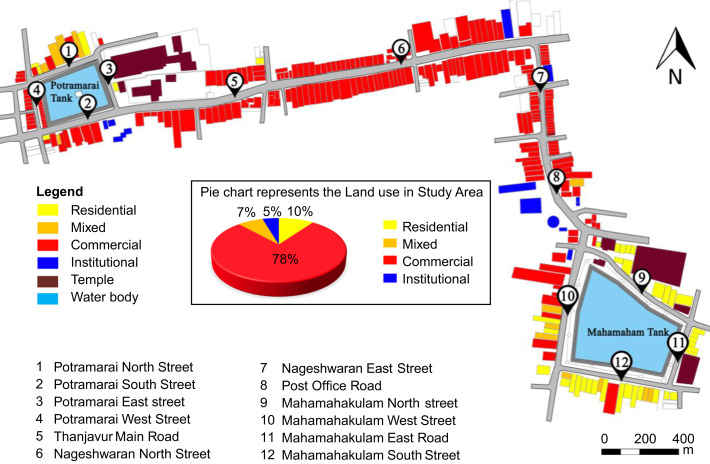
The study area (Figure 8 ) connects two sacred tanks (Mahamaham tank and Porthamarai Theertham) and acts as the major commercial corridor of the town. This stretch also serves as a processional route where chariots travel through to reach prominent temples. The major developments and land use patterns in Kumbakonam have been observed along this stretch.
|
|
|
Figure 8. Land use of the study area in Kumbakonam Town along with the streets name. |
3.2. Conceptual framework
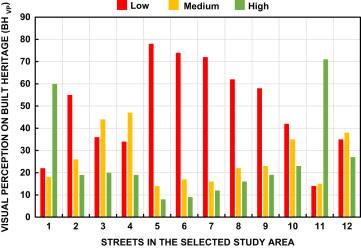
The rulers of Kumbakonam have conceived, or at least developed, an architectural paradigm that visually expresses their ambitions of creating an extensive and powerful state. Their structures are unprecedented in terms of scale and architectural clarity; the larger examples may be characterized as truly imperial in style (Champakalakshmi, 1979 ). Therefore, the image of Kumbakonam and its elements reflects the character of the entire town. These elements have been undergoing a rapid transitional and disappearing process since the past few decades. Figure 9 shows the variations in the level of visual perception on the architectural elements of the built heritage ( ) in each street. Such continuous change in the townscape is inevitable.
|
|
|
Figure 9. Graph showing the level of visual perception of the study area of Kumbakonam Town. |
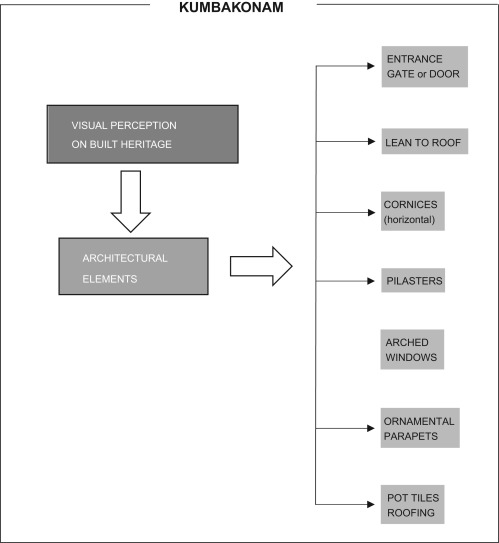
Figure 10 shows the conceptual framework and the identified architectural elements. The visual perception of towns is subjected to various components. This study proposes a conceptual framework by defining the visual perception level on the architectural elements of the built heritage at the traditional processional route of Kumbakonam Town.
|
|
|
Figure 10. Conceptual framework of visual perception of Kumbakonam Town on its Built Heritage. |
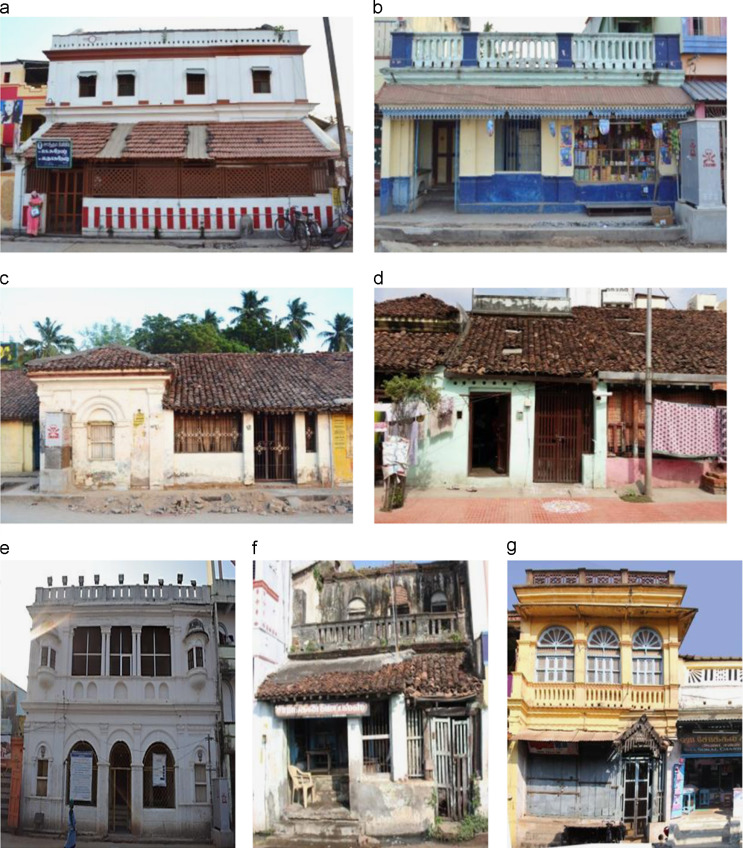
This study reviews how some architectural elements, such as entrance gates or doors, lean-to rooves, horizontal cornices, pilasters, arched windows, ornamental parapets, and pot tiled roofing, influence the visual perception on the built heritage of Kumbakonam Town (Figure 11 ). The architectural elements of the buildings in all 12 selected streets are documented.
|
|
|
Figure 11. Building images with architectural elements. (a) and (b) at Mahamahakulam South Street; (c) and (d) at Mahamahakulam West Street; (e) and (f) at Mahamahakulam East Street; (g) Pottramarai North Street. |
3.3. Methodology
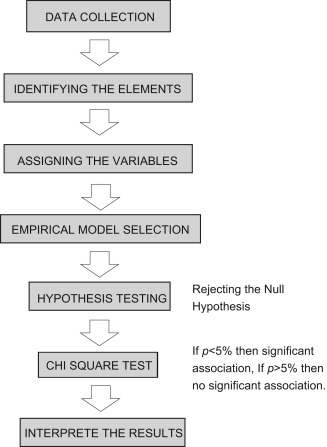
A total of 373 buildings were documented from the study area, which comprises 12 streets. Each building was photographed for reference. The architectural elements of these elements were identified and considered as primary sources of information. The identified architectural elements were used as variables, and the study was followed with an empirical analysis. To check if the variables were related, the null hypothesis and the assumed relationship between the independent (X1 –X7 ) and dependent ( ) variables were rejected. The analysis results describe the contribution of each variable to the effects of the dependent variable. The empirical analysis is presented conceptually in Figure 12 .
|
|
|
Figure 12. Schematic flow chart of the empirical analysis. |
4. Empirical analysis
4.1. Variables
Seven variables were used to describe the contributions of the architectural elements to the visual perception of Kumbakonam Town. The direct observations and documentations of 373 buildings in 12 selected streets were used in the analysis. Both dependent and independent variables were used to analyze the visual perception of Kumbakonam Town.
4.2. Dependent variable
depicts the visual perception level on the built heritage of Kumbakonam Town. This dependent variable can be calculated as follows:
|
|
( 1) |
where denotes the level of visual perception on the built heritage in the processional route of Kumbakonam Town, denotes the number of buildings with a heritage value located along this route, and denotes the total number of buildings along this route.
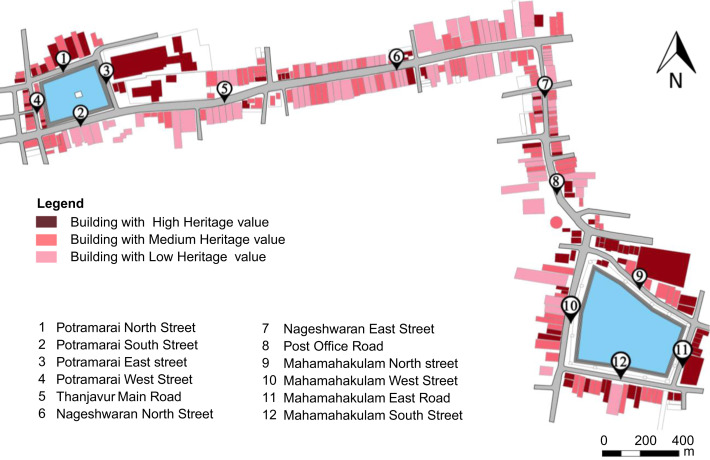
The dependent variable was expressed as an ordinal number to account for the standard deviation of the mean of all observations. The selected streets were classified as follows according to their visual perception level (Figure 13 ):
- Category 1: Streets with low visual perception.
- Category 2: Streets with medium visual perception.
- Category 3: Streets with high visual perception.
|
|
|
Figure 13. Level of visual perception in the study area of Kumbakonam Town. |
4.3. Independent variables used in the regression model
- Entrance Gate or Door (X1): A decorated entrance, gate, or door that marks the transition from the public exterior to the private interior space (Ernest, 2008 ).
- Lean-To Roof (X2): A hipped roof with a gable end and lean-to projection. This roof is added to an existing building to address a new need (Haneman, 1984 ).
- Horizontal Cornices (X3): A molded or decorated projection that forms the crowning feature of the top of a building wall or other architectural element by extending any similar crowning and projecting element. Cornices also refer to any projection on a wall that throws rainwater off the face of a building.
- Pilasters (X4): A partial pier or column, often with a base and capital, that is slightly projected and embedded on a flat wall (Ernest, 2008 ).
- Arched Windows (X5): The bottom half of an “arched” or “radius” window is rectangular, while its top is an arch or a half circle. Arched windows bring a sense of softness to a room and juxtapose the straight corners of rectangular windows and walls for a contrasting effect.
- Ornamented Parapets (X6): A low protective wall or railing that is placed as an architectural element above cornices and along the edge of a raised platform, terrace, bridge, roof, or balcony. These parapets are often decorated and incorporated into the existing design (Ernest, 2008 ).
- Pot tiles roofing (X7): The external covering on the top of the building that usually comprises wooden rafters, pot tiles, or countryside tiles placed on pitched slopes or vertical built-up membranes for flat roofs.
4.4. Selection of empirical model
The relationship between the architectural elements and visual perception of Kumbakonam Town is assessed using an ordinal regression model in SPSS. An ordinal regression is performed to predict the dependent variable with “ordered” multiple categories and independent variables. The regression facilitates the interaction of dependent variables (with multiple ordered levels) with one or more independent variables (Norusis, 2004 ). Previous studies have examined how the sense of a place can be judged based on its location. For instance, Boereback (2012 ) assessed the relationship between shopping locations and sense of place in the Netherlands, while Minetos and Polyzos (2010) discussed some applications related to change in land use and urban sprawl. Both of these studies applied ordinal and multinomial regression models.
Ordinal logistic regression can forecast or reveal how the changes in the independent variables can affect the dependent variable (Frank and Harrell, 2001 ). This approach has been used to analyze visual perception levels (low, medium, or high) when these levels cannot be represented by a continuous variable or proxy. The ordinal logistic regression model can be constructed using five types of link functions based on the acceleration of the cumulative probability of the response variable (Norusis, 2004 ). Given that the dependent variable in this study has an equal category, the Logit link is applied.
The general ordinal regression models in the Logit link function can be expressed as follows:
|
|
( 2) |
and
|
|
( 3) |
where is the Logit link, the link index j denotes the visual perception level (low, medium, or high), denotes the cumulative response probability up to and including Y =j, Yi denotes the response variable for observations i =1…n, k denotes the predictor variable associated with the observed changes in the dependent variable, α is the intercept of the regression equation or threshold for each cumulative probability, and k is the coefficient of the predictor variables or locations of the model. The threshold α and the regression coefficient βk are unknown parameters to be estimated using the maximum likelihood algorithm.
4.5. Model fitting information
In statistics, the parallel lines assumption must be observed when using the ordinal logistic regression model. This assumption posits that the regression coefficients are the same for all corresponding outcome categories. If the parallel lines test fails, then the multinomial regression model can be used as an alternative model. Table 2 presents the parallel lines test in which the assumptions of the regression coefficients are the same for all the outcome categories. The chi-square in this model is statistically significant (0.25>0.05). Therefore, the assumption of parallelism cannot be rejected. We maintain the null hypothesis that the local parameters are the same across different response categories.
| Model | −2 log likelihood | Chi-square | df | Sig. |
|---|---|---|---|---|
| Null hypothesis | 21.758 | – | – | – |
| General | 11.893b | 9.865c | 7 | 0.000 |
The null hypothesis states that the location parameters (slope coefficients) are the same across response categories.
a. Link function: Logit.
b. The log-likelihood value cannot be further increased after maximum number of step-halving.
c. The Chi-Square statistic is computed based on the log-likelihood value of the last iteration of the general model. Validity of the test is uncertain.
Table 3 shows the Pearson׳s correlation coefficients and goodness-of-fit indices. A large number of empty cells was obtained because several continuous dependent variables were used (the output of the model warned that 24 or 66.7% of the cells had zero frequencies). Therefore, we should not depend on these variables. Given the very low significance level in the overall model test, the intercept-only model does not function well with the predictors. However, when some cells have small observed and predicted counts, the overall model test is considered important because the change in likelihood demonstrates a chi-square distribution (Norusis, 2004 ). The pseudo R-square measures indicate the success of a model by describing the variations in the data, which in turn signify the strength of the association between the dependent and independent variables. As illustrated by the pseudo R-square values in Cox and Snell (0.354), Nagelkerke (0.437), and McFadden (0.262), the values of pseudo R-square measures are always lower than the R-square of a linear regression model (Norusis, 2004 ). Therefore, the selected model for the regression analysis rejects the null hypothesis H0 , thereby indicating that the model is statistically significant.
| Model | −2 log Likelihood | Chi-square | df | Sig. | |
|---|---|---|---|---|---|
| Intercept only | 24.274 | ||||
| Final | 21.758 | 2.516 | 7 | 0.000 | |
| Pseudo R-square | Goodness-of-fit | ||||
| Cox and Snell | 0.354 | Chi-square | df | Sig. | |
| Nagelkerke | 0.437 | Pearson | 46.139 | 30 | 0.000 |
| McFadden | 0.262 | Deviance | 37.714 | 30 | 1.000 |
a. Link Function: Logit.
The confusion matrix in Table 4 shows the predictive ability of the empirical model. In the first category of low visual perception, the model correctly assigned 100% of the cases. In the second category of medium visual perception, the model correctly assigned 3 out of 4 or 66.7% of the cases. In the last category of high visual perception, the model correctly assigned 1 out of 2 or 50% of the cases. Therefore, the confusion matrix that is obtained by the cross-tabulated rating of the predicted response category is very high at the first and second categories.
| Level of Visual Perception | Predicted response category | Total | |||
|---|---|---|---|---|---|
| Low | Medium | High | |||
| Low | N | 6 | 0 | 0 | 6 |
| % | 100%a | 0% | 0% | 100% | |
| Medium | N | 1 | 3 | 0 | 4 |
| % | 33.3% | 66.7% | 0% | 100% | |
| High | N | 0 | 1 | 1 | 2 |
| % | 0% | 50% | 50% | 100% | |
| Total | N | 7 | 4 | 1 | 12 |
| % | 58.3% | 33.3% | 8.4% | 100% | |
a. Percentage of correctly assigned cases by the model.
5. Results and discussion
Table 5 presents the parameter estimates, standard errors, wald, significance levels, and lower and upper bounds of the 95% confidence interval. The threshold estimate for [ =1.00] is the cutoff value between the low and medium while the threshold estimate for [ =2.00] is the cutoff value between the medium and high . The estimate represents the ordered log-odds (logit) regression coefficient. The ordered logit coefficient indicates that for a one-unit increase in the independent variable, the dependent variable level is expected to change by its corresponding regression coefficient in the ordered log-odds scale when the other independent variables in the model are kept constant. The positive signs of the regression coefficient indicate that those streets with more architectural elements (X1 , X2 ,.., X7 ) are more likely to present a high visual perception level. The significance level of the seven architectural elements, except for X5 , has a positive regression coefficient and p -value (sig.) of <0.05. Therefore, these architectural elements greatly affect the visual perception on the built heritage of Kumbakonam Town. The case summary of the model ( Appendix A ) describes the visual perception levels of the 12 streets in the study area. The low visual perception level of certain streets may be attributed to their lack of built heritage or prevalence of modern construction without any architectural elements.
| Estimate | Std.error | Wald | df | Sig. | 95% confidence interval | ||
|---|---|---|---|---|---|---|---|
| Lower bound | Upper bound | ||||||
| Threshold | |||||||
| [1] | 5.952 | 0.8928 | 44.445 | 1 | 0.015 | 4.202112 | 7.701888 |
| 2] | 8.312 | 0.9974 | 69.450 | 1 | 0.001 | 6.3570 | 10.2669 |
| Location | |||||||
| X1 | 1.052 | 0.2419 | 18.912 | 1 | 0.012 | 0.5778 | 1.5261 |
| X2 | 0.621 | 0.1428 | 26.915 | 1 | 0.001 | 0.34112 | 0.9008 |
| X3 | 0.373 | 0.1231 | 9.1812 | 1 | 0.022 | 0.131724 | 0.6142 |
| X4 | 0.466 | 0.1072 | 4.3470 | 1 | 0.036 | 0.255888 | 0.676112 |
| X5 | 0.332 | 0.1527 | 2.1741 | 1 | 0.061 | 0.032708 | 0.631292 |
| X6 | 0.741 | 0.1333 | 5.5588 | 1 | 0.029 | 0.479732 | 1.00226 |
| X7 | 0.742 | 0.1630 | 4.5460 | 1 | 0.038 | 0.42252 | 1.06148 |
a. Link function: Logit.
6. Conclusions
The significance of architectural elements on the heritage of Kumbakonam Town has been empirically analyzed. The influence of each architectural element on built heritage is assessed using an ordinal logistic regression model. These architectural elements are strongly associated with the visual perception of the town. The presence and absence of an architectural element correspond to a significant change in visual perception level. The low visual perception of streets located in traditional historic areas indicates that the characteristics of Kumbakonam are gradually deteriorating. The development of urban infrastructures, the dismantling of heritage structures, the changing building use patterns, the adoption of new architecture styles, and the lack of policy and guidelines for protecting built heritage create a negative background for built heritage. Considering its architectural heritage and cultural significance, Kumbakonam Town requires a proper policy framework for preserving and conserving its built heritage. Before constructing such framework, the significance of the architectural elements of the town must be investigated in detail. The findings of this study may initiate further research into the architectural elements of built heritage and improve the policy framework for preserving the built heritage of Kumbakonam Town.
Appendix A
| Case summary | |||
|---|---|---|---|
| N | Marginal Percentage | ||
| Low | 6 | 50% | |
| Medium | 4 | 33.3% | |
| high | 2 | 16.7% | |
| Valid | 12 | 100% | |
| Missing | 0 | ||
| Total | 12 | ||
The outcome variable in this regression is represented by , which contains a numeric code for the level of visual perception on built heritage. N denotes the number of observations or streets in the study area, while the marginal percentage denotes the proportion of valid observations in each visual perception level (low, medium, or high) of .
References
- Ayyar and Jagadisa, 1920 Ayyar, P.V. Jagadisa; South Indian Shrines Illustrated, Asian Educational Services, New Delhi (1920) (ISBN 81-206-0151-3)
- Bansal, 2008 Sunita Pant Bansal; Hindu Pilgrimage: A Journey Through the Holy Places of Hindus All Over India, Hindology Books, Delhi (2008) (ISBN 978-81-223-0997-3)
- Boereback, 2012 J.J. Boereback; Sense of Place; Attachment to, Identity With and Dependence of Shopping Locations (thesis); Eindhoven University of Technology, Real Estate Management and Development (2012)
- Champakalakshmi, 1979 R. Champakalakshmi; Growth of urban centres in South India: Kudamukkupalaiyarai, the twin city of the Cholas; Stud. Hist., 1 (1979), pp. 1–31
- Conversion of City, 2007 Conversion of City, 2007. Corporate Plan to Business Plan for Kumbakonam municipality-TNUIFSL (PDF) (Report). Commissioner of Municipal Administration, Government of Tamil Nadu. Retrieved 2012-11-16.
- Ernest Burden, 2008 Ernest, Burden, 2008. Elements of Architectural Design: A Photographic Sourcebook, 2nd Ed.. ISBN: 978-0-471-37117-5.
- Feilden and Jokilehto, 1998 B.M. Feilden, J. Jokilehto; Management Guidelines for World Cultural Heritage Sites, ICCROM, Rome (1998)
- Frank and Harrell, 2001 E. Frank, Harrell; Regression Modeling Strategies with Applications to Linear Models, Logistic and Ordinal Regression, and Survival Analysis; Springer Series in Statistics (2001) (ISBN 978-3-319-19424-0)
- Gajarani, 2004 S. Gajarani; History, Religion and Culture of India, 3, Isha Books, New Delhi (2004) (ISBN 81-8205-061-8)
- Gast, 2007 Klaus-Peter Gast; Modern Traditions: Contemporary Architecture in India; Birkhauser Basel (2007) (ISBN 3764382988, 9783764382988)
- Gough, 1981 Kathleen Gough; Rural Society in Southeast India; Cambridge University Press (1981)
- Haneman, 1984 John Theodore Haneman; Pictorial Encyclopedia of Historic Architectural Plans, Details and Elements: With 1880 Line Drawings of Arches, Domes, Doorways, Facades, Gables, Windows, etc, Dover Publications (1984)
- Hunter, 1908 Sir William Wilson Hunter; The Imperial Gazetteer of India 1908, 16, Clarendon Press (1908)
- Lynch, 1960 K. Lynch; The Image of the City, The MIT Press, Cambridge, MA (1960)
- Minetos and Polyzos, 2010 D. Minetos, S. Polyzos; Deforestation processes in Greece: a spatial analysis by using an ordinal regression model; For. Policy Econ., 12 (2010), pp. 457–472
- Nanda., 1996 V. Nanda; Cambridge Kumbakonam Project: the ritual topography of Kumbakonam; Arch. Des., 124 (1996), pp. 30–34
- Norusis, 2004 M. Norusis; SPSS 13.0 Advanced Statistical Procedure Companion, Prentice Hall, New Jersey (2004)
- Ring et al., 1996 Trudy Ring, M. Robert, Salkin, Sharon La Boda; International Dictionary of Historic Places: Asia and Oceania, Volume 5 of International Dictionary of Historic Places; Taylore& Francis (1996) (ISBN 1884964052)
- Silva, 2006 K.D. Silva; Conserving Asian urban heritage: the need for re-conceptualizing the value-based management approach; Siriwan Silapacharanan, Jeffrey Campbell (Eds.), Asian Approaches to Conservation, Chulalongkorn University, Bangkok, Thailand (2006), pp. 16–23
- Vriddhagirisan., 1995 V. Vriddhagirisan; Nayaks of Tanjore, Asian Educational Services, New Delhi (1995) (ISBN 81-206-0996-4)
Document information
Published on 12/05/17
Submitted on 12/05/17
Licence: Other
Share this document
Keywords
claim authorship
Are you one of the authors of this document?
