Abstract
In the present study, the effects of alumina nano-fluid concentration on sharp-edge orifice flow characteristics in both cavitations and non-cavitations turbulent flow regimes are numerically investigated. At different concentration of AL2O3 nonmetallic particles (2%, 4%, 6%, 8%, and 10%) volume fractions in pure liquid water as a base fluid. A single-hole orifice pipe is with a small diameter ratio 0.297 and the orifice plate thickness 14 mm. The effects of alumina nano-fluid concentration on sharp-edge orifice flow characteristics have been investigated based on the turbulent kinetic energy, turbulent intensity, turbulent viscosity, and volume fraction of vapor. The results show that for increasing the nonmetallic particle volume fraction from 0.0 to 10%, the turbulent kinetic energy decreases by 20.87% in average downstream the orifice in the whole region, the turbulent intensity decreases by 11.11% in average downstream the orifice in the whole region, the turbulent intensity decreases by 11% in average in the whole region, and the volume fraction of vapor increases by 16.9%. Also, in the separation region downstream the orifice the turbulent kinetic energy increases by 160% in average and the turbulent intensity increases by 74% in average for increasing the nano-fluid concentration from 0.0% to 2%. These are mainly because for using the alumina nano-fluid the separation phenomena decrease due to the increase of the viscosity of the nano-fluid, the total losses in the sharp-edge orifice increase for the increase of the viscosity of the nano-fluid and this causes the increase of the rate of vaporization. In the orifice pipe the total-stress criterion predicts larger cavitating regions in the flow field. However using the nano-fluid with high concentration accelerates the cavitations at the orifice pipe.
Keywords
Cavitation; Orifice pipe; Nano-fluid; Nano-particle
Nomenclature
D- pipe diameter, mm
d- orifice diameter, mm
I- turbulence intensity
k- turbulence kinetic energy, m2/s2
- mixing length, mm
n- the number density of bubbles per volume of liquid, m−3
P- pressure, Pa
Pv- vapor pressure inside the bubble, Pa
Pl- liquid pressure, Pa
r- radial distance from pipe centerline, mm
R- pipe radius = D/2, mm
Rcb- radius of cavitations bubble, mm
Re- Reynolds number
t- orifice plate thickness, mm
u- instantaneous velocity, m/s
uavg- mean flow velocity, m/s
u′- root-mean-square of the velocity fluctuations, m/s
vt- turbulent viscosity, m2/s
x- axial distance downstream the orifice, mm
Greek symbols
β- diameter ratio
δij- strain rate tensor
ε- rate of dissipation, m2/s2
μ- coefficient of dynamic viscosity, Pa s
α- volume fraction of the vapor phase
ρ- density, kg/m3
φm- mass concentration of nano-particles in nano-fluids
φv- volume concentration of nano-particles in nano-fluids
Subscripts
avg- average
k- turbulence kinetic energy
l- liquid
l,nf- liquid nano-fluid
nf- nano-fluid
np- nano-particle
pf- pure fluid
v- vapor
v,nf- vapor nano-fluid
ε- dissipation rate
1. Introduction
In industrial processes, cavitating flows are known to sometimes generate significant levels of noise and high vibrations of structures. In the process a single-hole orifice is used to restrict the flow in the piping system. Fig. 1 shows a single-hole cavitating orifice in a water pipe with a small diameter ratio (β = d/D = 0.297, where d is the orifice diameter and D is the pipe diameter) is used to generate the high pressure drop and control the flow rate in water coolant for electrical power plants. The high pressure drop is also required in the bypass line of heat exchanger and pump. Cavitations bubbles form because of the high pressure drop in the orifice. The cavitations phenomenon, including bubble nucleation, growth, and collapse process, produces noise and vibration in the pipe line. Cavitations can cause damage and erosion. Addition of nano-particles to the pure fluid, the so called “nano-fluid”, can improve the thermal conductivity of the mixture. The nano-fluids make larger thermal conductivity compared to the pure fluids.
|
|
|
Figure 1. Description of orifice pipe. |
In order to produce a high pressure drop and control the flow rate of the process line, lots of previous work emphasized on the design and study of throttling unit – the orifice disk. However, most of them focused on the one or more orifices in a single disk. Moraczewski and Shapley [1], Oliveeira and Pinho [2], and Borutzky et al. [3] studied the pressure drop enhancement through an axisymmetric sudden expansion after a single orifice disk. Wu et al. [4] simulated the fluid field for different opening shape of orifice. Shah et al. [5], Kozubkova et al. [6], and Oliveira et al. [7] used CFD method to study the pressure drop characteristic. Aly et al. [8], Haimin et al. [9], and Seoud and Vassilicos [10] utilized experiment method to study the pressure drop characteristic. In addition, the vibration and noise is also a serious phenomenon that should be settled. Hassis [11], Franklin and McMillan [12], and Yan et al. [13] studied the flow induced the vibration and noise when fluid flows through the single orifice. As to the orifices, Jankowski et al. [14] developed a model to predict the pressure drop and discharge coefficient for incompressible flow through orifices with ratio of length-to-diameter greater than zero (orifice tubes) over wide ranges of Reynolds number. Kim et al. [15] Study the effect of orifice plate thickness on the discharge coefficient. Other references Payri et al. [16], Payri et al. [17], and Stanley et al. [18] studied the cavitation phenomena due to pressure drop through the orifice.
The cavitation models developed by Kubota et al. [19] and Giannadakis et al. [20] are based on the assumption of spherical cavitation bubbles and the effects of deformation of bubbles have not been considered. In this paper, effects of cavitation bubbles on the velocity field are investigated to find the mechanisms that are responsible for the increase in the disturbances in the flow. In addition, the deformation of the cavitation bubbles is re-solved which will be helpful in understanding the other contributions of the cavitation bubble to the velocity field in addition to the volume change, modeled by spherical bubbles.
Depending on the cavitation number, the flow could show no cavitation, cavitation with traveling bubbles, cavitation with a fixed vapor bubble behind the corner, or super-cavitation. Attempts to predict susceptibility to stress-induced cavitation in high-pressure orifice flows have been advanced by Dabiri et al. [21] and Dabiri et al. [22]. The analysis indicates that cavitation is most likely in the regions of high shear stress. Therefore, it is important to study cavitation bubbles in such environments.
Yu et al. [23] studied the collapse of a cavitation bubble inside a boundary layer over a rigid wall. They observed that for sufficiently large shear the collapse rate of the bubble will increase and the reentrant jet will disappear. Experiments also have shown that the high shear stress can cause cavitation in the liquid even at high pressures.
Dabiri et al. [24] studied the growth and collapse of cavitation bubbles in shear flow and extensional flow. It has been observed that combination of pressure variation and a shear results in large deformation of bubbles and even breakup of the cavitation bubbles.
In present study, the effects of alumina nano-fluid concentration on sharp-edge orifice flow characteristics in both cavitations and non-cavitations turbulent flow regimes are numerically investigated. At different concentration of AL2O3 nonmetallic particles (0.0%, 2%, 4%, 6%, 8%, and 10%) volume fractions in pure liquid water as a base fluid. The effects of alumina nano-fluid concentration on sharp-edge orifice flow characteristics have been investigated based on the turbulent kinetic energy, turbulent intensity, turbulent viscosity, and volume fraction of vapor.
2. Orifice pipe description
A single-hole orifice pipe sizes with throat diameter d = 22 mm and smooth steel pipe inner diameter D = 74 mm (small diameter ratio β = d/D = 0.297) and pipe wall thickness 8 mm. The orifice plate thickness is t = 14 mm. The orifices are placed between straight pipe sections with lengths, respectively, equal to 2D upstream and 8D downstream. Fig. 1 shows the description of the orifice pipe.
3. Nano-fluids properties
The nano-particles used in the present study are alumina (AL2O3). The physical properties of the alumina (AL2O3) are as follows: density = 3600 kg/m3, specific heat = 765 J/kg K, melting point = 2046 °C. The properties of the nano-fluid depend on the properties of the nano-particles. The characteristics of nano-fluids used in this work are governed by not only the type, shape and size of the nano-particles but also distribution of nano-particles in the base fluid. The (AL2O3) nano-particles have spheres with an average diameter of 47 nm and distribution in a range from 10 to 100 nm. The alumina nano-fluid concentrations used in this study are 0.0%, 2%, 4%, 6%, 8%, and 10% volume fraction.
4. Mathematical model
4.1. Governing equations
The present study is based on the single-fluid homogeneous mixture cavitations model suggested by Launder and Spalding [25]. The continuity and momentum equations, describing the flow of the mixture are presented as follows:
|
|
(1) |
|
|
(2) |
4.2. Standard k–ε model
The turbulent kinetic energy, k, and its rate of dissipation, ε, are obtained from the following transport equation [25]:
The turbulent kinetic energy equation [25] is as follows:
|
|
(3) |
The rate of dissipation equation [25] is as follows:
|
|
(4) |
In these equations, Gk represents the generation of turbulence kinetic energy due to mean velocity gradients. Gε represents the generation of ε. Gb is the generation of turbulence kinetic energy due to buoyancy. YM represent the contribution of the fluctuating dilatation in compressible turbulence to the overall dissipation rate. Sk and Sε are user-defined source terms. The following values of constants for the (k–ε) model are recommended by Launder and Spalding [25], which is given in Table 1.
| C1ε | C2ε | C3ε | σk | σε |
|---|---|---|---|---|
| 1.44 | 1.92 | 0.8 | 1 | 1.3 |
4.3. The mixture properties
The flow is considered to be incompressible, with constant properties for the liquid and vapor [6]. The mixture properties are approximated as follows:
Density of the mixture:
|
|
(5) |
The viscosity of the mixture:
|
|
(6) |
The volume fraction of vapor [6]:
|
|
(7) |
The rates of growth and collapse of bubbles are defined using a linear model [6]:
|
|
(8) |
4.4. Nano-fluids properties
The amount of nano-particles dispersed in the nano-fluid was measured by volume concentration.
The volume concentration of nano-particles in nano-fluids φv was determined from Eq. (9)[26]:
|
|
(9) |
Density of nano-fluid ρnf was calculated from Eq. (10)[26]:
|
|
(10) |
Viscosity of nano-fluid μnf was determined from Eq. (11)[26]:
|
|
(11) |
4.5. Turbulence intensity I
Turbulence intensity was determined from Eq. (12)[25]:
|
|
(12) |
4.6. Turbulent kinetic energy k
Turbulence kinetic energy was determined from Eq. (13)[25]:
|
|
(13) |
4.7. Turbulent viscosity υt
Turbulence viscosity was determined from Eq. (14)[25]:
|
|
(14) |
5. The boundary conditions
The boundary conditions of the orifice pipe are as follows:
At the pipes inlet: the pressure-inlet conditions.
- Total gauge pressure = 2,500,000 Pa.
- Static gauge pressure = 2,491,676.8 Pa.
At the pipes outlet: pressure outlet.
- Outlet gauge pressure = 300,000 Pa.
All the simulations in the present study are performed with a grid of 400 in an axial direction and 70 in the radial direction. The grid independence has proved to be valid within a tolerable limit. A cyclic steady state is obtained within 8 iterations with a convergence of 2 ∗ 10−5.
6. Model validation with previous experimental data
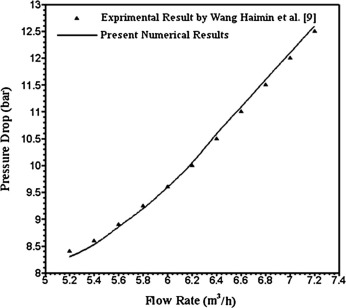
Analysis of the available experimental data on cavitations shows that experimental observations by Haimin et al. [9] are suitable for this purpose. Haimin et al. [9] have reported measurements of pressure drop regulating approaches through the outlet and inlet of an orifice tube. Fig. 2 shows the comparison between the present numerical result and experimental result by Haimin et al. [9]. Comparison shows similar pressure drops across the nozzles. Compared to the previous results, our results show general good agreement of the qualitative behavior and trends.
|
|
|
Figure 2. Comparison between the present numerical result and experimental result by Haimin et al. [9]. |
7. Numerical result
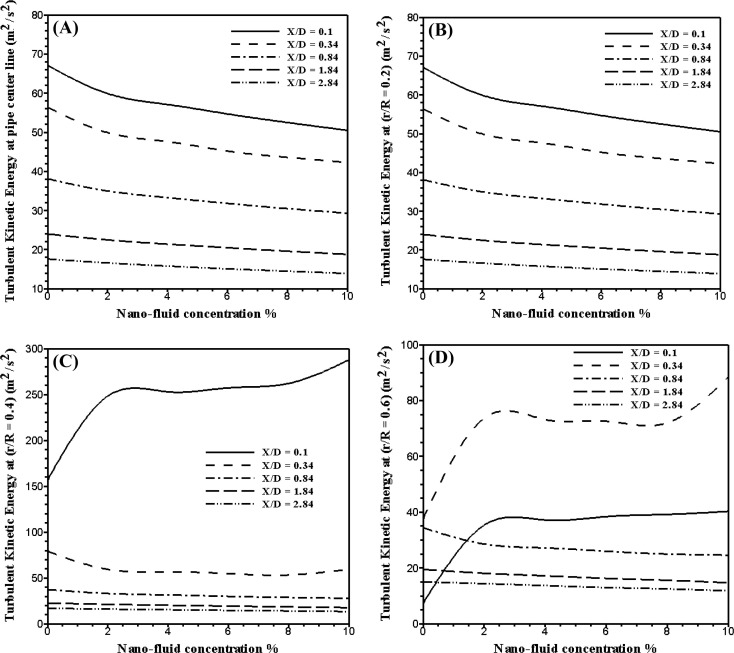
The effects of alumina nano-fluid concentration on the turbulent kinetic energy are shown in Fig. 3. This figure shows the turbulent kinetic energy at different location downstream the orifice at the pipe centerline and at the different radial distance r/R = 0.2, 0.4, and 0.6. As shown in figure, in the whole region the turbulent kinetic energy decreases by 20.87% in average for the increase of the nano-fluid concentration from 0.0% to 10%. In the separation region downstream the orifice the turbulent kinetic energy increases by 160% in average for increase of the nano-fluid concentration from 0.0% to 2%. Also, after the separation region in fully developed region the effect of alumina nano-fluid concentration on the turbulent kinetic energy is very slow. This is mainly because for the increase of the nano-fluid concentration the viscosity of the nano-fluid increases. Also, the rate of dissipation in the turbulent kinetic energy increases in the whole region with increase the of the viscosity of nano-fluid.
|
|
|
Figure 3. Turbulent kinetic energy at different location downstream the orifice at different concentration of alumina nano-fluid. |
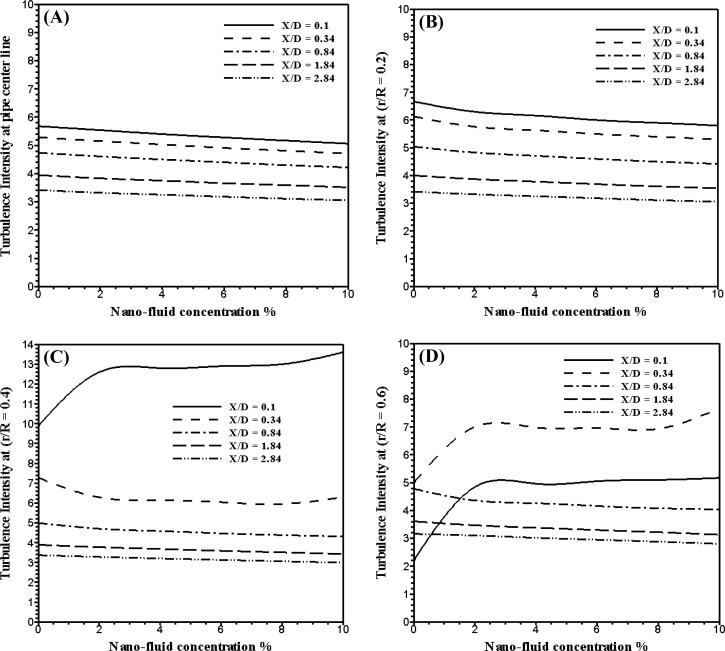
Fig. 4 shows the effects of alumina nano-fluid concentration on the turbulent intensity at different location downstream the orifice at the pipe centerline and at the different radial distance r/R = 0.2, 0.4, and 0.6. As shown in figure, in the whole region the turbulent intensity decreases by 11.11% in average for the increase of the nano-fluid concentration from 0.0% to 10%. Also, in the separation region downstream the orifice the turbulent intensity increases by 74% in average for the increase of the nano-fluid concentration from 0.0% to 2%. This is mainly because for the increase of the nano-fluid concentration the viscosity of the nano-fluid increases. Moreover, in the separation region the turbulent intensity remains constant for the increase of the alumina nano-fluid concentration from 2% to 10%.
|
|
|
Figure 4. Turbulent intensity at different location downstream the orifice at different concentration of alumina nano-fluid. |
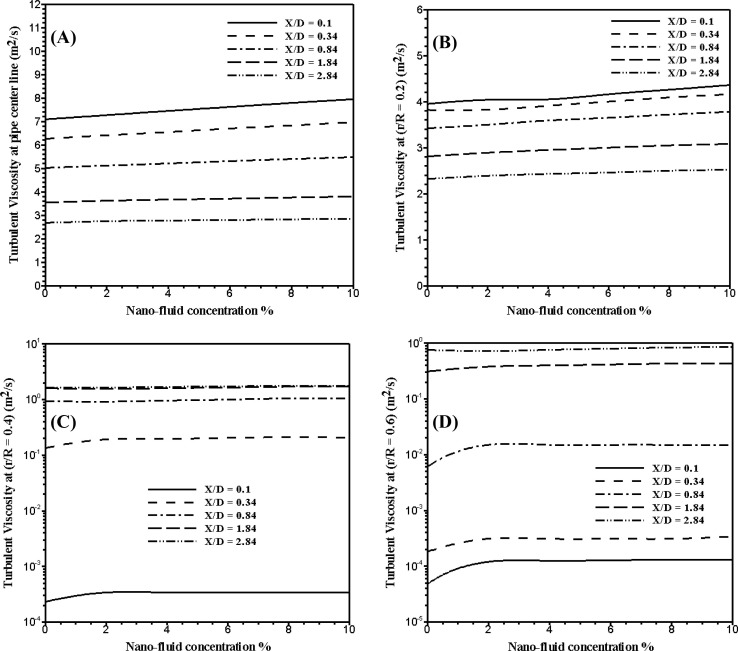
Fig. 5 shows the effects of alumina nano-fluid concentration on the turbulent viscosity at different location downstream the orifice at the pipe centerline and at the different radial distance r/R = 0.2, 0.4, and 0.6. As shown in figure, the turbulent intensity decreases by 11% in average in the whole region for the increase of the nano-fluid concentration from 0.0% to 10%. Also, in the separation region downstream the orifice and downstream the separation region the turbulent viscosity remains constant for the increase of the alumina nano-fluid concentration from 0.0% to 10%.
|
|
|
Figure 5. Turbulent viscosity at different location downstream the orifice at different concentration of alumina nano-fluid. |
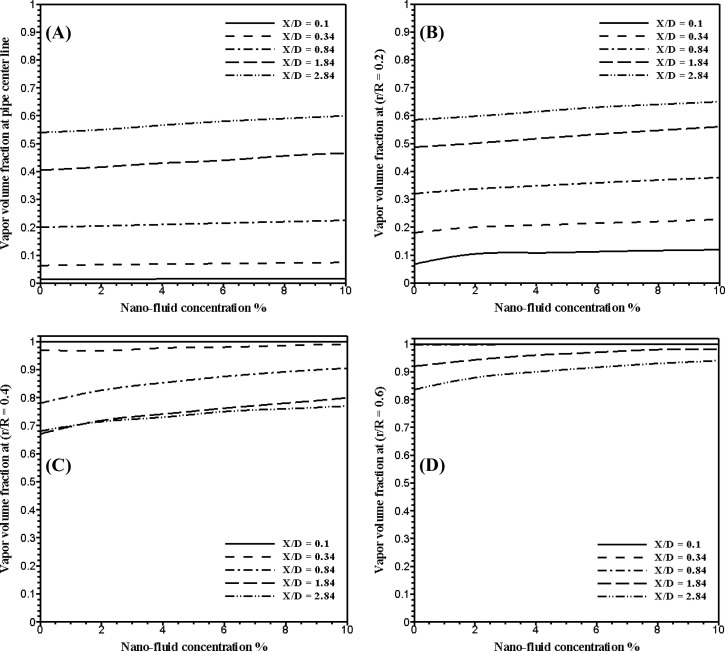
The effects of alumina nano-fluid concentration on the vapor volume fraction are shown in Fig. 6. This figure shows the vapor volume fraction at different location downstream the orifice at the pipe centerline and at the different radial distance r/R = 0.2, 0.4, and 0.6. As shown in figure, in the whole region the vapor volume fraction increases by 16.9% in average for the increase of the nano-fluid concentration from 0.0% to 10%. This is mainly because the turbulent viscosity of the nano-fluid increases with increasing the nano-fluid concentration. However, for the increase of the turbulent viscosity the turbulent shear stress increases, as well as, the energy losses increase with the increase of the turbulent shear stress; this energy converted to the internal energy in the heat form and this heat increases the rate of vaporization.
|
|
|
Figure 6. Vapor volume friction at different location downstream the orifice at different concentration of alumina nano-fluid. |
8. Conclusion
In the present paper, the effects of alumina nano-fluid concentration on sharp-edge orifice flow characteristics in both cavitations and non-cavitations turbulent flow regimes are numerically investigated. At different concentration of AL2O3 nonmetallic particles (2%, 4%, 6%, 8%, and 10%) volume fractions in pure liquid water as a base fluid. The results of the investigation may be summarized as follows:
- For the increase of the alumina nano-fluid concentration from 0.0% to 10% volume fraction, the turbulent kinetic energy decreases by 20.87% in average downstream the orifice in the whole region. Also, in the separation region downstream the orifice the turbulent kinetic energy increases by 160% in average for the increase of the nano-fluid concentration from 0.0% to 2%.
- The turbulent intensity decreases by 11.11% in average for the increase of the nano-fluid concentration from 0.0% to 10%. Also, in the separation region downstream the orifice the turbulent intensity increases by 74% in average for the increase of the nano-fluid concentration from 0.0% to 2%.
- For the increase of the nano-fluid concentration from 0.0% to 10% the turbulent intensity decreases by 11% in average in the whole region.
- The maximum relative increase in vapor volume fraction has recorded the value of 16.9% for the increase of the nano-fluid concentration from 0.0% to 10%. This is mainly because the energy losses in the orifice pipe increase with the increase of the nano-fluid concentration; these losses in the energy converted to the internal energy in the heat form, and this heat increases the rate of vaporization.
References
- [1] T. Moraczewski, N.C. Shapley; Pressure drop enhancement in a concentrated suspension flowing through an abrupt axisymmetric contraction–expansion; Phys. Fluids, 19 (2007), p. 103304
- [2] P.J. Oliveeira, F.T. Pinho; Pressure drop coefficient of laminar Newtonian flow in axisymmetric sudden expansions; Int. J. Heat Fluid Flow, 18 (1997), pp. 518–529
- [3] W. Borutzky, B. Barnard, J. Thoma; An orifice flow model for laminar and turbulent conditions; Simul. Model. Pract. Theory, 10 (3–4) (2002), pp. 141–152
- [4] D. Wu, R. Burton, G. Schoenau, D. Bitner; Modelling of orifice flow rate at very small openings; Int. J. Fluid Power, 4 (1) (2003), pp. 31–39
- [5] M.S. Shah, J.B. Joshi, A.S. Kalsi, C.S.R. Prasad, D.S. Shukla; Analysis of flow through an orifice meter: CFD simulation; Chem. Eng. Sci., 71 (2012), pp. 300–309
- [6] Milada Kozubkova, Jana Rautova, Marian Bojko; Mathematical model of cavitations and modeling of fluid flow in cone; Proc. Eng., 39 (2012), pp. 9–18
- [7] N.M.B. Oliveira, L.G.M. Vieira, J.J.R. Damasceno; Numerical methodology for orifice meter calibration; Mater. Sci. Forum, 660–661 (2010), pp. 531–536
- [8] A. Abou El-Azm Aly, A. Chong, F. Nicolleau, S. Beck; Experimental study of the pressure drop after fractal-shaped orifices in turbulent pipe flows; Exp. Thermal Fluid Sci., 34 (1) (2010), pp. 104–111
- [9] Wang Haimin, Xie Shujuan, Sai Qingyi, Zhou Caiman, Lin Hao, Chen Eryun; Experimental study on pressure drop of a multistage letdown orifice tube; Nucl. Eng. Des., 265 (2013), pp. 633–638
- [10] R.E. Seoud, J.C. Vassilicos; Dissipation and decay of fractal-generated turbulence; Phys. Fluids, 19 (2007), p. 105108
- [11] H. Hassis; Noise caused by cavitating butterfly and monovar valves; J. Sound Vib., 225 (1999), pp. 515–526
- [12] R.E. Franklin, J. McMillan; Noise generation in cavitating flows, the submerged jet; ASME, J. Fluids Eng., 106 (1984), pp. 336–341
- [13] Y. Yan, R.B. Thorpe, A.B. Pandit, Cavitations noise and its suppression by air in orifice flow, in: Symposium on Flow-Induced Noise, Chicago, III, vol. 6, ASME, New York, 1988, pp. 25–39.
- [14] T.A. Jankowski, E.N. Schmierer, F.C. Prenger, S.P. Ashworth; A series pressure drop representation for flow through orifice tubes; J. Fluids Eng., 130 (5) (2008), pp. 051201–051204
- [15] B.C. Kim, B.C. Pak, N.H. Cho, D.S. Chi, H.M. Choi, Y.M. Choi, K.A. Park; Effects of cavitation and plate thickness on small diameter ratio orifice meters; Flow Meas. Instrum., 8 (2) (1998), pp. 85–92
- [16] R. Payri, F.J. Salvador, J. Gimeno, J. de la Morena; Study of cavitation phenomena based on a technique for visualizing bubbles in a liquid pressurized chamber; Int. J. Heat Fluid Flow, 30 (2009), pp. 768–777
- [17] R. Payri, F.J. Salvador, J. Gimeno, O. Venegas; Study of cavitation phenomenon using different fuels in a transparent nozzle by hydraulic characterization and visualization; Exp. Thermal Fluid Sci., 44 (2013), pp. 235–244
- [18] C. Stanley, T. Barber, G. Rosengarten; Re-entrant jet mechanism for periodic cavitation shedding in a cylindrical orifice; Int. J. Heat Fluid Flow, 50 (2014), pp. 169–176
- [19] Akihiro Kubota, Hiroharu Kato, Hajime Yamaguchi; A new modeling of cavitating flows: a numerical study of unsteady cavitation on a hydrofoil section; J. Fluid Mech., 240 (1992), pp. 59–96
- [20] E. Giannadakis, M. Gavaises, C. Arcoumanis; Modelling of cavitation in diesel injector nozzles; J. Fluid Mech., 616 (2008), pp. 153–193
- [21] S. Dabiri, W.A. Sirignano, D.D. Joseph; Cavitation in an orifice flow; Phys. Fluids, 19 (2007), p. 072112
- [22] Sadegh Dabiri, William A. Sirignano, Daniel D. Joseph; Two-dimensional and axisymmetric viscous flow in apertures; J. Fluid Mech., 605 (2008), pp. 1–18
- [23] P.W. Yu, L. Ceccio, G. Tryggvason; The collapse of a cavitation bubble in shear flows––a numerical study; Phys. Fluids, 7 (1995), p. 2608
- [24] Sadegh Dabiri, William A. Sirignano, Daniel D. Joseph; Interaction between cavitation bubble and shear flow; J. Fluid Mech., 651 (2010), pp. 93–116
- [25] B.E. Launder, D.B. Spalding; Lectures in Mathematical Models of Turbulence; Academic Press, London, England (1972)
- [26] A.E. Kabeel, Mohamed Abdelgaied; Overall heat transfer coefficient and pressure drop in a typical tubular exchanger employing alumina nano-fluid as the tube side hot fluid; Heat Mass Transfer (2015), pp. 1662–1668
Document information
Published on 12/04/17
Licence: Other
Share this document
Keywords
claim authorship
Are you one of the authors of this document?

