1 Introduction
The technology of 3D printing of continuous fibre-reinforced thermoplastics shows great potential in producing lightweight structural parts reinforced with steered fibres. Fused filament fabrication (FFF) printing technology based on pre-impregnated filament extrusion is currently the best performing, and is being successfully used to manufacture prototypes, factory tools, spare parts and custom products for sectors such as biomedical, aerospace and industrial [1,2].
This process is still under development, and knowledge of the mechanical behaviour of printed composites is limited. In recent years, different studies have addressed the physical and mechanical characterisation of printed continuous fibre reinforced polymers [3-5]. It was observed that the mechanical behaviour of the material is highly conditioned by process-induced defects such as a large number of voids, non-homogeneous distribution of fibres and poor bonding between beads and layers. Most of these defects are caused by insufficient thermo-mechanical consolidation during the printing process.
To promote the use of this new technology in the design of complex and optimised composite parts, further knowledge of the mechanical behaviour of the material is necessary. In this study, interlaminar fracture toughness under Mode I and II loading are characterised for a 3D printed continuous carbon fibre-reinforced polyamide (CCF/PA). The influence of the thermo-mechanical consolidation on fracture toughness is also analysed. For this purpose, the printed specimens were post-processed by hot-pressing.
2 Printing and Test Methods
The printer employed in this study was MarkTwo® from Markforged®, which uses pre-impregnated filament FFF 3D printing technology [6]. The extrusion parameters are fixed for this printer. The layer thickness is 125 µm, and the composite is extruded by a 0.9 mm diameter nozzle at a temperature of 252ºC and at a speed of 15 mm/s. The composition and calorimetric properties of all the filaments available in the printer were studied in depth in [7].
Mode I interlaminar fracture toughness characterisations was carried out using the double cantilever beam (DCB) sample, in accordance with the ASTM D 5528. The opening Mode I fracture tests were performed on a Instron universal testing machine equipped with a 500 N load cell and at a load-rate of 1 mm/min. The pre-crack length was 50 mm and it propagated to 85 mm under crack-opening load.
Mode II interlaminar fracture toughness characterisation was carried out using the end-notched flexure (ENF) test, in accordance with the ASTM D 7905 standard. ENF 3-point bending tests were performed on an Instron universal testing machine equipped with a 10 kN load cell at a 0.5 mm/min load-rate. The spam length was 100 mm and the initial delamination was 30 mm.
Fracture samples are generally obtained from plates of approximately 200 mm in length and 4-5 mm in thickness that are cut. It was not possible to manufacture 3D printed plates of these dimensions due to the high shrinkage and warping of the CCF/PA during the printing process. This phenomenon is more pronounced in unidirectional continuous fibre composite and in fully filled parts, as in this case. For this reason, two solutions were developed: reinforced thin samples and fully printed short samples.
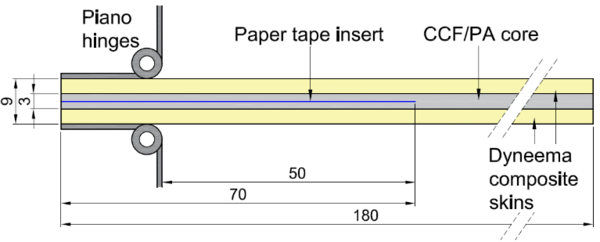
The first solution consisted of a 3 mm thick 3D printed unidirectional CCF/PA core reinforced with 3 mm thick composite skins of epoxy resin and weave fabric Dyneema® (Figure 1). The function of these skins was to stiffen and reinforce the sample enough in order to avoid fracture of the DCB arms prior to interlaminar crack propagation. This solution was successfully implemented in [8]. To create the delamination initiator, the print was stopped during the printing process and the required area was covered with paper adhesive tape (Figure 1). Four samples were produced and the same samples were used for both Mode I and Mode II interlaminar fracture tests, i.e., the Mode I crack was used as a pre-crack for Mode II.
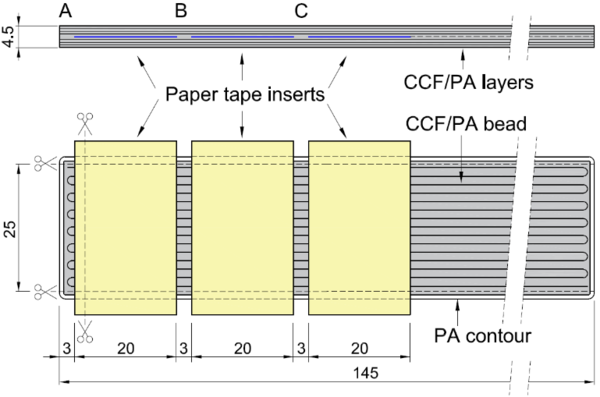
The second solution was a monolithic fully printed unidirectional CCF/PA sample. Due to the abovementioned printing difficulties, shorter specimens were produced for Mode I and Mode II separately and one by one. The thickness of the samples was 4.5 mm. In order to avoid excessive warping, the pre-crack was generated in three separate sections (Figure 2). Towards this end, three small equally spaced paper tape inserts were placed side-by-side separated by narrow gaps (A, B and C in Figure 2) which allowed some interlayer bonding during printing and prevented excessive warping of the sample.
Once the impression was finished, the end A was cut and the zones B and C were delaminated acting softly in the delamination of the end. Finally, the polyamide contours were sanded to avoid the edge effect. Three samples were tested for each configuration, Mode I and Mode II.
To study the influence of thermo-mechanical consolidation on the interlaminar fracture behaviour the printed unidirectional CCF/PA composite was post-processed. Hot-pressing was performed at 210ºC for 15 minutes, with a heating rate of 10ºC/min, and a constant pressure of 1 MPa. The post-processing temperature was higher than the glass transition temperature of the matrix, which is 143ºC [7]. The samples were manufactured by hot-pressing different printed plates. A total of 54 layers of material were compacted, resulting in 5.8 mm thick samples. The pre-crack was also created with an adhesive paper insert placed during printing. As in the case of reinforced samples, 180 mm long samples were manufactured to allow Mode I and II tests with the same sample. The influence of different post-processing temperatures on the microstructure and interlaminar shear strength of the printed CCF/PA was analysed in [9].
The typical fracture surfaces produced by the different test types were examined by scanning electron microscopy (FEI Nova NanoSEM 450).
3 Results and Discussion
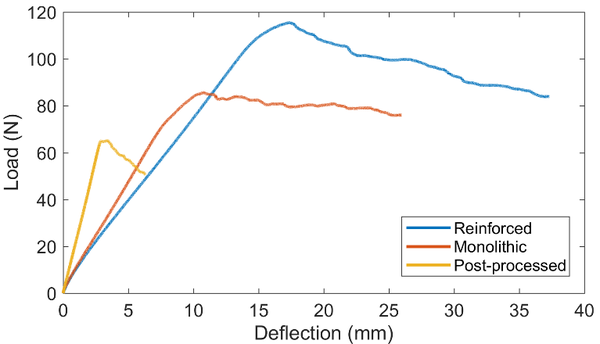
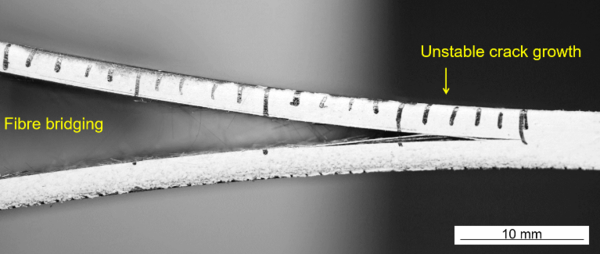
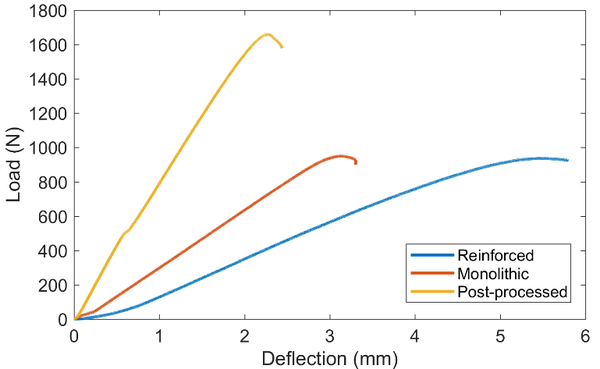
In the Mode I fracture tests, the load-deflection ratio is linear, with a slight deviation before fracture propagation (Figure 2). This behaviour is characteristic of tough matrix composites. Post-compacted samples are the most rigid and reinforced ones the most flexible due to the difference in sample thickness and material stiffness. In the reinforced and post-processed samples the crack propagation was stable. In the monolithic samples, however, changes occurred in the delamination plane (Figure 3), resulting in sudden jumps in crack growth.
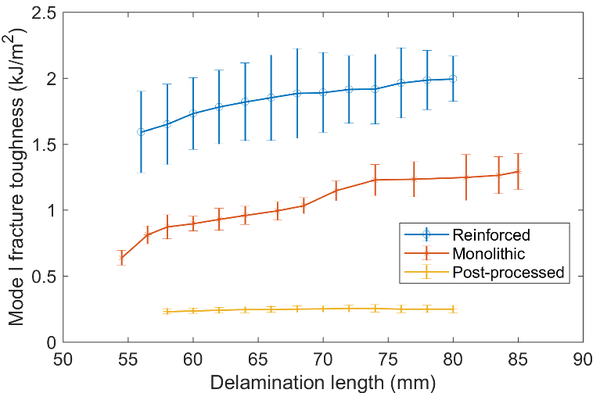
The Mode I interlaminar fracture toughness was calculated using the modified beam theory method given in ASTM D 5528. A resistance-type fracture behaviour was identified (Figure 4), the toughness increased in the fracture initiation phase and then tended to stabilise in the propagation phase. The cause of the increased delamination resistance could be the development of fibre bridging (Figure 3). This behaviour is less pronounced in post-processed samples.
The fracture toughness of monolithic specimens is considerably lower than that of reinforced specimens (Figure 4). One reason may be the unstable propagation that occurs in the monolithic samples (Figure 3). Crack propagation occurs in the weakest planes and the level of resistance is reduced. The stiffness level of the monolithic samples, which is greater than reinforced samples, and the low interlayer bonding, which is characteristic of printed parts, can influence this behaviour. On the other hand, the residual stresses induced by the manufacturing process are expected to be higher in monolithic samples. This stress condition can contribute to the propagation of the crack. Finally, the influence of fibre bridging on delamination resistance may also be higher in the case of reinforced samples, as the opening of the samples during the test is considerably larger.
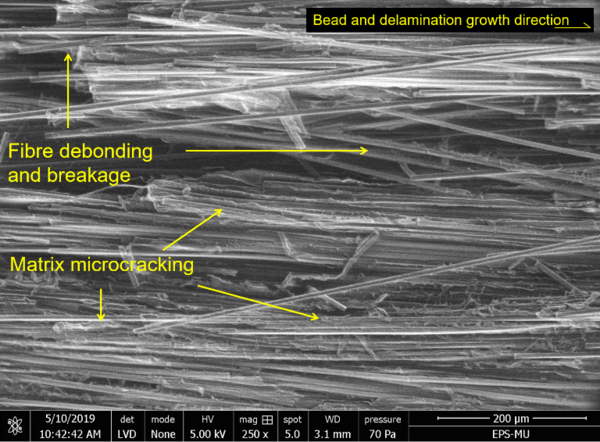
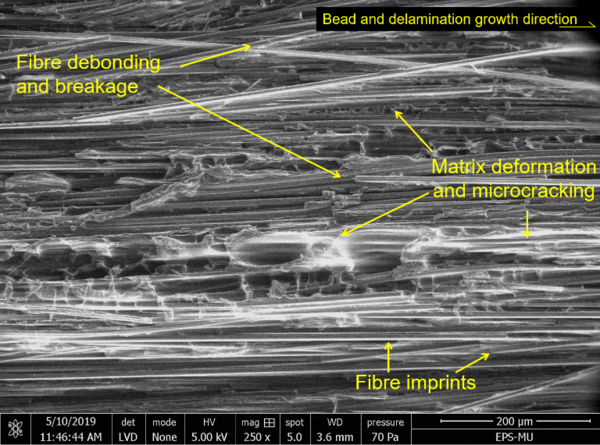
The Mode I interlaminar fracture toughness of post-compacted specimens is much lower than the rest (Figure 4). The justification for this behaviour can be found on the fractured surfaces (Figures 7.a and 7.c). The fracture surface of the reinforced samples is very irregular (Figure 7.a). Debonded and fractured fibres are observed, which have probably formed bridges between the crack surfaces. Matrix deformation and microcracking is also visible in matrix-rich areas and in areas where the fibres have been removed. In contrast, the fracture surface of the post-compacted specimens is much smoother (Figure 7.c). The amount of fibre removed is much lower, and few matrix deformation areas are identified. Thus, the amount of energy needed to propagate the crack is relatively low.
The load-deflection curves of the ENF test for Mode II shear loading are shown in Figure 5. The behaviour of the reinforced samples are slightly non-linear and stiffness decreases with the load. As in the Mode I test, post-compacted specimens are the most rigid and reinforced specimens are the most flexible.
The Mode II interlaminar fracture toughness was calculated using the compliance calibration method given in ASTM D 7905 (Figure 6).
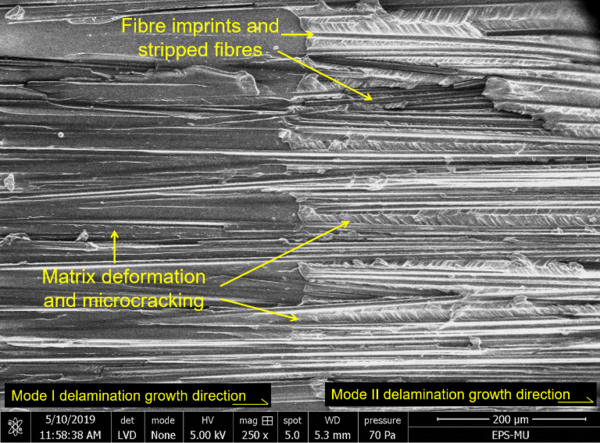
The Mode II interlaminar fracture toughness of post-processed samples is much higher than that of Mode I, and even exceeds the toughness of non-post processed samples. On the fracture surface (Figure 7.c) the microcracks produced by the interlaminar shear are clearly identified on the entire surface of the matrix. This fracture mode makes the material energy absorbing. Fibres totally stripped of matrix and fibre imprints are also identified.
However, the fracture toughness in Mode II of non-post compacted samples is lower than that of Mode I. As in Mode I, the fracture surface is very irregular, and debonded and fractured fibres, fibre imprints and matrix deformation and microcracking are observed (Figure 7.b). In this case, although fractured matrix zones are identified, the interlaminar shear microcracking mode is not activated and therefore its energy absorption capacity decreases.
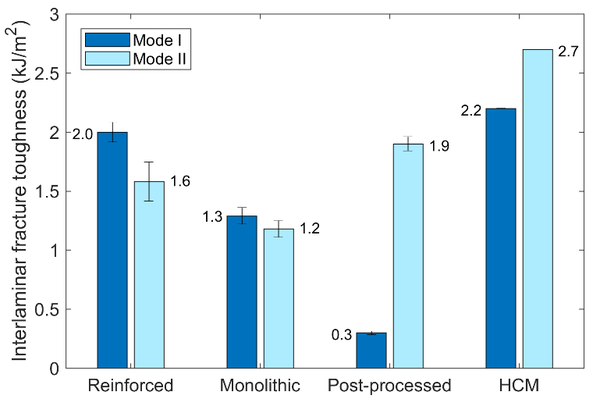
The obtained properties are compared to an equivalent material manufactured by hot compression moulding (HCM) [10] to assess the interlaminar fracture performance of the 3D printed material. The interlaminar fracture toughness of printed samples is similar in Mode I and lower in Mode II to that obtained by HCM (Figure 6).
4 Conclusions
In this study, the interlaminar fracture toughness of 3D printed continuous carbon fibre-reinforced polyamide was characterized under Mode I and II loadings.
3D printing of this type of specimen and material presents difficulties, mainly shrinkage and excessive warping, which prevent complete manufacture. Reinforced type sample is a good solution to characterize this type of material, as the propagation of the fracture is stable.
Mode I interlaminar fracture behaviour of the printed samples is good (the toughness is 91% of that obtained by HCM). This may be due to the large number of bridges that are created between the fractured faces. In Mode II, however, the irregular interlayer surface does not activate the most effective matrix shearing mode and the toughness is lower (59% of that obtained by HCM).
Hot pressing of printed material significantly improves interlaminar fracture toughness in Mode II loading. The compaction of the material activates the most effective fracture mode (interlaminar shear matrix microcracking) and the toughness increases by 19% with respect to the unprocessed one. In contrast, under Mode I loading, the post-processing hinders the formation of fibre bridges between fracture surfaces, and the crack propagation energy is severely decreased.
Acknowledgements
Mondragon Unibertsitatea acknowledges the support of the Basque Government via the projects ESCOM3D (IBA PI2017-49_GVP7), ADDISEND (Elkartek KK-2018/00115) and SUCOMP3D (Hazitek ZL-2018/00882). C.S. Lopes acknowledges the support of the Spanish Ministry of Economy and Competitiveness via the project HYDTCOMP (MAT2015-69491-C03-02) and the Ramón y Cajal fellowship (RYC-2013-14271). C. Pascual-González acknowledges financial support of the Sistema Nacional de Garantía Juvenil from the Autonomous Community of Madrid (PEJD-2017-POST/IND-4401).
References
[1] G. D. Goh, Y. L. Yap, Advanced Materials Technolgies 4, 1 (2018).
https://doi.org/10.1002/admt.201800271
[2] B. Brenken, E. Barocio, Additive. Manufacturing 21, pp. 1-16 (2018).
https://doi.org/10.1016/j.addma.2018.01.002
[3] L. G. Blok, M. L. Longana, Additive. Manufacturing 22, pp. 176–186 (2018).
https://doi.org/10.1016/j.addma.2018.04.039
[4] J. Justo, Távara, Composite. Structures 185, pp. 537–548 (2018).
https://doi.org/10.1016/j.compstruct.2017.11.052
[5] M. A. Caminero, J. M. Chacón, Polymer Testing 68, pp. 415–423 (2018).
https://doi.org/10.1016/j.polymertesting.2018.04.038
[6] G. T. Mark, A. S. Gozdz, Patent Application Publication, US 2014/0328963 A1 (2014).
[7] C. Pascual-Gonzalez, M. Iragi, Composites Part B: Engineering (SUBMITTED, 2019).
[8] D. Young, N. Wetmore, Additive. Manufacturing 22, pp 508-515 (2018).
https://doi.org/10.1016/j.addma.2018.02.023
[9] P. San Martín, C. Pascual-González, Revista de la Asociación Española de Materiales Compuestos (SUBMITTED, 2019).
[10] J. P. Reis, M. F. S. F. de Moura, Composites Part B Engineering 169, pp. 126–132 (2019).
Document information
Published on 01/06/22
Accepted on 01/06/22
Submitted on 28/05/22
Volume 04 - Comunicaciones Matcomp19 (2020), Issue Núm. 1 - Avances en Materiales Compuestos. Nuevos Campos de Aplicación., 2022
DOI: 10.23967/r.matcomp.2022.06.012
Licence: Other
Share this document
Keywords
claim authorship
Are you one of the authors of this document?
