Abstract
Commonly, in the evaluation of the optical appearance of glass panes in building envelopes, anisotropies are a reason for a dispute between the architect or client and the façade manufacturer. Sometimes each party has a different perception, how strong the anisotropies are and what is permissible.
This paper discusses in the first part the formation of the anisotropies and their natural sources. It is shown that the appearance of this phenomenon is dependent on the environmental conditions of the building site as well as the glass quality. If the application of thermally tempered glass cannot be avoided, the quality assurance of the production process has to be carefully planned.
Furthermore a method for the quantitative measurement of anisotropies is proposed and prescribed in detail. This method can assist in the quality assurance process. Measurements are showing that probably the best tempered glass offers slight anisotropies and that under unfavorable conditions these anisotropies can become evident.
Keywords
Glass stress ; Anisotropy ; Thermal tempering ; Polarization ; Wave retardation
Nomenclature
α , β- angle of incident and refracted beam
αB- Brewster׳s angle
δ- relative phase shift
η , ηmax- relative degree of polarization, maximum degree of polarization
γ , ψ , θ- angles in the hemisphere according to Figure 7
λ- wavelength
σ1 ,σ2- principle stress
C- stress-optical constant
d- thickness
E- error value
Ii , Ir- intensity of incident and reflected beam
n- refraction index
R- reflection coefficient
s- absolute phase shift
1. Introduction
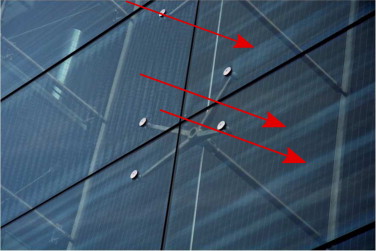
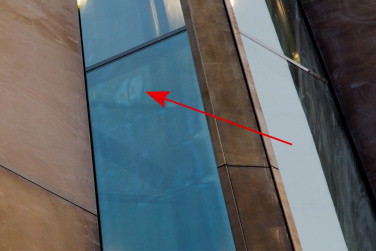
Today façades are individual building envelopes with larger parts of glass. It is spent much effort on the aesthetic design and the high-quality-look of the whole project to fulfill the clients expectations. But sometimes, if one looks at these glazings colored stripes and spots, which are known as anisotropies in a façade context, can be observed (Figure 1 ; Figure 2 ). From an architectural point of view these patterns are unaesthetic and disruptive.
|
|
|
Figure 1. Visible anisotropies at a façade glazing; horizontal stripes. |
|
|
|
Figure 2. Visible anisotropies at a façade glazing; single spots. |
In general, the anisotropy can be defined as a characteristic of a material, that has directionally dependent properties (e.g. tensile strength, conductivity, wave speed, refractive index). Here, the anisotropy effect results from the presence of polarized light in the natural environment, the birefringent property (anisotropy of the refractive index) of the glass (photoelasticity) and mechanical stresses in the glass due to the tempering process.
Normally, the effect of this phenomenon is stronger on days with a clear blue sky and varies with the angle of incidence as well as with the relative position of the sun to the glazing, due to the high degree of polarization of the light under these circumstances (see Section 4.2 ). But it seems that not only the blue sky forces the anisotropies, but also the presence of a smooth water surface, wet streets, polished granite flooring or other shiny non-metallic objects abets the appearance, because these surfaces emit or rather reflect polarized light too (see Section 4.1 ). The reflection of light by metallic objects does not intensify the degree of polarization since the underlying physical process is different (emitters are electrons not Hertzian dipoles). Black background behind the glass makes the effect more visible than light ones. Thicker glasses or laminates of two or more panes show a stronger effect than thinner glasses, because the path of the light through the glass is longer compared to the thin ones. Otherwise, the reflections of bright objects and buildings are stronger than the visible anisotropies, so that it will not be noticed by the observer anymore. Furthermore only tempered glass is affected, due to the imposed mechanical stresses. In most cases nothing of the prescribed effects are noticed at the manufacturing.
Currently, there is no technical solution that offers the possibility to quantify these optical anisotropies over the whole glass pane for comparison and quality assurance purpose. Sometimes architects are checking the quality of the glass with a special polarization filter in front of their eyes after the glass processing. However, this method leads to subjective results, it is not reproducible and also poorly documentable.
In this paper, we will discuss the corresponding physical effects which lead to these optical anisotropies. Furthermore a proposal for measuring the anisotropies without the named disadvantages is given, which enables us to quantify the anisotropies and compare mock-ups and batches of glass before they are mounted on the façade.
2. Thermal tempering
With the thermal tempering process the mechanical strength of glass is increased. Normally this is done by heating a glass pane above the transition temperature. After that the panes are rapidly cooled down to ambient temperature. This treatment generates a residual stress profile across the thickness with compression stresses at the surface of the glass.
To receive a good quality glass, concerning the optical appearance and strength, an optimized and monitored cooling process (the quench) is indispensable.
Today, almost all quenches consist of an array of rollers and cooling nozzles. The rollers are wrapped with special heat resistant fabric stripes. Through the thousands of cooling nozzles the hot glass surface is cooled by impinging air jets while the glass lies on the rollers and oscillates. The large amount of cooling nozzles and the oscillation of the pane shall guarantee a uniform heat transfer and therefore a homogeneous residual stress profile in the whole glass pane, independent of a direction.
But practically, at any time the glass is in contact with the rollers somewhere at the surface. Furthermore the cooling is influenced by the flow of the air. Monnoyer and Lochegnies (2008) simulated the flow field of the quenching process. They showed that the air from the nozzles at the middle of the pane crosses the jets at the border area. Thus, the heat transfer is disturbed at the contact points as well as through the air flow and this process cannot lead to an absolutely homogeneous cool-down and thus anisotropy-free glass.
With this knowledge, an attentive observer can determine on the building, the direction of oscillation, the reversal point, either the fabric is spiral or circular wrapped around the rollers or the distance between the fabric stripes of the rollers. One can also see sporadic problems due to blocked nozzles or recurring patterns through a poor parameterized and therefore non-optimized process. Commonly, hot bent and tempered glasses are more susceptible to anisotropies than flat glass, because the homogeneous cooling is more complicated (Bucak et al ., 2009 ; Schuler et al ., 2012 ).
Newly, a generation of quenches is launched at the market which operates with an air cushion (LiSEC Group, 2011 ) instead of the rollers or the nozzles are controlled in dependence of the measured anisotropies (Arntzen et al., 2010 ). The last named system measures the anisotropies with a laser beam at discrete points of the glass pane. They are promising technologies regarding the prevention of anisotropies, but they have to prove the practical applicability concerning common dimensions, quantity and also prices for architectural purposes.
3. Photoelasticity
The main effect for the formation of the colorful anisotropy pattern can be explained with the theory of photoelasticity. Commonly, photoelasticity is used to determine the stress field in mechanical models with an experimental method. In Kuske and Robertson (1974) , Wolf (1976) , Föppl and Mönch (1972) , Frocht (1948) , and Dally and Riley (1978) the fundamentals and the application of this technique are explained. For the understanding of this effect, we shall follow a ray of light from the source to the observers eye. The ray of light prescribes the direction of propagation of the electromagnetic wave of the light.
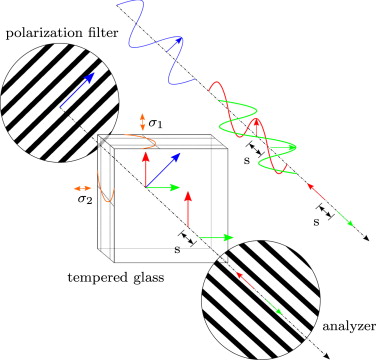
In Figure 3 a standard setting, named plane polariscope, is shown. The light emerges from a source with randomly oriented emitters and therefore the waves will have no preferred orientation of vibration. At the first polarizer only light that vibrates parallel to the axis of the polarizer (here parallel to the black bars; blue arrow) is transmitted. This linear polarized beam splits into the two principle axes (σ1 and σ2 ; red and green arrows respectively) of the glass specimen, because it is a birefringent material when stresses are applied on it. During the transmission of these two rays a phase shift s can occur if the stresses in the two principle directions are not equal. When these two rays emerge the glass they will reach the analyzer. It is the same optical instrument as the polarizer but it is rotated 90°. Here only the components parallel to the analyzer axis of these two rays are transmitted. If there is no phase shift, the components eliminate each other and the observer will notice a black screen. On the opposite, if the phase shift is exactly a half wavelength the light intensity maximizes. Due to the fact that each wavelength of the visible spectrum experiences different retardation for the same stress state one can see colorful fringes by using white polarized light for this experiment.
|
|
|
Figure 3. Formation of the wave retardation in a linear polariscope. |
With the stress-optical-law the relative phase shift δ can be determined for the two-dimensional problem:
|
|
( 1) |
But this is only valid, if the stress is constant through the thickness. For tempered glass this is not applicable. Here Eq. (1) must be transferred to the integral form for thin slices through the thickness:
|
|
( 2) |
Due to the fact that the functions and are not exactly known, it is impossible to calculate stresses only from one fringe plot, which was taken in a transmission setup.
But what will the picture look like if the direction of polarization equals one of the principle axes at the glass? Obviously the polarized beam is not split into the two principle directions and therefore no phase shifting can occur. Finally, this leads to a black screen, although a non-homogeneous stress state in the glass may exist. These areas are known as isoclinics in the photoelasticity jargon. Hence, one should use no linear polariscope to capture pictures of the fringe pattern, because the visible pattern is dependent on the orientation of the polarizer, analyzer and the principle axes of the glass pane.
Normally, nobody knows exactly the principle axes of the residual stress of a tempered glass pane. To overcome these difficulties, one can use a circular polariscope . In this case, one have to put two λ /4 retardation plates with an angle of 45° to the polarization direction in the path of the polarized light: one plate between the polarizer and the glass, and the other one between the glass and the analyzer. The fast and the slow axis of the retarders have to be switched once. This procedure causes the tip of the electromagnetic vector of the polarized wave to prescribe a helix. So the polarized beam has no distinctive direction. Therefore no isoclinics can occur and the fringe pattern is not dependent on the direction of the glass and the principle axes to the polarizers. Due to this advantage, the circular polariscope should always be used to take pictures of anisotropies for the purposes of documentation and a potential comparison of several pictures.
4. Polarization of light
Normally, if the glass exhibits strong anisotropies one can see them with the naked eye and without any polarization filter. So it is evident that polarization effects must occur in the natural environment.
There are several physical processes which will lead to polarized light. These are briefly explained in several physics textbooks for example in Demtröder (2013) and Gerthsen and Meschede (2010) . To overcome the problem of anisotropies on façade glazings the polarization through reflection and through scattering are mainly interesting. Hence, below those two effects will be briefly explained.
4.1. Polarization through reflection
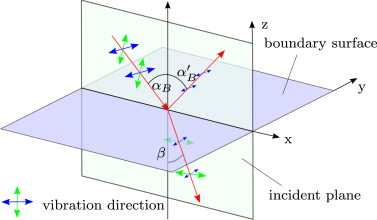
When a light beam encounters a dielectric medium, one part of it will be reflected and the other one experiences refraction. The reflected beam is linear polarized. This effect is explainable with the directional characteristic of a vibrating dipole, which means that the dipole emits no radiation in the direction of vibration. Practically, natural unpolarized light reflected on a glass surface is linear polarized perpendicular to the plane of incidence.
Conversely, when linear polarized light impinges at a glass surface, the intensity of the reflected beam is mainly dependent on the direction of polarization and the angle of incidence. With the Fresnel equations one can determine the intensity of the reflected beam:
|
|
( 3) |
|
|
( 4) |
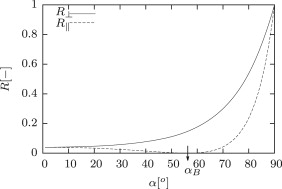
The degree of reflection behaves completely different for a beam polarized perpendicular to the plane of incidence (index ) and a parallel (index ) polarized one. The degree of reflection is given as a function of the angle of incidence for those two cases in Figure 4 . One can see that the intensity of a reflected parallel beam is always lower than that of a perpendicular polarized beam. For the parallel beam the intensity reduces steadily until a particular angle αB . This angle is called Brewster׳s angle. It describes the angle at which no light of a perpendicular to the plane of incidence polarized beam is reflected (Figure 5 ). It can be derived with the refraction index of common architectural glass of about n =1.5 that Brewster׳s angle becomes .
|
|
|
Figure 4. Reflection coefficient R in dependence of incident angle α . |
|
|
|
Figure 5. Reflection and refraction of polarized rays and Brewster׳s angle. |
To refer this to the problem of anisotropies, one should have in mind that if there is a polarized light source and the emitted light is linear polarized parallel to the plane of incidence of a reflection only a very small amount up to Brewster׳s angle of that light is reflected. Because the known anisotropy effect has only a weak intensity compared to a strong reflection the anisotropies are best viewed with an angle close to Brewster׳s angle with parallel polarized light.
4.2. Polarization through scattering
Typically, the anisotropies are best viewed on days with an absolutely clear blue sky. On these days the light of the sky is linear polarized through the physical effect called Rayleigh-scattering .
The sunlight arrives at the atmosphere of the earth. Here the electromagnetic rays stimulate the gas molecules to oscillate in the plane of the ray. The molecules send out radiation in a directional characteristic of a Hertzian dipole. That means no radiation exists in the direction of vibration of this dipole and the light is linear polarized perpendicular to the direction of propagation of the ray. This effect is mainly dependent on the particle (molecules) size and the wavelength of the incident radiation. Rayleigh scattering appears only if the wavelength is much smaller than the particle size. The intensity of the scattering is much higher for small wavelengths than for larger ones. Therefore the intensity of scattered blue parts of the sunlight is the highest and the sky appears blue. Only at sunrise or sunset, when the path of the light is long enough, the larger wavelengths are dominating and the sky becomes yellow or red (Minnaert, 1954 ).
So if one is seeking for a source of polarized light with a high degree of polarization it will be found in the deep blue areas of the sky. Hence the intensity of scattered polarized light is dependent on the vibration direction of the dipoles, the strongest polarized areas of the sky are found perpendicular to the propagation direction of the sunlight, when the altitude of the sun is low.
The degree of polarization of a clear sky can be good estimated with the single scattering Rayleigh-sky model:
|
|
( 5) |
with
|
|
( 6) |
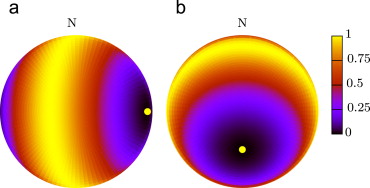
In Figure 6 one can see the relative degree of polarization of the sky, depending on the sun׳s position.
|
|
|
Figure 6. Relative degree of polarization of the sky with north at the top and the yellow dot marks the sun; (a) at sunrise and (b) at noon . |
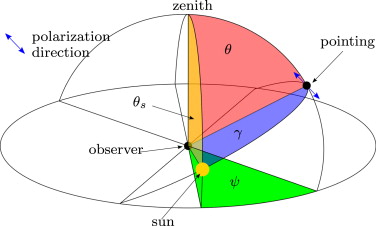
At sunrise or sunset in the east or west respectively a ribbon of highly polarized light spans from north – zenith – south. Whereas at noon, only the horizon is polarized. Coulson (1988) measured the degree of polarization of the sky in many experiments. He states a degree of polarization up to 90%. Furthermore, the direction of polarization of the sky can be determined with Figure 7 . If one builds a plane of the three points sun, observer and spot in the sky (blue plane), the polarization direction is always perpendicular to that plane.
|
|
|
Figure 7. Angular relation for the Rayleigh-sky model and scheme for determination of polarization direction. |
Taking these information into account it is easier to identify the situation which provokes the appearance of the anisotropies. To view it best one must substitute the point of the observer in Figure 7 with the façade glazing and look at the reflections of the highly polarized sky. Furthermore one must try to get the polarization direction parallel to the incident plane on the façade (see Section 4.1 ).
5. Method for quantifying the anisotropies
Digital image processing in photoelasticity is used for about three decades. In Ramesh (2000) the common techniques are prescribed. Also the image acquisition technology and the computing performance of common PC׳s have been improved rapidly during this time. So there is a good basis available for evaluating polariscope images of tempered glass panes.
In the following a method for quantifying the anisotropies full-field is proposed. This method works in a similar manner to which is known as RGB-photoelasticity which was proposed in Ajovalasit et al. (1995) . The RGB-photoelasticity is used to determine the order of the isochromatic fringes of a photoelastic model. The method prescribed here uses a digital-image-processing-system which acquires and analyzes images of a polariscope to determine the retardation. Finally, a subsequent statistical analysis leads to comparable quality-parameters regarding the degree of anisotropy.
5.1. Image acquisition
In principle, almost every digital camera is capable of acquiring polariscope images. But for the determination of retardations out of the isochromatic fringes all parameters regarding the exposure and image quality shall remain constant for a calibrated system. That means, it is constructive to remain with the exposure time, aperture, sensitivity of the sensors and the white-balance constant.
Normally, the dimensions of architectural glass panes are larger than 1 m2 , so it is not a practical solution to built a polarized light source with the dimensions of the pane. Therefore we use a setup with a commercial line-scan camera Dalsa Spyder3 Color (SC-34-02K80) with 2048 pixels in width and a common white LED bar light with a color temperature of 6500 K. The light of the LED bar is circular polarized with ITOS CP42HE polarization filters because of their high transmission in direction of polarization and a good blocking of the other directions for a large spectral bandwidth. Furthermore such foils can be easily applied to the bar lights. The analyzer is also made of a CP42HE but with a 90° rotated retarder.
With this setup it is possible to acquire images of glass panes with a width of 2.0 m and almost unlimited length. This leads to a resolution of about 1 mm/pixel which seems to be high enough, if one remembers the typical patterns (Figure 1 ; Figure 2 ) of the anisotropies.
5.2. Calibration
The calibration of the camera and polariscope system is the most important step to get high quality results out of the method.
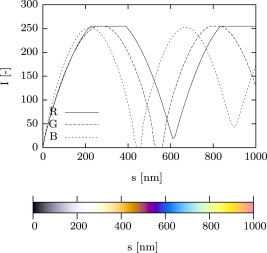
There is some previous work on determination of a color-retardation dependence. An actual and good overview is given in Sørensen (2013) . Here the analytic calculation of the interference color chart or also known as Michel–Lévy chart is prescribed (Figure 9 ). The so-derived charts are good to estimate the order of the fringe and therefore the retardation with the human eye. But it does not account for the artificial effects that arise in the light path and will lead to a color shift, for example the color change due to the color of the filters or the non-perfect horizontal wavelength-transmission characteristic of the polarization filter or the problems due to the different spectral sensitivities of the sensor and RGB-conversions. Hence it is a great effort to calibrate the color-retardation dependence for the whole system polariscope, glass and image acquisition system.
|
|
|
Figure 9. Interference chart, determined according to Sørensen (2013) . |
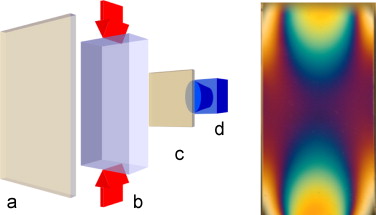
We conducted compression tests in a circular polariscope on small glass specimen to receive the sought-for relationship (Figure 8 ). Therefore the load was increased stepwise and images of the isochromatic fringes were acquired. With the aid of the stress-optical-law (Eq. (1) ) and the known principle stresses in that experiment the retardation can be determined and an array of ascending retardations and RGB-values can be built.
|
|
|
Figure 8. Left: setup of the calibration experiments – (a) polarizer, (b) specimen with applied compression force, (c) analyzer, and (d) camera; right: calibration image. |
5.3. Determination of retardation
The image of the glass pane (Section 5.1 ) delivers at each pixel values for the RGB channels (Rp , Gp , Bp ). For those values the retardation with smallest error according to Eq. (7) is searched in the calibration array with a parallelized loop algorithm:
|
|
( 7) |
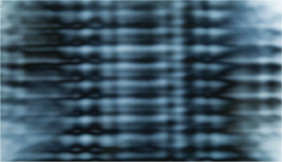
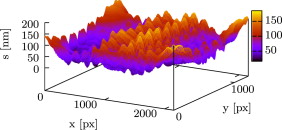
That means, for each pixel of the image the search-algorithm has to go through all rows i of the calibration array. This leads to a huge numerical effort, and perhaps computation time. For example if we have a 10 MPx Image and a calibration array from zero retardation to 1000 nm in steps of 1 nm Eq. (7) has to be times evaluated. The simplest approach to overcome this problem is to reduce the search range within the calibration array. Normally, if we have anisotropies due to a retardation above the first order (560 nm) it is not needful to know the exact retardation because this glass pane has such high anisotropies that it does not make sense to categorize it in another than the worst group. Furthermore due to the structure of the data and the algorithm it is easy to parallelize the code. We used the OpenMP interface for FORTRAN. The determination of the retardation of each pixel for a 5 MPx image and a search range from 0 to 1000 nm retardation took about 10 s on a common notebook with an INTEL®CoreTM i5-4200U CPU. If the search range is halved the CPU time is also halved. So for the practical usage of this code the performance is good enough. In Figure 10 one can see the source image of a circular polariscope of a toughened glass and the corresponding plot of the retardation determined with the proposed method in Figure 11 .
|
|
|
Figure 10. Source image for the determination of the retardation. |
|
|
|
Figure 11. Determined retardation of a sample glass pane with low anisotropies. |
Due to the fact, that anisotropies must always exist at the edges of the glass, it is advisable to cut the edges in the image for further processing of the determined data.
5.4. Quantifying the anisotropies
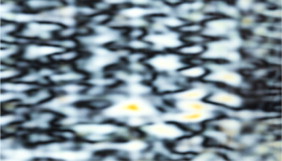
With the array of retardation it is possible to calculate in a first step the minimum and the maximum retardation to get the range of the occurring anisotropies. But for benchmarking these values should not be used, because it gives no information about the size of these large anisotropies on the glass. Therefore a statistical evaluation of the complete retardation array is more constructive. We propose to use certain p -quantiles for example 5% and 95% or 98% of the retardation. This leads to reference values for benchmarking of single glass panes of a batch. For example the quality criteria could be that no more than 100 nm retardation for 95% of the pixels of the glass pane area is allowed. So if one compare Figures 10 and 12 there are obviously higher anisotropies in the second image than in the first one. If we evaluate these two images with the prescribed method we obtain the characteristic values of Table 1 . Furthermore if one takes two p -quantiles into account, one can also determine how strong the anisotropy effect is noticed by the observer. For example if the values of retardation for the 5% and 95% quantiles are almost equal it must be hard for the observer to find anisotropies. But to reach such a condition the manufacturing must be highly optimized, because only small deviations of the pre-stress in the range of 1 or 2 MPa can lead to retardations around 200 nm depending on the glass thickness.
|
|
|
Figure 12. Example image with retardation up to 400 nm. |
| Figure | p -quantile | ||
|---|---|---|---|
| 5% | 95% | 98% | |
| 10 | 26 | 142 | 155 |
| 12 | 19 | 195 | 241 |
6. Discussion and conclusions
This paper gives an overview of the common problem of anisotropies in architectural applications. It starts with a search of the potential sources and their underlying physical effects. Furthermore it is shown that it is possible to determine benchmark values with a relative simple experimental setup and computer algorithm.
The sources of the anisotropy effect are natural polarized light in the environment and the anisotropic refractive index of stressed (unequal in the principle directions) glass, which leads to the birefringence. The appearance or the formation of polarized light in the environment is practically uncontrollable. So the only approach which reduce or eliminate this effect could be to reduce the unequal mechanical stresses in the glass. A reliable method is to use only annealed glass, because it is practically stress free. If it is not feasible due to structural requirements, one must keep the panes as thin as possible and use high quality glass from an optimized tempering process. However, the best available tempering process is not able to produce free of anisotropies. Only slight deviations in the principle stresses can lead to visible effects.
The architects and clients can get more reliability concerning the occurrence of anisotropies if they inspect a mock-up nearby the building site to incorporate the environment. The inspection shall take place when the degree of polarization of light is high and one can eliminate the most reflections with the right viewing-angle (see 4.1 ; 4.2 ). A further step towards quality assurance could be to scan the panes from the mock-up and the continued production with the method proposed in this paper. One can compare the images visually regarding the formation of stripes and spots, and reject glasses that offer another pattern than the mock-up panes. If this pattern is always equal and aligned at one façade it probably does not disturb the observer. The calculation of characteristic anisotropy values can aid in an objective evaluation. The necessary hardware (linescan camera, bar lights and polarization filters) for this procedure is relatively inexpensive and can amortize itself within a larger façade project. Otherwise, experienced institutions with the necessary equipment can provide their services.
However, for a widespread use of this method some further research has to be done to appreciate what value of retardation is achievable in practical production process and what maximum value is allowed in general, not only for a benchmark of a batch, but also for high quality, anisotropy free glass. Also the potential effect of different coatings on the anisotropy has to be determined in the future.
Acknowledgments
This work was supported by the Munich University of Applied Sciences and the Labor fuer Stahl- und Leichtmetallbau GmbH , Munich, Germany.
References
- Ajovalasit et al., 1995 A. Ajovalasit, S. Barone, G. Petrucci; Towards RGB photoelasticity: full-field automated photoelasticity in white light; Exp. Mech., 35 (1995) (1995), pp. 193–200 http://dx.doi.org/10.1007/BF02319657
- Arntzen et al., 2010 Arntzen, M., Dehner, H., Söder, B., 2010. Vorrichtung und Verfahren zur Herstellung thermisch vorgespannter Glasscheiben und thermisch vorgespannte Glasscheibe, Patent DE102008045416A1.
- Bucak et al., 2009 Ö. Bucak, M. Feldmann, R. Kasper, M. Bues, M. Illguth; Das Bauprodukt “warm gebogenes Glas” - Prüfverfahren, Festigkeiten und Qualitätssicherung; Stahlbau, 78 (S1) (2009), pp. 23–28 http://dx.doi.org/10.1002/stab.200910026 ISSN 1437-1049
- Coulson, 1988 Coulson, K.L., 1988. Polarization and Intensity of Light in the Atmosphere, Studies in Geophysical Optics and Remote Sensing. A. Deepak Pub, Hampton, VA, USA, ISBN 9780937194126.
- Dally and Riley, 1978 J.W. Dally, W.F. Riley; Experimental Stress Analysis (2nd edition), McGraw-Hill, New York (1978)
- Demtröder, 2013 Demtröder, Wolfgang Title: Experimentalphysik. Teil: 2. Elektrizität und Optik Place of Publication: Berlin Publisher: Springer Spektrum Edition: 6 ISBN 9783642299445 Year: 2013.
- Föppl and Mönch, 1972 L. Föppl, E. Mönch; Praktische Spannungsoptik, Springer Berlin Heidelberg, Berlin, Heidelberg (1972) http://dx.doi.org/10.1007/978-3-642-52168-3 ISBN 9783642521690
- Frocht, 1948 M.M. Frocht; Photoelasticity, Wiley, New York (1948)
- Gerthsen and Meschede, 2010 C. Gerthsen, D. Meschede; Gerthsen Physik; Springer-Lehrbuch (24th edition), Springer, Berlin (2010) ISBN 3642128947
- Kuske and Robertson, 1974 A. Kuske, G. Robertson; Photoelastic Stress Analysis, Wiley, London, New York (1974) ISBN 9780471511014
- LiSEC Group, 2011 LiSEC Group, HAL: Flatbed Tempering Oven, 2011.
- Minnaert, 1954 Minnaert, M.G.J. 1954. The Nature of Light & Colour in the Open Air. Dover, New York, ISBN 0486201961.
- Monnoyer and Lochegnies, 2008 F. Monnoyer, D. Lochegnies; Heat transfer and flow characteristics of the cooling system of an industrial glass tempering unit; Appl. Therm. Eng., 28 (17-18) (2008), pp. 2167–2177 http://dx.doi.org/10.1016/j.applthermaleng.2007.12.014 ISSN 13594311
- Ramesh, 2000 K. Ramesh; Digital Photoelasticity: Advanced Techniques and Applications, Springer-Verlag, Berlin and New York (2000) ISBN 9783540667957
- Schuler et al., 2012 C. Schuler, S. Stief, M. Elstner, M. Illguth, A. Lorenz; Einsatz von gebogenem Glas im Bauwesen; Stahlbau, 81 (3) (2012), pp. 190–196 http://dx.doi.org/10.1002/stab.201201530 ISSN 1437-1049
- Sørensen, 2013 B.E. Sørensen; A revised Michel–Lévy interference colour chart based on first-principles calculations; Eur. J. Miner., 25 (1) (2013), pp. 5–10 http://dx.doi.org/10.1127/0935-1221/2013/0025-2252 ISSN 09351221
- Wolf, 1976 H. Wolf; Spannungsoptik (2nd edition), Springer-Verlag, Berlin, Heidelberg, New York (1976)
Document information
Published on 12/05/17
Submitted on 12/05/17
Licence: Other
Share this document
Keywords
claim authorship
Are you one of the authors of this document?
