Abstract
This paper explores the problem-solving behavior of people in design activities through a protocol analysis of verbal reports on the interior work design process simulated by an interactive evolutionary computation (IEC). The protocol analysis method was used to explore the ways of thinking of the participants throughout the process. The analysis reveals that different parts of the interior scene have different effects on the evaluations, and people tend to use the same evaluation criteria continuously on several images. This kind of behavior is consistent with that of professional designers in past studies and is revealed applicable to non-professionals in the current research.
Keywords
Interior color ; Problem-solving behavior ; Protocol analysis ; Interactive evolutionary computation (IEC)
1. Introduction
1.1. Background and purpose
The present paper explores the problem-solving behavior of people in design works through a protocol analysis of a simulated design process using an interactive evolutionary computation (IEC) interior work design system developed by the authors (Huang et al., 2006 ).
The problem-solving behavior of people in design activities is considered an important research theme and has been studied for decades. Many studies have dealt with the complex activities in the manual design process that deal with diverse conditions and last for months, even years. In contrast to these studies, the present research employed the IEC interior work design process as a simulation of a manual design process and explored the problem-solving behavior of the participants.
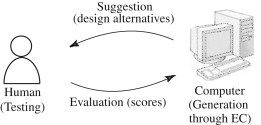
The IEC (Huang et al., 2006 ) is a method that evolves a series of design alternatives based on user evaluation. In the IEC process, the designer evaluates a group of design alternatives provided by the computer by assigning scores. The computer then generates new design alternatives based on the scores, which are then reevaluated by the designer. Therefore, the more preferred designs are effectively achieved as the interactive process proceeds (Fig. 1 ).
|
|
|
Fig. 1. Mechanism of the IEC method. |
According to the information processing theory (Newell et al., 1967 ), design problem-solving can be considered as the process of searching for proper solutions in the problem space through generative and test processes that provide a general structure for understanding the process of design. In the present series of research, the authors used the intelligent method of IEC to simulate this generate-and-test structure and provide a confined and comparable condition for exploring a design problem-solving behavior. Given that the generation of design alternatives is performed by computers and that people only test (evaluate) these alternatives in a design process via IEC, the present paper mainly focuses on the testing behavior in the interior design problem-solving process and reveals how participants filter different design alternatives and gradually develop their design ideas.
In a previous research on the design problem-solving behavior in a simulated design process via IEC (Huang et al., 2008 ), the sequence of evaluation operations were analyzed, revealing that the participants tended to decide early on matters they were more certain of and made harder decisions later; they also tended to use strategies that were more convenient for them. However, how the process was carried out in the minds of the participants is still unclear.
An experiment parallel to one of the previous studies, and which collected verbal reports from the participants in the same IEC process used in the previous research, was conducted to investigate this kind of problem-solving behavior in depth. A protocol analysis was then performed on the verbal reports.
1.2. Past studies
As an important research topic, the phenomena of human design problem-solving behavior have been investigated several times for decades. Some theoretical positions in the area of creative thinking have been posited in the past century.
Newell et al. (1967) introduced the information processing theory, which reasserts the primacy of essentially cognitive processes in explaining the problem-solving behavior. Problem-solving behaviors can be divided into three subclasses of activities: the problem presentation, solution generation, and solution evaluation. The problem-solving procedures are further categorized into trial-and-error procedures, generate-and-test procedures, mean-ends analysis, and problem-space planning, depending on the solution generation strategy.
The theoretical aspects of formalizing the design process were presented in the book, Psychology of Architectural Design by Akin (1986) . The book combines viewpoints from cognitive psychology, computer science, and architecture and discusses theories for codifying how people design; that is, how they think and create.
Meanwhile, a protocol analysis is a method of eliciting verbal reports on problem-solving sequences as a valid source of data on thinking (Ericsson and Simon, 1993 ; Ericsson, 2002 ). Many studies use the protocol analysis to reveal the problem-solving behavior of people in design tasks.
Takamatsu (1997) studied the design process of a real project that lasted for three months. Through the analysis of the verbal report of the designer when explaining the sketches he had drawn, the characteristics of the different design phases were clarified. Zhou et al. (2006) conducted an interview on the interior design preference in China. The relationship between the selection of a living room interior decoration by Chinese participants and their reported reasons for the selection was analyzed via the association rules. Do and Gross (2001) discussed the use of freehand diagrams in architectural design. They found that most empirical studies of design problem-solving involve the examination of design protocols.
These previous studies all focused on exploring the diverse manual design processes that deal with complex design conditions over a long period of time and employ diverse design methods. These points make it difficult to explore the design process and find common design problem-solving behavior phenomena using statistical analysis.
In contrast to the aforementioned studies, the current study explores a simulated design process via IEC. Given that the design process employing IEC is controlled, well-structured, and can be finished within one hour (Huang et al., 2008 ), the design problem-solving behaviors of different participants can be compared through statistical analysis. The results of the analysis may be helpful in understanding the manual design process of people.
2. Method
The experiment was conducted parallel to the research of Huang et al. (2008) . The verbal reports of eight participants, consisting of two architecture majors and six non-professional students (Huang et al., 2008 ), were collected for the protocol analysis.
2.1. IEC IW system
The IEC system of the IW design developed by Huang et al. (2006) was adjusted and used in the current research.
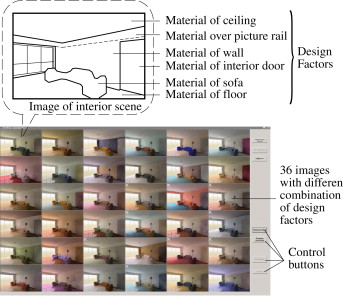
A typical living room of an apartment in Beijing was set as the design objective. Six IW factors, namely, the material of the ceiling, wall, floor, sofa, interior door, and the material above the picture rail, were evaluated in the IEC system. A certain combination of these factors was considered as a design alternative. In each step of the IEC process, the users were instructed to select several images according to their own aesthetic consideration, and the images were expected to gradually evolve into results closer to their ideas.
A high-resolution (1902×1200) widescreen LCD display was used in the experiment, with the IEC interface capable of simultaneously displaying 36 images (Fig. 2 ). The evaluation method via the assignment of scores to the images was simplified into the selection of several images in each step according to participant evaluation to make the IEC easier to use.
|
|
|
Fig. 2. Interface and design factors of the IEC interior color design system. |
When evaluating, the users could select an image by clicking the left mouse button. They could also remove (turn off) a disliked image from the interface via right-clicking, which made the comparison and evaluation easier.
2.2. Verbal report
A general “think-aloud with retrospective reports” method recommended by Ericsson and Simon (1993) was adopted for the experiment and used to collect utterances made by the participants while they were thinking.
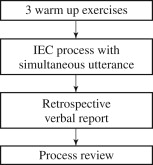
A common warm-up procedure was employed prior to the IEC process (Fig. 3 ). The participants were instructed to “think aloud” during the entire problem-solving procedure. “Think aloud” meant they could continuously speak aloud everything they were thinking of, as if they were alone in the room speaking to themselves (Ericsson and Simon, 1993 ). The participants were told that if they were silent for any long period of time, they would be reminded to keep talking. After the instructions, the participants were asked to do three warm-up practices, all speaking aloud everything they were thinking.
|
|
|
Fig. 3. Flow of the experiment with the verbal report. |
During the IEC process, the participants were asked to select images as instructed and “think aloud” at the same time. A video of the interface was recorded during the process, together with the verbal report (Akin, 1986 ).1
After the IEC process, participants were asked to make retrospective reports on the whole IEC process, which were also recorded for future analysis.
The verbal reports of eight Chinese-speaking scholars and students were analyzed. They were originally in Chinese and were translated into English by the authors.
2.3. Encoding and segmentation of the utterances
The utterances provided clues on the short-term problem-solving behavior with which the participants evaluated the individual images and were analyzed as a major source of information. The utterances of the eight participants were listened to by the authors sentence by sentence and segmented and encoded for analysis (Ericsson and Simon, 1993 ).
The utterances and activities of the participants were classified into consecutive problem-solving behavior records according to the following conditions:
- The participants commented on an image and they may or may not have operated on the image. This situation occurred most often.
- The participants operated on an image without making any comment.
- The participants stopped at a certain image and thought for seconds without making any comment or operation.
Using this method, 2307 problem-solving behavior records of the eight participants in the time sequence of the IEC process were identified. The recorded numbers for each of the participants in each step varied from 9 to 46.
The participants usually used a simple sentence to comment on the images, such as “The sofa is too red”, “ It is harmonious , good ”, “Too cold” , and so on. These sentences were used as the evaluation criteria and grouped into one of the following three variables in the records:
- OBJECT: Some examples are “sofa”, “floor”, and “all” (the entire image). If the participants did not mention which part they were referring to when commenting, the phrase “not mentioned” was used.
- PROPERTY: The participants used words such as “red”, “dark”, and “harmonious” to describe the OBJECT. Phrases that have the same meaning were encoded as the same PROPERTY; for example, “a little dark ” and “not bright enough ” were both encoded as “dark”.
- EVALUATION: The participants evaluated the OBJECT. The evaluation could either be positive (+1) or negative (−1), or sometimes not clearly mentioned.
If the participant gave more than a one-sentence comment on an image, variables like OBJECT2, PROPERTY2, EVALUATION2, and so on were used.
Aside from the evaluation criteria, the following parts were also included in the record:
- BEHAVIOR: Examples are “think”, “compare”, and “supposition” (e.g. the participant said the image could be better if a certain adjustment was made).
- OPERATION: The actions taken on the images were “remove” and “select”.
- COMMENT: These include comments that could not be classified within the previously mentioned categories. Phenomena found by the author were also recorded in brackets.
Table 1 shows a portion of the problem-solving behavior records. In the third step, participant 03F (participant No. 03, female) commented at the beginning that “This step is better ”. She first commented on an image that “The white sofa is good ” but she did not operate on it (time sequence No. 1). She then removed another image because “This one is too blurry ” (time sequence No. 2), before selecting a different image because “I like the light green tone ” (time sequence No. 3), and so on. Through segmentation and encoding, the utterances were made available for the subsequent quantitative analysis.
| Step | Time sequence | Evaluation criteria | BEHAVIOR | OPERATION | COMMENT or note (shown in bracket) | |||||
|---|---|---|---|---|---|---|---|---|---|---|
| OBJECT | PROPERTY | EVALUATION | OBJECT2 | PROPERTY2 | EVALUATION2 | |||||
| 3 | 1 | Sofa | White | 1 | This step is better | |||||
| 3 | 2 | nm | Blurry | −1 | r | |||||
| 3 | 3 | nm | Light green | 1 | s | |||||
| 3 | 4 | s | Shown before | |||||||
| 3 | 5 | s | (same as above) | |||||||
| 3 | 6 | nm | Light color | 1 | s | |||||
| 3 | 7 | nm | Light color | 1 | cp | s | ||||
| 3 | 8 | nm | Green | 1 | s | |||||
| 3 | 9 | Sofa | Khaki | −1 | r | |||||
| 3 | 10 | Sofa | Red | −1 | r | |||||
| 3 | 11 | nm | Tone | −1 | r | (red sofa) | ||||
| 3 | 12 | nm | Tone | −1 | r | (red sofa) | ||||
| 3 | 13 | Sofa | Brown | −1 | r | |||||
| 3 | 14 | Sofa | Brown | −1 | r | |||||
| ⋮ | ⋮ | ⋮ | ⋮ | ⋮ | ⋮ | ⋮ | ||||
Notes : nm=not mentioned; cp=compare.
The BEHAVIOR and OPERATION were not analyzed in this research. They were only included in the present paper to show the depth of information included in the problem-solving behavior records.
3. Analysis of the evaluation criteria in the utterances
3.1. OBJECT and EVALUATION criteria
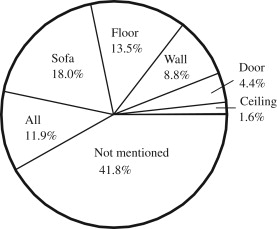
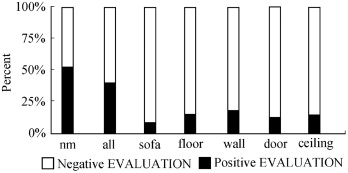
The OBJECT mentioned in the utterances of all participants (Fig. 4 ) were of two kinds: one was “all” and “not mentioned”, which did not refer to specific factors in the scene; and the other included the “sofa”, the “floor”, the “wall”, the “door”, and the “ceiling”, which referred to single factors. This result reveals that the participants evaluated the images using both the single factors and the general appearance.
|
|
|
Fig. 4. Relative frequency of the OBJECT. |
For OBJECTS referring to single factors, the frequencies of “sofa”, “floor”, and “wall” were significantly higher than those of “door” and “ceiling” (Fig. 4 ), suggesting that the sofa, floor, and wall were more often considered by the participants in the evaluation than the door and the ceiling. In fact, 02M said he “paid little attention on the door, and the door was always the last one considered ”. The other two participants who mentioned the door in retrospective reports (01M and 08M) said that “If the door was too much ugly, I would remove the image ”.
This phenomenon can be tentatively explained by the location and property of each OBJECT. In the rendered scenes, the floor, sofa, and wall were located in the middle part, so they tended to be considered more often than the door, which was located near the edge. In addition, because the sofa could easily be identified as the central object, it was mentioned more frequently than the floor and the wall, which were more likely regarded as background objects and were sometimes not clearly specified by the participants.
Although the ceiling was located in the upper-middle part of the image and had a large area, it was illuminated by light reflecting off the floor (Huang et al., 2006 ) and was darker than the other parts. Furthermore, the material samples of the ceiling in the IEC were generally similar, following the norm in China (Huang et al., 2006 ). These could be the reasons that the ceiling was seldom mentioned by the participants.
If the OBJECT and the EVALUATION were considered together (Fig. 5 ), the EVALUATIONS were mainly negative for OBJECTS referring to single factors, but “not mentioned” and “all” obtained significantly more positive EVALUATIONS. The results reveal that the participants tended to give a negative evaluation to an image because of a disliked single factor and were more likely to give a positive evaluation when considering the general performance. Participant 01M mentioned the existence of a “veto by one vote ” effect, which means that a disliked factor could lead to a rejection of the entire image. A few participants mentioned in the retrospective report that if the disliked single OBJECT were removed, the rest would, which supports the present conclusion.
|
|
|
Fig. 5. Relative frequency of the EVALUATION of OBJECT. |
3.2. PROPERTY criterion
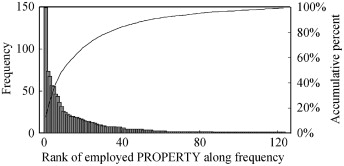
Eight participants used 123 words or phrases for PROPERTY in the IEC process. The frequency distribution of the words roughly followed Zipfs law2 , which states that only a few words are used very often, whereas many or most are rarely used (Fig. 6 ). The 10 most often used PROPERTY words are shown in Table 2 . They are all adjectives related to color, brightness, and harmony.
|
|
|
Fig. 6. Frequency of words/phrases involving PROPERTY and the frequency ranking. |
| Rank | PROPERTY | Frequency | Percent |
|---|---|---|---|
| 1 | Dark | 150 | 12.89 |
| 2 | Red | 74 | 6.36 |
| 3 | Disharmony | 68 | 5.84 |
| 4 | Ugly | 57 | 4.90 |
| 5 | Green | 56 | 4.81 |
| 6 | Harmony | 47 | 4.04 |
| 7 | Showy | 44 | 3.78 |
| 8 | Bright | 37 | 3.18 |
| 9 | Pink | 32 | 2.75 |
| 10 | Warm | 26 | 2.23 |
Note : The percentage calculation did not include records without any PROPERTY mentioned.
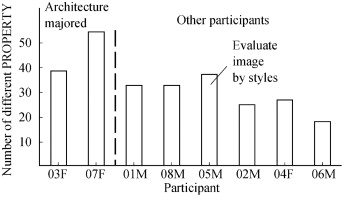
A comparison of the numbers of PROPERTY used by the participants is shown in Fig. 7 . The two architecture students generally used more PROPERTY words to describe the images. They could describe the images more accurately because they were trained in the aesthetic design area. Participant 05M also used several expressions for PROPERTY in his verbal report and tried to evaluate images based on their styles. He used criteria such as “This one is good for me as an engineer ”, “lovely , good for child ”, “feels like live in Europe ”, “middle class ”, “commercial space ”, and so on, which were quite different from those of the other participants ( Table 2 ). One possibility is that he used more expressions for PROPERTY than the others because he was trying to find the proper descriptions for the images.
|
|
|
Fig. 7. Number of PROPERTY used by each participant. |
3.3. Continuity in the evaluation criteria
The protocol records show that the evaluation criteria and the OPERATION were often used continuously along the time sequence. For example, the participant would continuously remove several images with disliked floors, or select a few images because they were bright. This kind of phenomenon is revealed by the analysis of continuity in the OBJECT, PROPERTY, and EVALUATION in the protocol records along the time sequence.
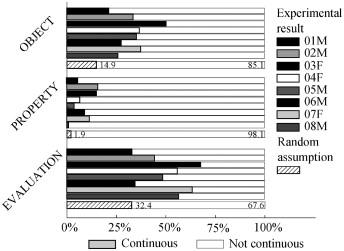
The variables of continuity for the OBJECT, PROPERTY, and EVALUATION were calculated to evaluate the frequency of the continuity of two consecutive records (Table 3 ). For example, in the Nos. 2 and 3 consecutive records, the OBJECTS were both “not mentioned;” thus, the “Continuity of OBJECT” of record No. 3 was 1, indicating that the OBJECT of record No. 3 was the same as the previous one. The participants frequently used the continuous evaluation criteria. The relative frequencies of continuities of all participants are shown in Fig. 8 and labeled as “experiment”.
|
|
( 1) |
where pi =relative frequency of each value of the variables in the experimental data; for example, the relative frequency of the “floor” and “sofa” of the OBJECT. n =number of different values of the variable.
| Time sequence | OBJECT | Continuity of OBJECT | PROPERTY | Continuity of PROPERTY | EVALUATION | Continuity of EVALUATION |
|---|---|---|---|---|---|---|
| 1 | Sofa | 0 | White | 0 | 1 | 0 |
| 2 | nm | 0 | Blurry | 0 | −1 | 0 |
| 3 | nm | 1 | Light green | 0 | 1 | 0 |
| 4 | 0 | 0 | 0 | |||
| 5 | 0 | 0 | 0 | |||
| 6 | nm | 0 | Tinge | 0 | 1 | 0 |
| 7 | nm | 1 | Tinge | 1 | 1 | 1 |
| 8 | nm | 1 | Green | 0 | 1 | 1 |
| 9 | Sofa | 0 | Khaki | 0 | −1 | 0 |
| 10 | Sofa | 1 | Red | 0 | −1 | 1 |
| 11 | nm | 0 | Tone | 0 | −1 | 1 |
| 12 | nm | 1 | Tone | 1 | −1 | 1 |
| ⋮ | ⋮ | ⋮ | ⋮ | ⋮ | ⋮ | ⋮ |
Notes : nm=not mentioned.
|
|
|
Fig. 8. Relative frequency of continuity (comparison between experimental result and random assumption). |
A comparison was conducted to demonstrate the significance of continuity in the evaluation criteria. If the continuity is assumed to not exert an effect, and the values of these variables appeared in the same frequency as the experiment but in a random sequence, the probability of continuity can be calculated using the following expression.
Considering that each participant may have used different sets of expressions to describe the images, the probability of continuity of the PROPERTY (random assumption) was first calculated for each participant and then averaged using the weight of the behavior record numbers of each participant. The probabilities of continuity under the random assumption are also provided in Fig. 8 and labeled as “random” for comparison.
The relative frequency of continuities in the experimental data was much higher than their probability under the random assumption, especially for the OBJECT and PROPERTY. The results reveal that the participants tended to use the same evaluation criteria and do the same operation continuously during the evaluation process, or they tended to group images with the same properties and evaluate them as a whole. This kind of behavior can be an effective method for people because they can use the same criteria to evaluate several images, and they do not have to change their mind constantly.
4. Conclusion
A protocol analysis of the verbal reports obtained from a simulated design process via IEC was conducted to reveal the way that participants think when solving design problems. Analyses were conducted based on the data obtained for simultaneous utterances, which provided evidence on short-term problem-solving tactics.
Protocol analyses of the evaluation criteria in the utterances reveal that different parts of the images had different effects on participant evaluations, and the participants always gave a negative evaluation to an image because of a single bad factor. In addition, when evaluating individual images, people tend to use the same evaluation criterion continuously for several images before switching to another criterion. The use of continuous criteria is more convenient and effective for the participants because they do not have to change their mind constantly.
The architectural design problem is an ill-defined one, and people have to define and redefine the problem in the design process to find a solution gradually (Rowe, 1987 ). Previous studies revealed the phenomena of “constancy of appreciation” and “selective inattention” of professional designers (Schön, 1983 ), which mean that at different moments in the design process, the attention of the designer is exclusively fixed on particular aspects of the problem that seem to warrant consideration while other problems are temporarily ignored. These phenomena are consistent with the continuity in the evaluation criteria found in the current research: the participants evaluated a certain aspect of several images continuously, and then switched to another criterion. In addition, because the non-professional participants in the present research had not been trained in design and their design problem-solving behavior remained “natural”, the design problem-solving behavior of “constancy of appreciation” and “selective inattention” are therefore not gained from professional training, but used naturally in design processes by common people.
As a simulation of a common design procedure, the present research used a controlled and well-structured model of the design process, which needed no professional knowledge or experience to proceed. To further benefit from this model, the authors can explore the design problem-solving behavior of common people in a comparable condition and find the commonalities and differences among the participants. In addition, because the design process using the IEC can be finished within one hour, the utterances, which can provide reliable data on problem-solving tactics, can be analyzed and the design problem-solving behavior of people can be explored in detail. The present research provides a different view of the design problem-solving behavior, and the findings can be complementary to those obtained from studies on common design processes.
Given that computers are expected to become increasingly capable in assisting people in generating design ideas, and non-professionals can become increasingly involved in design activities, this kind of interactive design process can become normal in the future. The interactive design process can be considered as a simulation of the real design process and be the real design process itself. The findings on the design problem-solving behavior in the present study are considered significant for future design practices. For example, the current findings can be used in a computer-aided design tool to anticipate human design behaviors in an interactive process and help people more efficiently. The findings can also be helpful in developing computer intelligence to solve complex problems.
References
- Akin, 1986 O. Akin; Psychology of Architectural Design; Pion, London (1986)
- Do and Gross, 2001 E.Y.L. Do, M.D. Gross; Think with diagrams in architectural design; Artificial Intelligence Review, 15 (135–149) (2001), p. 3
- Ericsson and Simon, 1993 K.A. Ericsson, H.A. Simon; Protocol Analysis: Verbal Reports as Data (Rev. ed.); MIT Press, Cambridge, MA (1993)
- Ericsson, 2002 Ericsson, K.A., 2002. Protocol Analysis and Verbal Reports on Thinking: An Updated and Extracted Version from Ericsson, 〈http://psy.fsu.edu/faculty/ericsson/ericsson.proto.thnk.html 〉.
- Huang et al., 2006 W.X. Huang, D. Matsushita, J. Munemoto; Interactive evolutionary computation (IEC) method of interior work (IW) design for use by non-design-professional Chinese residents; Journal of Asian Architecture and Building Engineering, AIJ, 5 (1) (2006), pp. 91–98
- Huang et al., 2008 W.X. Huang, D. Matsushita, J. Munemoto; Designers evaluation process in simulated design process for interior works using interactive evolutionary computation; Journal of Architecture, Planning, and Environment Engineering, AIJ, 73 (629) (2008), pp. 1457–1462
- Newell et al., 1967 A. Newell, J.C. Shaw, H.A. Simon; The process of creative thinking; H. Gruber, G. Terrell, M. Wertheimer (Eds.), Contemporary Approaches to Creative Thinking, Atherton Press, New York (1967), pp. 63–119
- Rowe, 1987 P.G. Rowe; Design thinking; MIT Press, Cambridge, MA (1987)
- Schön, 1983 D.A. Schön; The Reflective Practitioner: How Professionals Think in Action; Basic Books, New York (1983)
- Takamatsu, 1997 Takamatsu, S., 1997. Basic study of the role of language in architectural design: analysis on designers sketch and utterance. Doctoral Dissertation, Kyoto University, Kyoto, Japan.
- Zhou et al., 2006 X.H. Zhou, J. Mumemoto, T. Yoshida; Mining association rules between selections and their reasons of interior decoration in living room: research on apartment interior works in Beijing (3); Journal of Architecture, Planning, and Environment Engineering, AIJ, 610 (2006), pp. 9–16
Notes
1. Camtasia Studio, developed by TechSmith, was used in the experiment to record the video of the interface and audio of the verbal report. (http://www.techsmith.com/camtasia.asp )
2. Zipf s law states that, in a corpus of natural language utterances, the frequency of any word is roughly inversely proportional to its rank in the frequency table.
Document information
Published on 12/05/17
Submitted on 12/05/17
Licence: Other
Share this document
Keywords
claim authorship
Are you one of the authors of this document?
