Abstract
A field survey on energy consumption by hot water supply and cooking was conducted in two cities in China, Nanjing, and Hefei. In each city, 5 housing complexes were selected, and approximately 100 or 200 residential units were selected from each of them. The following items were surveyed: (1) fundamental information, such as number of family members, data on residents, etc., (2) bathing style, and (3) frequency of cooking and cooking time. Most of the residents take showers seven times a week in the summer, but less frequently in the winter. In contrast, the frequency of taking baths increases to several times a week during the winter, compared with 0 or 1 times a week in the summer. These results differ slightly depending on the heating and cooling systems used in the houses. The frequency with which people cook in their own houses ranges from 4 to 7 times a week, which means that “eating out” is relatively frequent, although the result differs significantly among the housing complexes. Distribution of the cooking time has usually two peaks at 20 to 30 min and 50 to 60 min (or 30 to 40 min and longer than 60 min) for lunch and dinner, respectively. The high energy consumption for cooking might be due to the long cooking time.
Keywords
Energy consumption ; Hot water supply ; Cooking ; Field survey ; Chinese city
1. Introduction
In Japan, as of 2008, carbon dioxide emissions have risen by 7.5% over the 1990 levels (Ministry of the Environment, 2009 ). Among five sectors (industry, housing, commerce, transportation, and power generation), the housing and commerce sectors have maintained a high growth rate of carbon dioxide emissions.
When energy consumption in the housing sector is broken down, 30% is used for domestic hot water, 20% for space heating and cooling, and 50% for lighting and other home electric appliances (Hasegawa and Inoue, 2004 ; Murakami et al ., 2006 ). Thus, a reduction in energy consumption for hot water supply is very important. In order to reduce energy consumption for domestic hot water, various types of highly efficient hot water heaters have been introduced. Along with this effort, the demand for hot water should also be reduced. However, taking a bath every day is a “must” for most Japanese people and their lifestyle has barely changed (Inoue et al., 2006 ).
The survey on energy consumption in residential buildings in China by Kan et al. (2007) showed that a large proportion of energy is used for cooking. This seems strange because many Chinese people prefer to eat out quite often, as is particularly the case for dual-income couples. On the other hand, people in China usually take showers, not hot baths, and thus less energy is used for hot water supply. However, this bathing style may be changing, given the increase in the population living in urban areas. Recently, many condominiums offered for sale have advertised that they have two bathrooms in each residential unit, which may reflect a change in lifestyle from rural to urban. If so, one can predict that energy consumption for hot water will increase very quickly in the near future, since a drastic concentration of people in the urban areas is occurring in China. Although these factors (cooking and bathing) will significantly influence future energy consumption in China, not enough is known to allow accurate predictions.
Therefore, we conducted a field survey in two cities, Nanjing and Hefei, in China. The following items were surveyed: (1) fundamental information such as number of family members, data on residents, etc., (2) bathing style, and (3) frequency of cooking and cooking time.
2. Outline of questionnaire on bathing and cooking
2.1. Surveyed cities
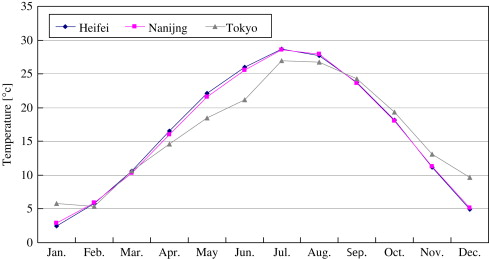
We conducted a field survey in two cities in China, Nanjing and Hefei, whose populations are 7.4 million and 4.5 million, respectively. The monthly average temperatures in Nanjing and Hefei as well as those in Tokyo are shown in Figure 1 .
|
|
|
Figure 1. Monthly average of outdoor temperatures in Nanjing, Hefei, and Tokyo. |
2.2. Surveyed items
- Fundamental information regarding residential building and residents
Data regarding the residential building and the residents, number of family members, indoor thermal environment, consciousness regarding energy use, cost, etc.
- Bathing style and related energy use
Bathing installations (shower or bathtub), hot water supply system, frequency of taking baths or showers, etc.
- Cooking style and related energy use
Cooking appliances, fuels used for cooking, frequency of cooking, cooking time, etc.
2.3. Surveyed housing complexes
In each city, we selected five housing complexes. From each complex, approximately 100 or 200 residential units were selected. Data on the 10 complexes is listed in Table 1 .
| Name of complex | Number of units | Number of respondents (units) | Year of construction | Distance to center district (km) | Remarks | |
|---|---|---|---|---|---|---|
| Nanjing | NA | Unknown | 100 | 1980–1990 | 3 | Low income |
| YO | 1280 | 101 | 2000 | 4 | High income | |
| JU | 830 | 100 | 2003 | 5 | High income | |
| RO | 1416 | 198 | 2006–2008 | 8 | Under construction | |
| SO | 1134 | 100 | 2005 | 9 | Middle income | |
| Hefei | KO | 5000 | 192 | 1990–2003 | 2 | Combined with small store |
| SA | 3700 | 176 | 1985–1987 | 3 | Oldest complex | |
| SE | 4500 | 186 | 1999 | 4 | Combined with commerce | |
| KI | 2804 | 200 | 2003 | 7 | High income | |
| KA | 835 | 153 | 1997 | 10 | For once a farmer |
The sizes of the complexes ranged from 830 to 5000 families (units). The oldest one was constructed in the 1980s; the newest one was still under construction (at the time of the survey). There was wide variance in the average family income as well.
Since the questionnaires were collected directly from the residents by several students and staff members of the universities that were participating in the research, the questionnaire recovery rate was high.
3. Results of survey: Hot water supply
3.1. Bathing installations (shower or bathtub)
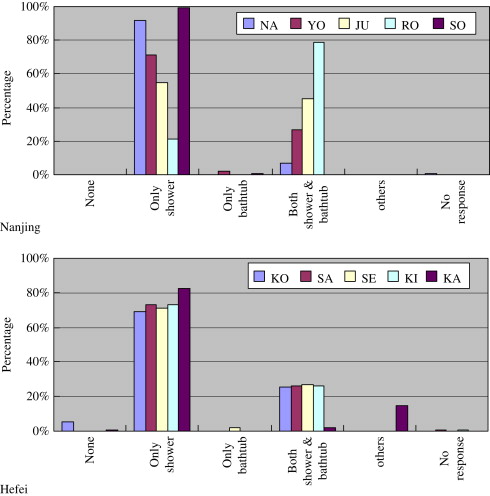
With regard to bathing installations (shower or bathtub), a large proportion of the families had only a shower, both in Nanjing and in Hefei, as shown in Figure 2 . The proportion ranged from 20 to 100% in Nanjing depending on the complex, while it was approximately 70% in Hefei except for one complex. Families having only a bathtub were rather infrequent, and the rest of the families had both a shower and a bathtub. The percentage who had both was particularly high (80%) in complex “RO” in Nanjing because it was the newest and most modernized one, and having both was the standard design, whereas some of the units (20%) were designed to have only a shower.
|
|
|
Figure 2. Bathing installations. |
|
|
|
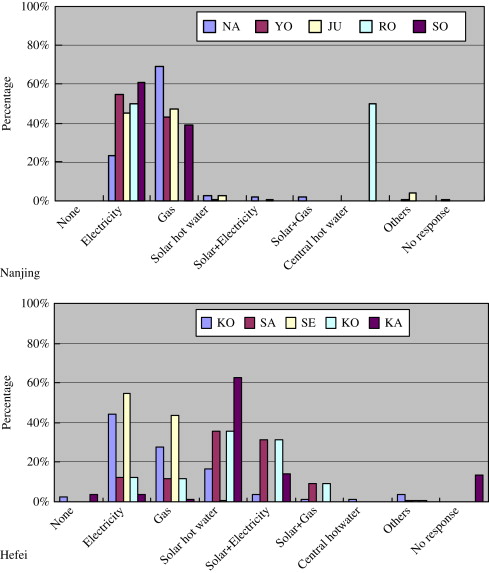
Figure 3. Hot water supply systems. |
3.2. Hot water supply system (Figure 3 )
For hot water supply, an electric or gas system was used for almost half of the families in Nanjing, except for the complex “RO”, in which an electric system and a central system each supplied half of the hot water; these systems were the standard types for hot water supply in this complex.
In contrast, hot water systems powered by electricity, gas, solar energy, and a combination of solar energy and electricity were used in almost the same ratios in Hefei. Up to approximately 60% of the families had introduced solar systems, even though most of the surveyed condominiums were higher than ten stories.
3.3. Frequency of taking baths or showers
The questionnaire asked how many showers or baths were taken in a week, during both summer and winter, by each family member. It also asked about the times of showers and baths, and how hot the water was, during both summer and winter.
3.3.1. Frequency of taking showers in summer
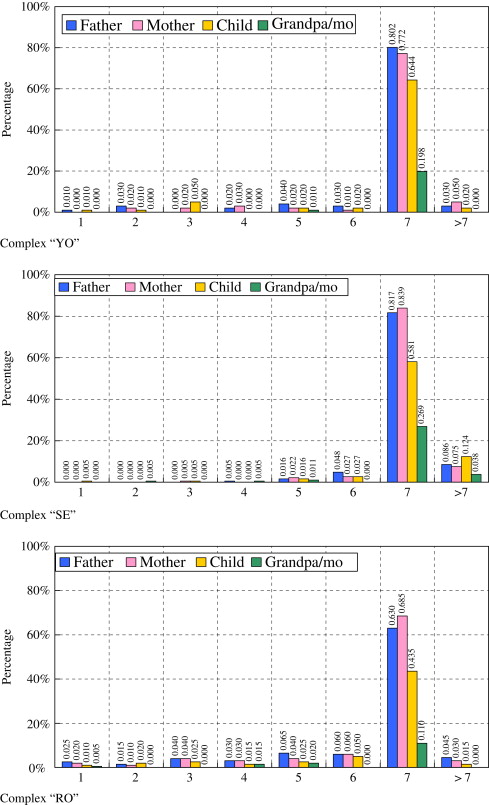
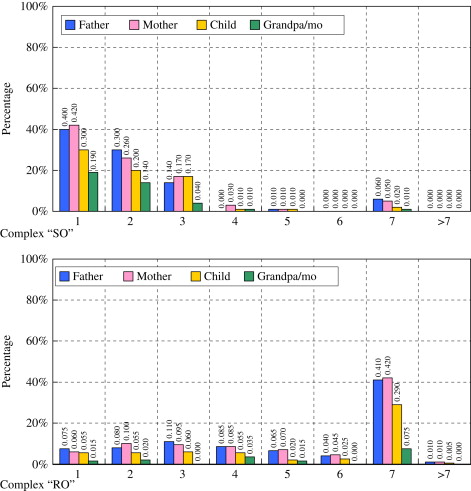
Figure 4 shows the frequency of taking showers during a week in three complexes, “YO”, “SE”, and “RO”. The color codes on the bars are for male host (blue, called “father” hereafter), female host (pink, mother), child (yellow), and the rest (green, grandfather/mother). In complexes “YO” and “SE”, 85% of both fathers and mothers took a shower seven times a week (every day) or more. Children took showers less frequently; only 20 to 30% of grandparents took showers.
|
|
|
Figure 4. Frequency of taking shower in summer. |
|
|
|
Figure 5. Frequency of taking showers in winter. |
|
|
|
Figure 6. Frequency of taking baths in summer. |
|
|
|
Figure 7. Frequency of taking baths in winter. |
The complex “RO” showed a slightly different result. The percentage of families taking showers seven times a week or more was less than 70%, perhaps because the room temperatures were kept relatively low in summer by the central air-conditioning system so that the residents perspired less.
3.3.2. Frequency of taking showers in winter (Figure 5 )
In the complex “SO”, the percentage of residents who took showers seven times a week drastically decreased to approximately 5% in winter, whereas the percentage of families taking showers only once a week increased to 40%. The percentage taking showers less than four times a week amounted to 80%. The patterns in most of the other complexes were similar. This change seems natural from a physiological point of view, since perspiration decreases due to the low temperatures in winter.
However, in complex “RO”, approximately 40% of the families took showers seven times a week—only a slight decrease from the rate in summer. Furthermore, the percentages of families taking showers from one to six times a week are equally distributed. In this complex, a floor heating system operated during the winter; thus, the indoor thermal environment was much better (warmer) than in other complexes.
3.3.3. Frequency of taking baths in summer (Figure 6 )
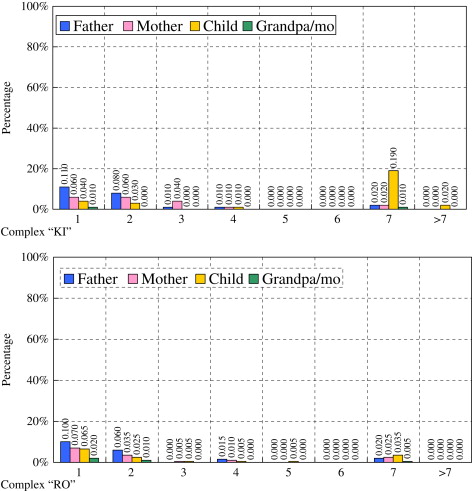
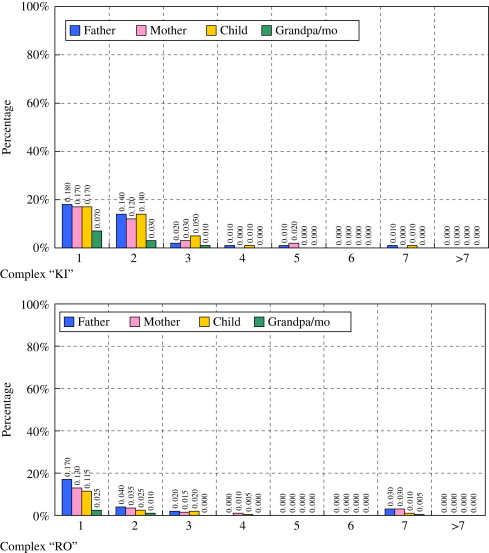
In summer, baths were taken far less often than showers; only approximately 10% of the families took baths once or twice a week. This is rather different from Japanese custom. (The children recorded as taking baths seven times a week might actually have been the bathing of babies.)
3.3.4. Frequency of taking baths in winter (Figure 7 )
Although most of the families took baths less than three times a week, families took baths in winter about twice as often as in summer. Although there is no large difference in the frequency of taking baths in summer between the complexes “KI” and “RO”, the frequency in complex “KI” in winter is twice that in complex “RO”, probably because the room temperatures in complex “RO”, were higher since it was centrally heated.
4. Survey on cooking
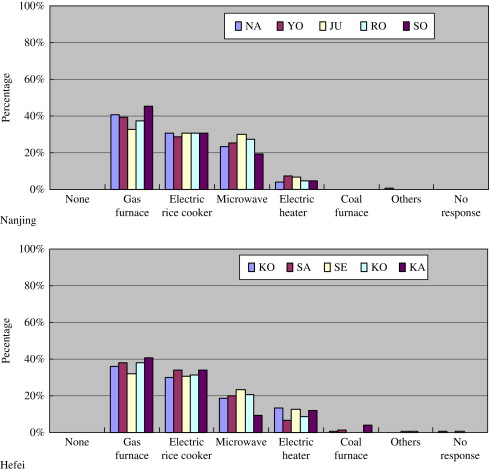
4.1. Appliances for cooking rice (staple food)
Figure 8 depicts the appliances used for cooking rice in Nanjing and Hefei (multiple responses are allowed). The results are almost the same in both cities, that is, a gas stove is used by 40% of the families, an electric rice cooker by 30% of the families, and a microwave oven by 25% of the families. Other appliances are not used as much.
|
|
|
Figure 8. Appliances used for cooking rice. |
|
|
|
Figure 9. Fuels for cooking. |
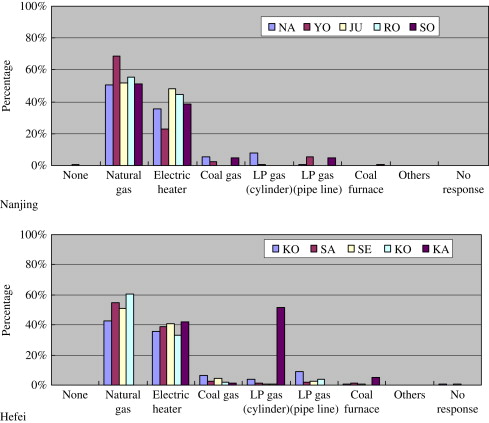
4.2. Fuels for cooking (Figure 9 )
Natural gas was used for cooking by approximately 50% of the families, and electricity by approximately 40%. Other fuels were not used, except for LPG (cylinder), used in only one complex.
4.3. Frequency of cooking
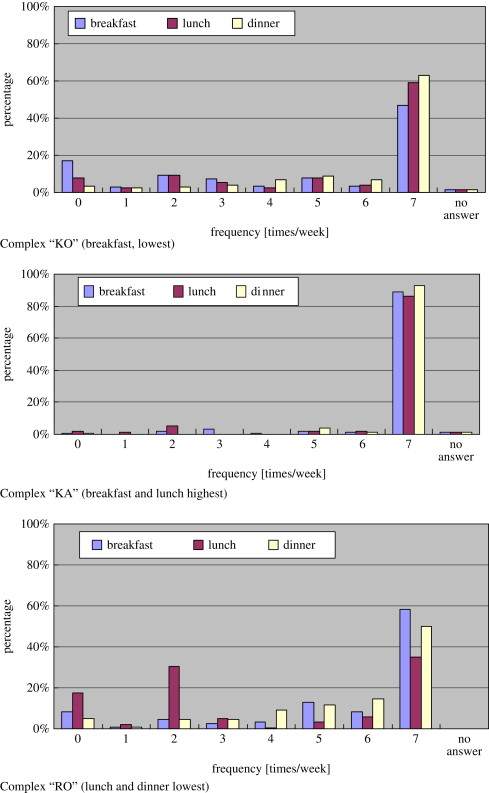
Figure 10 shows the frequency of cooking breakfast, lunch, and dinner each week in three housing complexes.
|
|
|
Figure 10. Frequency of cooking. |
|
|
|
Figure 11. Cooking time. |
4.3.1. Breakfast
The percentage of families cooking breakfast seven days a week is 60% on the average, the lowest being 45% (complex “KO”), and the highest 88% (complex “KA”). This result indicates that breakfast is “eaten out” much more often than in Japan. The reason for the high percentage in complex “KA” may be the residents’ past lifestyle as farmers.
4.3.2. Lunch
The percentage of families cooking lunch seven days a week is 63% on the average, the lowest being 35% (complex “RO”), and the highest 86% (complex “KA”). The percentage of families cooking lunch twice a week is relatively high (second). This might result from cooking on the weekend.
4.3.3. Dinner
The percentage of families cooking dinner seven days a week is 74% on the average, the minimum being 50% (complex “RO”), and the maximum 93% (complex “KA”). Compared with breakfast and lunch, the percentage of families that cook dinner is high. The percentage of families that cook dinner is lowest in the complex “RO”, perhaps because most of the families in this complex were young, dual-income couples.
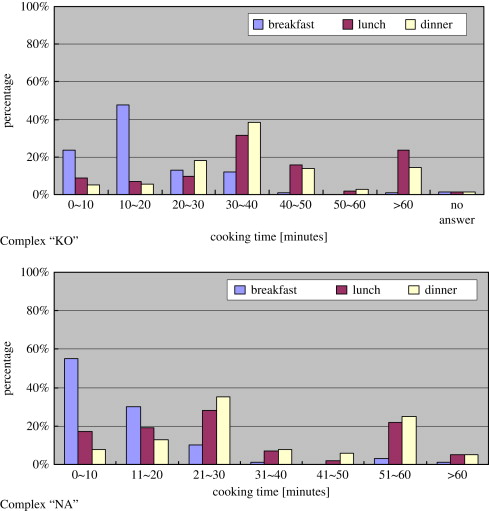
4.4. Cooking time (Figure 11 )
The cooking time for breakfast was 0–10 min or 10–20 min for most families, whereas the cooking time for lunch or dinner formed two peaks at 20–30 min or 50–60 min. These times were longer by 10 min in other complexes. The cooking time for dinner tended to become longer. These figures indicate that a large amount of energy consumption for cooking may result from a longer cooking time for lunch and dinner.
Since the frequency of cooking is closely related to the residents’ occupation (dual income), ages, structure of the family members, the distance from the city center, eating facilities, etc., the connections to these factors should be examined.
5. Discussion
5.1. Relationship between bathing in summer and winter
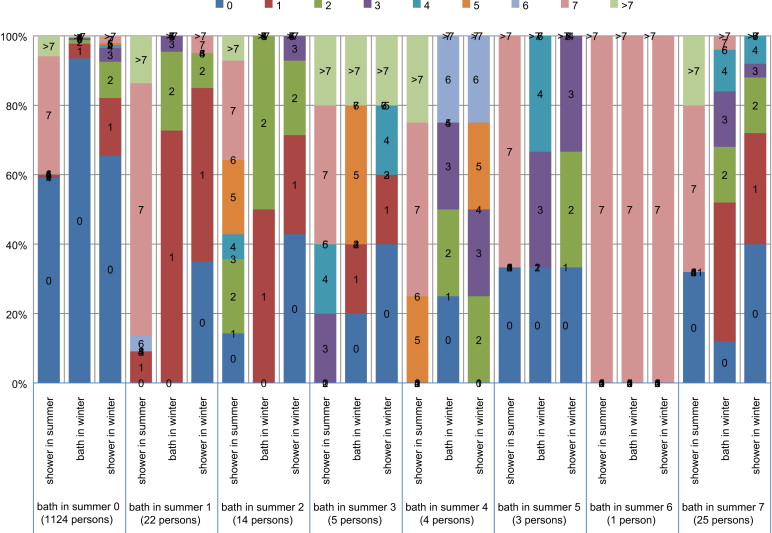
In summer, the frequency of taking showers was much greater than that of taking baths, and the families who took baths once a week was no more than 10%. In contrast, the frequency of showers in winter drastically decreased to 1–3 times a week, while the taking of baths increased.
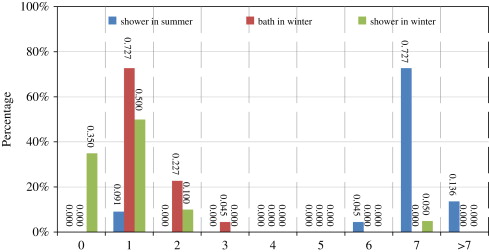
Figure 12 shows the frequency of taking showers in summer and in winter, and taking baths in winter for the residents in housing complex “KO” who took baths once a week in summer (22 persons). Most of these people took showers seven times or more a week in summer, and did not take showers or took one once a week in winter, when the frequency of bath taking was once (78%) or twice (22%). The bath was usually taken simultaneously with a shower. The reasons for the decrease in taking showers in winter were probably a lower perspiration rate than in summer and low indoor temperature (in the bathroom). On the other hand, the fraction of the residents who took baths 1–2 times a week in winter increased, probably not so much for cleaning their bodies as for warming and/or healing their bodies. This is similar to Japanese custom (Hirate et al ., 1993 ; Kondo and Hokoi, 2010 ).
|
|
|
Figure 12. Frequency of taking showers in summer and taking baths in winter by the residents who took baths once a week in summer (complex “KO”). |
Figure 13 depicts the same situation for the people who took baths 0–7 times a week in summer. The residents who did not take baths in summer occasionally took baths in winter. However, the frequency of taking baths in winter decreased for the residents who took baths more than three times a week in summer, since the total number of showers or baths decreased in winter, again probably because of the lower temperature and lower rate of perspiration.
|
|
|
Figure 13. Frequency distribution. |
5.2. Energy consumption by hot water supply
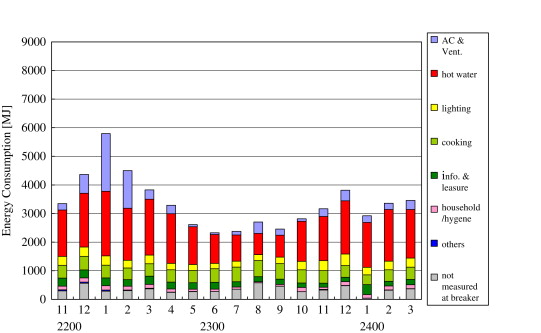
Figure 14 presents the annual fluctuations in energy consumption in western Japan (Kinki district) (AIJ, 2006 ). The energy consumption for hot water increases in winter and it is closely related to the increase in the frequency of taking baths.
|
|
|
Figure 14. Annual variations in hot water energy consumption in Japan (AIJ, 2006 ). |
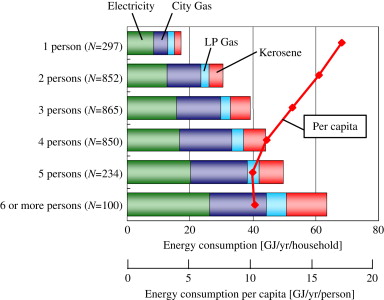
Figure 15 shows the annual energy consumption for hot water per household and per person (Inoue et al., 2006 ). It is evident that although the energy consumption increases with the family size (number of family members), the consumption per person decreases with the family size. Since the single child policy has been established in China, the energy consumption for hot water will probably increase in the near future, along with the increase in the total population, even though the situation in Japan cannot be directly applied to China.
|
|
|
Figure 15. Energy consumption for hot water supply per household and per person Mizutani et al. (2006) . |
Further research should be conducted in order to find out how much the energy consumption depends on the frequency and style of bathing (taking shower or a bath).
Since the taking of a shower and/or a bath is related to the residents’ occupation, ages, level of income (housing complex), lifestyle, and air-conditioning systems, a more detailed analysis should be pursued. This would be particularly important for predicting energy consumption in the future since the proportion of people living in the urban areas will increase.
6. Conclusions
From the questionnaire survey conducted in the two cities in China, the following fundamental information was obtained.
- Most of the residents take showers seven times or more a week in the summer, but less frequently in the winter. In contrast, the frequency of taking baths increases to two to three days a week during the winter, compared with 0 or 1 day a week in the summer. However, these results differ slightly depending on the heating and cooling systems used in the houses.
- The frequency with which people cook in their own houses ranges from 4 to 7 times a week, which means that eating out seems relatively frequent, although the result is significantly different between the housing complexes. Distribution of the cooking time has usually two peaks at 20 to 30 min and 50 to 60 min (or 30 to 40 min and longer than 60 min) for lunch and dinner, respectively. The large energy consumption for cooking might be due to the long cooking time.
Acknowledgements
This research was partly supported by JSPS (Japan Society for the Promotion of Science ; the main researcher, Junzo Munemoto) and the TOSTEM Foundation for Construction Materials Industry Promotion (the main researcher, Shuichi Hokoi). We extend our gratitude to them.
References
- Architectural Institute of Japan, 2006 Architectural Institute of Japan; Energy consumption for residential buildings in Japan; Architectural Institute of Japan, 8 (2006) 2006
- Hasegawa and Inoue, 2004 Y. Hasegawa, T. Inoue; Energy consumption in housing on the basis of national scacle questionaire: study on influence of residential characteristic and dispersion of energy consumption Part 1; Journal of Environmental Engineering, Architectural Institute of Japan, 583 (2004), pp. 23–28 Sep. 2004
- Hirate et al., 1993 K. Hirate, M. Kamata, H. Ishiwatari, Y. Kuwasa, N. Ichikawa, A. Ito, Y. Asano, F. Kiya, K. Bohgaki, M. Tanaka; Study on design criteria for domestic hot water supply system by the investigation with questionnaires Part 2: Investigation of bathroom and dressing room, and required standards for using hot water; The Society of Heating, Air-Conditioning and Sanitary Engineers of Japan, 52 (1993), pp. 71–80 June 1993
- Inoue et al., 2006 T. Inoue, S. Mizutani, T. Tanaka; Energy consumption in housing on the basis of national scale questionnaire: analysis of influence of various factors on annual energy consumption Part 2; Journal of Environmental Engineering, Architectural Institute of Japan, 606 (2006), pp. 75–80 Aug. 2006
- Kan and Yoshino, 2007 C. Kan, H. Yoshino, et al.; Field survey on heating/cooling loads and end-use energy consumption in China; Summary of SHASE Annual Meeting (2007), pp. 387–390
- Kondo and Hokoi, 2010 Kondo S., Hokoi S., 2010, Relationship between domestic hot water consumption and indoor thermal environment in Japan. In: The Proceedings of IAQVEC 2010.
- Ministry of the Environment, 2009 Ministry of the Environment 2009: 〈http://www.env.go.jp/earth/ondanka/ghg/〉
- Mizutani et al., 2006 S. Mizutani, T. Inoue, T. Oguma; Energy consumption for different uses in housing and energy usage: analysis based on national scale questionnaire; Journal of Environmental Engineering, Architectural Institute of Japan, 609 (2006), pp. 117–124 Nov. 2006
- Murakami et al., 2006 S Murakami, K Bogaki, T Tanaka, H Hayama, H Yoshino, S Akabayashi, T Inoue, A Iio, S Hokoi, A Ozaki, Y. Ishiyama; Detail survey of long-term energy consumption for 80 houses in principle cities of Japan—Description of the houses and end use structure of annual energy consumption; Architectural Institute of Japan, 603 (2006), pp. 93–100
Document information
Published on 12/05/17
Submitted on 12/05/17
Licence: Other
Share this document
Keywords
claim authorship
Are you one of the authors of this document?
