Abstract
Shading systems improve building energy performance and occupant comfort by controlling glare, natural lighting, and solar gain. Integrating PV (photovoltaics) in shading systems opens new opportunities for BIPV (building integrated photovoltaics) on façades. A key problem of such systems is mutual shading among PV modules as it can lead to electrical mismatch losses and overheating effects. In this work, we present a new modeling framework, which couples parametric 3D with high-resolution electrical modeling of thin-film PV modules to simulate electric energy yield of geometrically complex PV applications. The developed method is able to predict the shading pattern for individual PV modules with high spatio-temporal resolution, which is of great importance for electrical system design. The methodology is applied to evaluate the performance of different dynamic BIPV shading system configurations, as well as its sensitivity to façade orientation and module arrangement. The analysis shows, that there is a trade-off between tracking performance and mutual shading of modules. Distance between modules is a critical parameter influencing the amount of mutual shading and hence limiting solar irradiation and electricity generation of PV shading systems using solar tracking. Planning of module string configuration, PV cell orientation, and location of bypass diodes according to partial shading conditions, reduces electrical mismatch losses and results in significantly higher electricity generation. The integration of parametric 3D and electrical modeling opens new possibilities for PV system design and dynamic control optimization. Though the analysis focuses on BIPV, the method is useful for the planning and operation of solar tracking systems in general.
Introduction
In order to reduce fossil primary energy demand and its effects on the global climate, energy strategies aim at increasing efficiency along with the use of renewable sources. As the building sector contributes significantly to energy use and greenhouse gas emissions, the EU aims for all newly constructed buildings to have close to zero net energy consumption by 2020. The realization of this goal requires local energy harvesting, and the integration of PV (photovoltaic) systems in buildings is an obvious choice for many climatic regions. Due to strong cost reductions and technical developments of PV systems in recent years, there is a growing opportunity for integrating PV elements into buildings. Implementations of BIPV (building integrated photovoltaics) include rooftop installations, external building walls, or semitransparent façades. Even though façade PV systems receive less irradiation than rooftop and ground installations, they open new application possibilities for BIPV in the urban context and can substantially contribute to electricity generation, with higher production in winter and potentially lower diurnal and seasonal variations. Moreover, façade BIPV systems can replace conventional building materials, such as the shading system, thus avoiding related costs and environmental impacts [1].
Building shading systems are an important architectural element, simultaneously influencing building appearance, its energy performance, and occupant comfort. Shading systems can control glare, natural lighting and solar gain, thereby offering reductions in energy demand for heating and cooling. Architectural implementations range from static elements and traditional blinds to automated shading systems. Dynamic shading systems that are capable of reacting to their external environment can result in high-energy savings when compared to static shading systems [2]. The mechanics required to actuate such systems couples seamlessly with the mechanics required for façade integrated PV solar tracking. With the increased use in large window openings and curtain walls in todays architecture, there is a growing opportunity to integrate PV elements into such shading systems [3-7].
A key problem with many PV installations, in particular for tracking systems and tightly integrated building applications, is shading among PV modules and by objects in the environment. Module shading can lead to electrical mismatch losses and overheating effects, thereby affecting power output and system reliability [8, 9]. Possible proposed solutions to reduce these adverse effects include optimized PV module distribution and tracker control to circumvent shading [10-13] or electrical configurations of a PV array to minimize power losses, such as the inclusion of bypass diodes or series/parallel circuit designs [8, 14-16].
Several approaches to model the effect of shading on PV systems power output have been proposed in the literature [8, 17-28]. Only few of the developed models have a resolution high enough to capture the electrical effects of small area shadows, such as those from antennas, chimneys, or other PV modules [28]. In addition, state-of-the-art modeling tools for PV systems simulation consider shading only for simplified conditions, that is, flat, rectangular PV modules, uniform module positioning, and regular building geometries and environments. Some recent studies use architectural 3D modeling software such as AutoCAD or SketchUp for the calculation of PV module shading and combine it with PV electrical modeling at cell level resolution [28-30]. Such a 3D modeling framework provides much higher flexibility than conventional tools in defining arbitrarily shaped objects, realistic building environments, and elevation profiles. The approach is very promising for integrated architectural and technical planning of BIPV systems and provides an opportunity for the development of innovative BIPV solutions.
In this work, we combine for the first time a high-resolution shading analysis performed with the Rhinoceros 3D software [31] and the parametric Grasshopper plugin [32] with electrical modeling of thin-film PV modules at subcell level resolution. We employ the model to analyze mutual shading, solar insolation, and electric energy yield of dynamically actuated PV modules in a building environment. The method we have developed can accurately predict the shading pattern for individual modules with high spatial resolution. The geometrical simulation is coupled with irradiation data and applied to assess solar insolation for various dynamic shading system configurations, including one-axis actuated horizontal and vertical louver blinds, as well as more complex geometries, such as two-axis actuated rectangular modules in a diamond pattern. The irradiation and shading simulation is coupled with a high-resolution electrical model of monolithic thin-film PV modules to evaluate the effect of different electrical configurations on array efficiency.
We begin in 'Methodology' by describing the framework and methodology used for the parametric 3D and electrical simulations. In 'Solar Insolation Analysis', we analyze module shading and resulting solar insolation as a function of tracking system type, façade orientation, and module distance. In 'Electrical Performance Analysis', we discuss the electrical system design and performance as a function of relevant parameters for the different shading system configurations analyzed. In 'Experimental Implementations', we show experimental measurement results of thin-film PV module performance in partial shading conditions and progress leading to building integration. In 'Discussion and Conclusions', we summarize the results and discuss limitations and possible advancements of this work.
Methodology
General approach
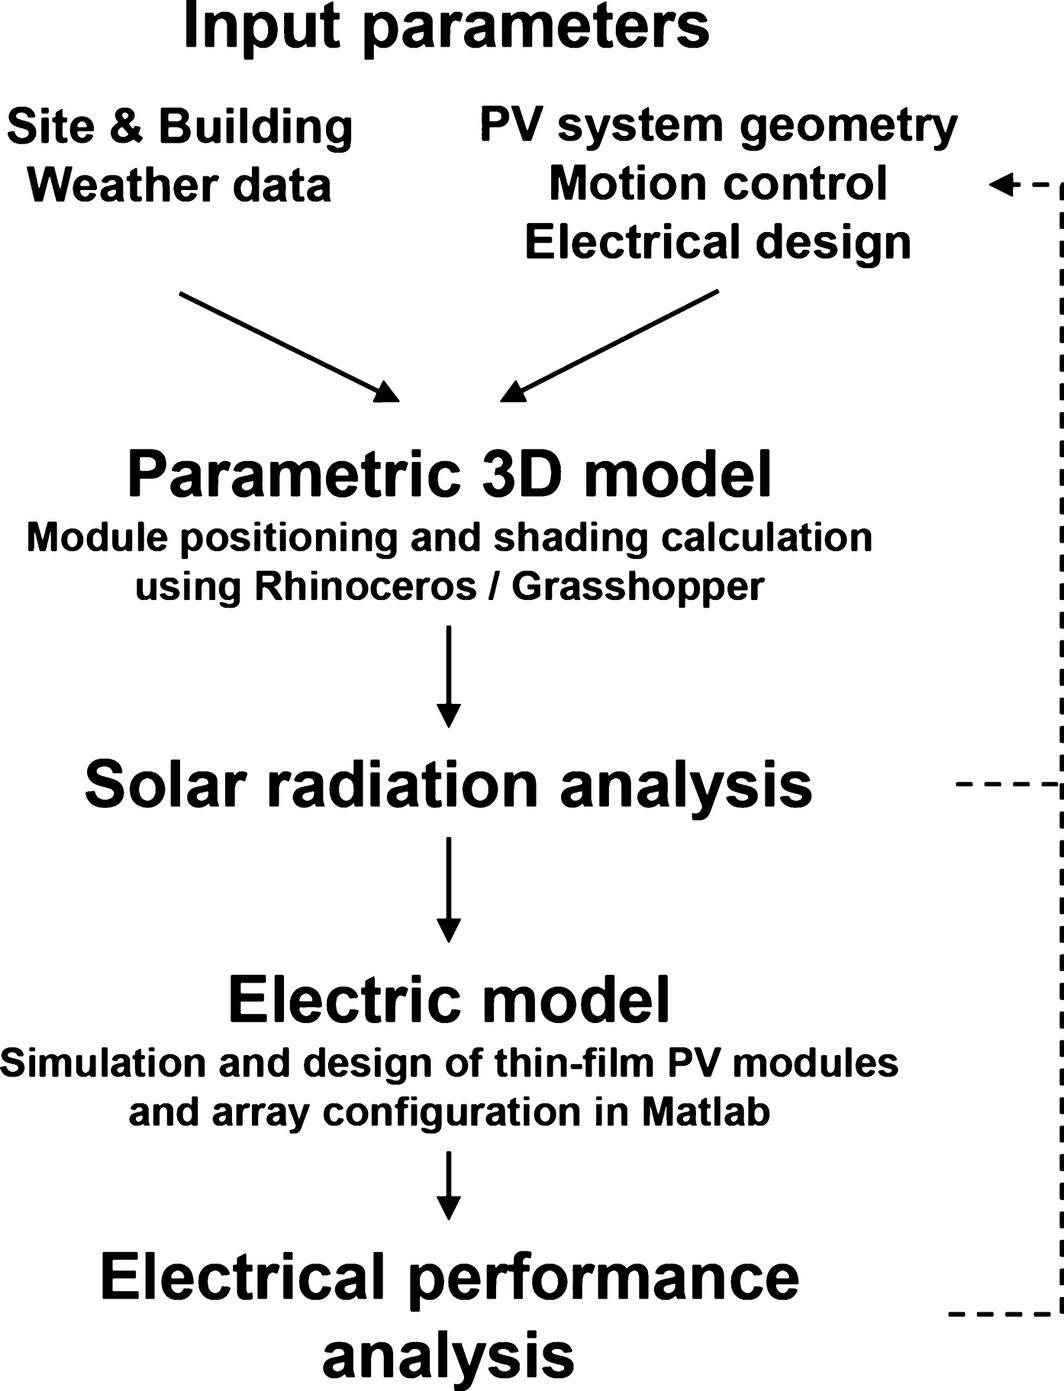
In order to study both the appearance and solar insolation on an array of dynamic PV modules attached to the building envelope, we have developed a framework for the parametric 3D design and calculation of module shading as well as solar irradiance at high resolution. The results are analyzed as a function of different input parameters, such as module arrangement and tracking control. For further analysis of the electrical performance, the shading pattern and solar irradiance are coupled with an electrical model which calculates the characteristic current–voltage (I-V) curves of PV modules as a function of time. On the basis of this, we evaluate electric energy yield for different module string interconnections and other electrical design parameters. The general workflow is illustrated in Figure 1.
|
|
|
Figure 1. Modeling framework for illustration of the workflow. The dashed line represents ways to optimize geometry, motion control, and electrical design parameters based on system performance. |
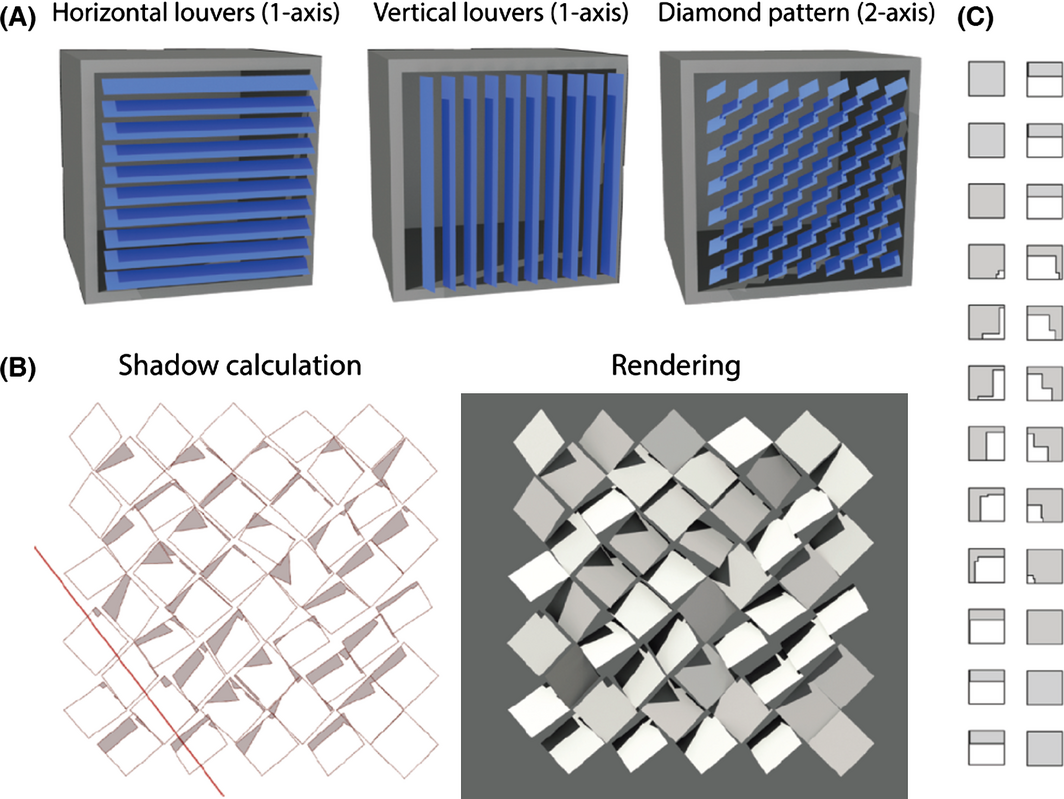
The developed modeling framework is versatile and principally any configuration in terms of module shape, arrangement, and motion control can be simulated. For practical relevance we focus in this study on a rectangular PV module design, three types of façade-attached shading system types (Fig. 2A), and one or two-axis solar tracking. Parameters varied include façade orientation, distance between modules, as well as electrical design parameters. The goal of the simulation is to analyze solar insolation for complex dynamic shading situations and to find the best electrical layout for a given shading system configuration and control strategy. Generally, the integration of dynamic 3D and electrical modeling allows to further optimize module shape, arrangement, and control, minimizing mutual shading and maximizing electric energy yield. In the following, the methods of the parametric 3D and electrical model are explained.
|
|
|
Figure 2. (A) Renderings of analyzed module configurations and mutual shading for a specific sun position. Depending on the system, the modules orient toward the sun using one or two-axis tracking. (B) Screenshot of the shading calculation performed in Rhino-Grasshopper for arbitrary module positions. The red line indicates the direction of the sun. For comparison a rendering of the 3D model is shown on the right. (C) Projection of shadows for a single module over the course of a day; gray represents the shaded area. |
Parametric 3D model
Module positioning
The workflow for the parametric 3D design of shading systems has been implemented in the Rhinoceros 3D software [31] using the Grasshopper plugin [32]. The resulting designs consists of multiple rectangular surfaces that represent PV modules, each of which can be rotated in the solar azimuth and/or the altitude direction, within a specified range of angles. The number of modules and their positions are controlled by indicating coordinates in 3D space at which the modules should be placed. This is done by specifying parameters that generate a rectangular or diamond pattern grid.
To exemplify, we generate and simulate different horizontal and vertical louver shading systems with single-axis solar tracking and a diamond configuration with dual-axis tracking in front of a room with a dimension of 3.6 m width and 2.8 m height (see Fig. 2A). The size of individual PV modules is fixed at 40 by 40 cm. In the reference case, the distance between louver blinds and modules in the diamond pattern is fixed at 10% of the module dimension, resulting in seven blinds with nine modules in series for the horizontal and vice versa for the vertical louver system. The diamond configuration is composed of 50 individual modules.
In our framework, one-axis tracking is simulated by rotating the modules in the direction of the sun along a horizontal or vertical axis. The center of rotation lies at an adjustable distance behind the module plane, so that actual mechanical rotation systems can be simulated. The orientation of the modules is defined by aligning the modules normal vector to the projection of the suns direction on the plane perpendicular to the module’s axis of rotation. For two-axis solar tracking, the modules orient exactly perpendicularly to the sun direction. Horizontal (azimuth) and vertical (altitude) tracking angles can be constrained to any angle range, so that tracking systems with physical limits on the range of rotation can be simulated.
Calculation of shading and solar irradiation
For each module, the calculation of solar irradiation is simulated at a resolution of 50 by 50 grid points, corresponding to an irradiance matrix with 2500 elements per module and instance. The dimension of these grid elements corresponds to the dimension of subcells used for the assessment of shading effects on the electrical PV module performance.
Solar irradiation is calculated separately for each module m and grid point p (Gtot,m,p) as a function of time t based on the three-component model [33, 34], for which the radiation on an inclined surface is calculated as the sum of direct beam (Gdir,m,p), diffuse sky (Gdif,m,p), and diffuse reflected radiation (Gref,m,p) as
|
|
(1) |
To assess these components, the module shading fraction or detailed shape (depending on the desired resolution) as well as the amount of radiation coming from the sky versus radiation from the ground needs to be known.
Within the parametric 3D model, the solar position is generated using the DIVA plugin [35], which provides vectors in the direction of the sun for any location on earth at any moment in time, based on the method described in [36]. The location for our analysis is Zurich, Switzerland (latitude 47.37°N, longitude 8.55°E). The sun direction vectors are used for shadow calculations and solar tracking. The shape of shadows on the modules is calculated based on vector algebra, using the sun light direction, panel geometry, and optionally external geometry as input. First, the modules normal vector is compared to the sun direction to check if sunlight could be received by the module. If so, the input geometry is intersected with the modules plane; the geometry that is located behind the modules plane logically does not generate shadows on the modules front side. The remaining geometry is then projected on the module plane using the method described in [37]. To verify this method, the resulting shadows have been compared with those generated by a physically based rendering engine [38], which is based on [39] (Figure 2B). By generating sequences of sun positions at fixed time intervals, the geometric behavior of a tracking system can be studied. For any moment in time, shading on the panels (including mutual shading) can be studied both numerically and graphically (Figure 2C). As the shadow shapes are generated as vector graphics, shading grids at any resolution can be quickly exported.
The sky view factor (or diffuse radiation factor) is approximated separately for each module by creating a hemispherical mesh, connecting the midpoints of the faces of this mesh to the midpoint of the module and checking these connections for intersections with panel geometry and external geometry. The area of the faces belonging to lines that are not intersected with any geometry are then added. Dividing the sum of this addition by the total surface area of the hemisphere results in the approximated view factor.
Direct radiation is calculated as the product of the shading vector (SVm,p), which is zero for shaded and one for not shaded areas, the projection of the module area on its normal plane relative to incident solar radiation (NPm,p), and direct normal irradiance (Gdni)
|
|
(2) |
Diffuse sky radiation is the product of the sky view factor (SFm,p) and diffuse irradiance on the horizontal plane (Gdif,hor)
|
|
(3) |
Diffuse reflected radiation is the product of the fraction of ground light irradiance reflected toward the module, the albedo of reflecting objects (a) and global irradiance on the horizontal plane (Gglo,hor)
|
|
(4) |
In Eq. (4) it is assumed, that the sum of the fraction of light reflected from the ground to the module and the sky view factor for this module equals one. Note that currently only a single albedo value is used, not distinguishing between different reflecting objects.
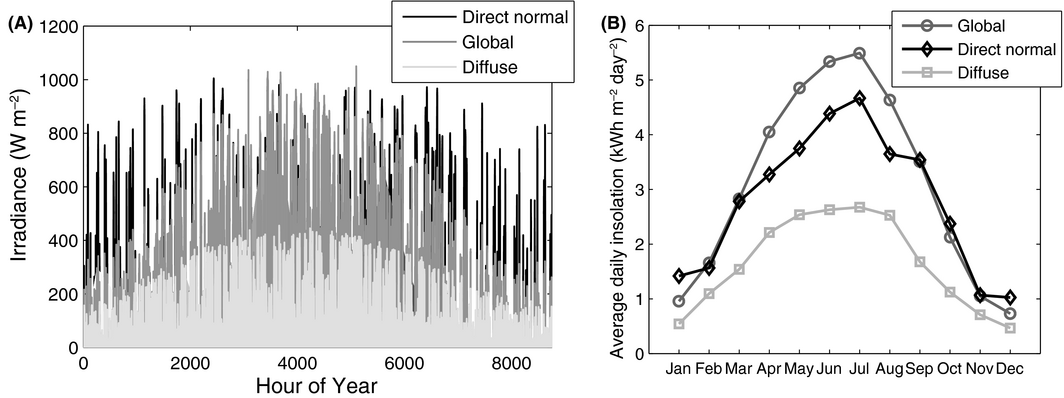
The irradiation data used in this work was exported from the Meteonorm software [40] and is based on long-term measurements of a MeteoSwiss weather station in Zurich, Switzerland (Zurich SMA, Fluntern). The total annual global insolation on a horizontal plane at this location is 1120 kWh/m2. For the analysis of solar insolation presented in Section 3, hourly solar irradiance is averaged per month and only one average day per month is simulated. PV electricity generation is strongly dependent on the specific shading and insolation condition. Therefore, the full hourly resolution was used as input data for the analysis of electric performance in Section 4. The weather data is shown in Figure 3.
|
|
|
Figure 3. (A) Direct normal, diffuse horizontal, and global horizontal irradiance over 1 year at the reference location with hourly resolution. (B) Average daily insolation per month. |
While the time resolution of shadow calculations is determined by the time step set in the sun positioning algorithm (which in the DIVA plugin can be set to any value), the time resolution of irradiation on the modules is determined by solar irradiance input (one hour for the used weather data).
Electrical model
One main reason for energy generation losses of BIPV systems is partial shading of PV modules due to surrounding buildings, trees, or other objects [16]. Another reason, particularly for PV integrated in dynamic shading systems, is mutual shading between PV modules. Varying insolation due to partial shading of PV modules leads to different I-V characteristics of PV cells and consequently to electrical mismatch within the module. Furthermore, modules exposed to different shading conditions lead to mismatch and power losses in the whole PV array [8, 41], which can cause hot-spot heating and damage of cell encapsulation materials affecting system reliability [8, 42, 43].
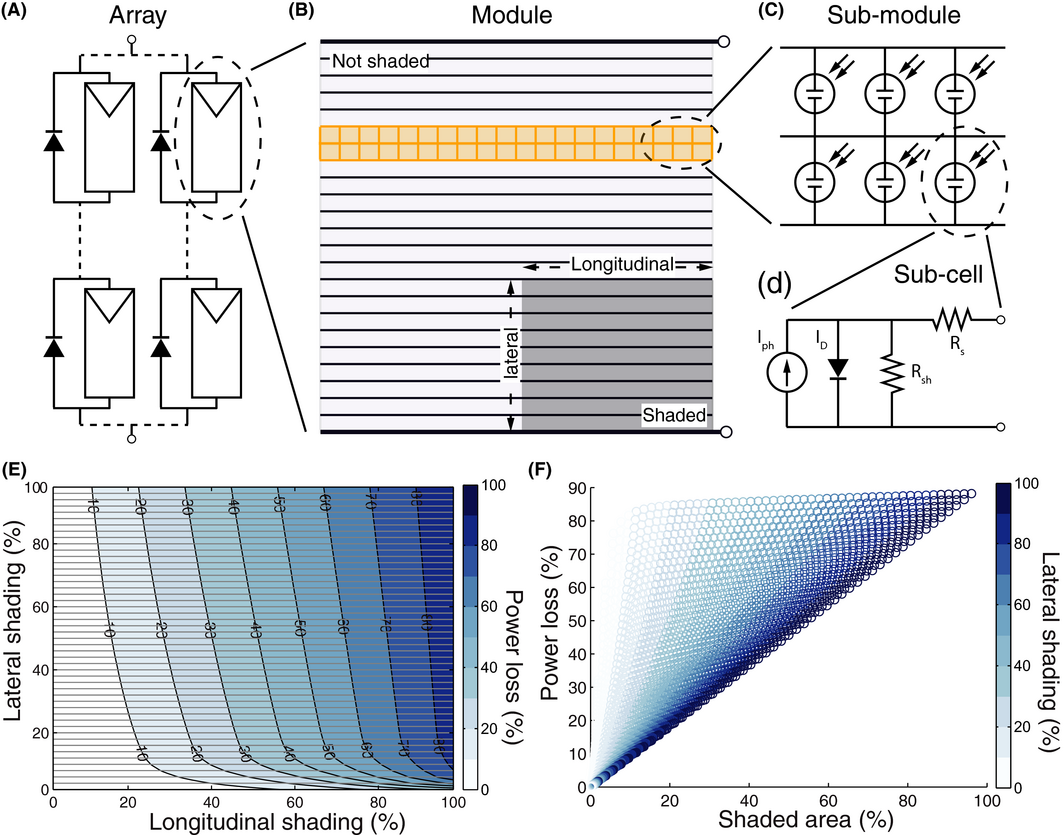
Modeling the effect of shading on PV systems power output has been extensively investigated in the literature [8, 17-28]. The impact of different cell shapes and orientations on the I-V characteristics of monolithic thin-film PV modules can be assessed with a two-dimensional SPICE circuit simulation [18, 41, 42]. We employ a similar model implemented in MATLAB. Figure 4A–D illustrate different levels of this model from array to module to subcell. In this two-dimensional simulation, each module consists of 50 cells in series and each cell is subdivided into 50 parallel connected subcells. The subcell I-V curve is modeled based on the standard equivalent circuit model with a single diode, one series and one shunt resistance [43]. For the parameters of the model we use values of a commercial CIGS (copper indium gallium selenide) module [44, 45] with an exponential increase in the shunt resistance at low irradiance [43, 45]. In case of partial shading, some of the cells are in reverse bias and act as a load. In order to account for this effect, the reverse characteristic of cells is modeled according to [46, 47], similar to the measured characteristic for CIGS solar cells [48]. The module I-V curve is calculated by summing the current of parallel connected subcells and subsequently the voltage of series connected cells. Since the module shading matrix and the network of subcells within a module have the same spatial resolution, both models can be directly coupled to simulate module electric performance for a specific shading pattern and solar irradiance. Figure 4E and F show the simulated module power loss at the MPP (maximum power point) as a function of shading parallel (longitudinal) and perpendicular (lateral) to cell elongation.
|
|
|
Figure 4. (A) Array of several PV modules with external bypass diodes in series-parallel connection. (B) Typical thin-film PV module with long rectangular cells connected in series. The module is partially shaded. (C) The module is modeled as a 2D grid of parallel-series connected subcells. (D) Each subcell is modeled based on the standard equivalent circuit. (E) Simulation of power loss as a function of lateral and longitudinal shading. In this case, the irradiance in the shaded region is reduced by ca. 80% relative to the full irradiance in the unshaded region. Horizontal lines indicate the orientation of PV cells. (F) Power loss as a function of shaded area. Color scale indicates the amount of lateral shading. Power loss is linear at 100% lateral shading, but deviates significantly at small lateral shading. |
Note that different from [18, 41, 42] contact sheet resistances between individual subcells have been neglected. Another limitation of this work includes the assumption of homogenous temperature distribution of PV cells in shaded and unshaded regions. Previous studies analyzed the feedback of power dissipation on module temperature distribution and showed that due to electrical mismatch from partial shading, temperature differences between cells in shaded and unshaded regions occur [9, 18]. Considering such electro-thermal effects is important for the prediction of hot-spots, potentially leading to PV module degradation and permanent damage [9]. Infrared thermal imaging of partially shaded PV modules analyzed in this study has shown, that module temperature distribution is dominated by direct light absorption. The model we developed offers subcell temperature resolution, however, further analysis and experimental validation will be required to accurately account for module temperature distribution based on both effects, direct light absorption and electrical dissipation due to cell mismatch. With the current model setup we observe good agreement between measured and simulated data and consider both simplifications to be of minor influence on the general conclusions of this study.
The array I-V curve is simulated by summing the voltage of modules connected in series strings and then the current of strings connected in parallel. Usually modules have integrated bypass diodes that conduct in case of reverse bias due to shading and limit the voltage drop over a module to the voltage at which the diode starts to conduct (ca. 0.6 V for silicon diodes). In this work, we consider three cases for the placement of bypass diodes, which are detailed in Section 4. Note that due to manufacturing tolerances, varying degradation or dirt, PV modules exhibit slightly different current–voltage characteristics. Mismatch losses induced by such phenomena are neglected in the analysis.
Solar Insolation Analysis
Sun-tracking ability, module shading, and consequently solar insolation on PV modules varies significantly as a function of system configuration parameters, such as motional degree of freedom (one/two-axis tracking), façade orientation, and module spacing. In this section, we first analyze solar tracking performance and mutual shading for different shading system configurations using one and two-axis solar tracking and then present results of the average daily and monthly distribution of solar insolation for various façade orientations and module distances.
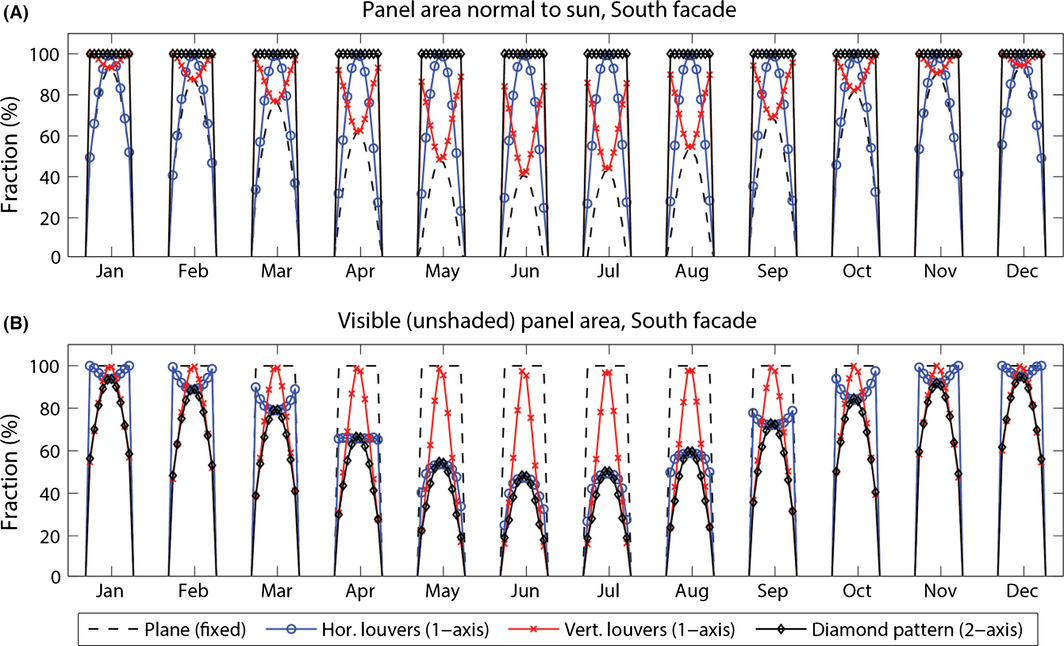
Figure 5A depicts the projection of module area on its normal plane relative to incident solar radiation over the course of a day for each month of the year and Figure 5B the corresponding visible (not shaded) module area. These two variables are important as they are proportional to direct irradiation on the module surface (see Eq. (2)). The values are averaged over all modules of a south facing façade. The simulation is done for one and two-axis tracking systems with 10% module spacing. For comparison also a planar system without tracking ability is shown. As expected, for a fixed plane the area normal to sun radiation exhibits strong seasonal and daily variations. It approaches zero in the morning and evening and is lower in summer than in winter. Due to solar altitude tracking, horizontal louvers have an improved daily performance and balance out seasonal fluctuations. Vertical louvers with azimuth tracking orient toward the sun in the morning and evening, but have a minimum at solar noon as they cannot track solar altitude. The two-axis tracking system completely cancels out seasonal and daily fluctuations. The improvements of tracking systems orienting the module toward the sun are countered by increased mutual shading (Fig. 5B). While for a static planar system there is no mutual shading at all, the effects of shading increase using single-axis tracking and even further with dual-axis tracking. For all systems we observe a trade-off between module mutual shading and solar tracking performance in terms of projected normal area, in particular for narrow spaced module arrangements.
|
|
|
Figure 5. (A) Fraction of the module area oriented normally to the sun over the course of a day for four different solar tracking systems on a south facing façade. (B) Visible, not shaded module area. |
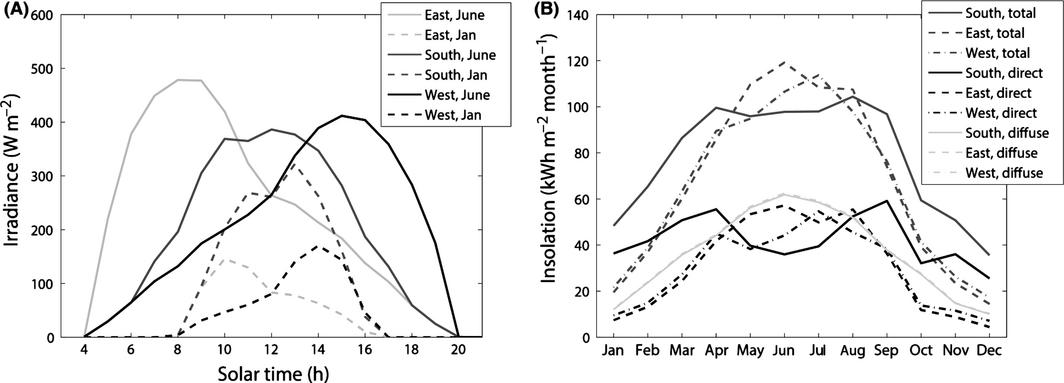
The results of module tracking performance and mutual shading serve as inputs to the calculation of daily and monthly solar insolation shown for a horizontal louver system using solar altitude tracking in Figure 6. The irradiance has a different daily profile depending on façade orientation and season. East, west, or south oriented facades receive most sunlight in the morning, evening or at noon, respectively. As such, daily variations in solar insolation can be partly balanced by using PV modules for different façade orientations. Interestingly for this tracking system on a south facing façade, direct insolation in winter is relatively high but drops during summer months due to mutual shading. This leads to relatively low seasonal variation in solar insolation. The effect is less influential for east or west oriented facades, which exhibit less mutual shading in summer and have strong seasonal variations.
|
|
|
Figure 6. (A) Average daily solar irradiance per module area for a horizontal louver solar tracking system in June and January at the location of Zurich. (B) Average monthly insolation per module area by façade orientation. |
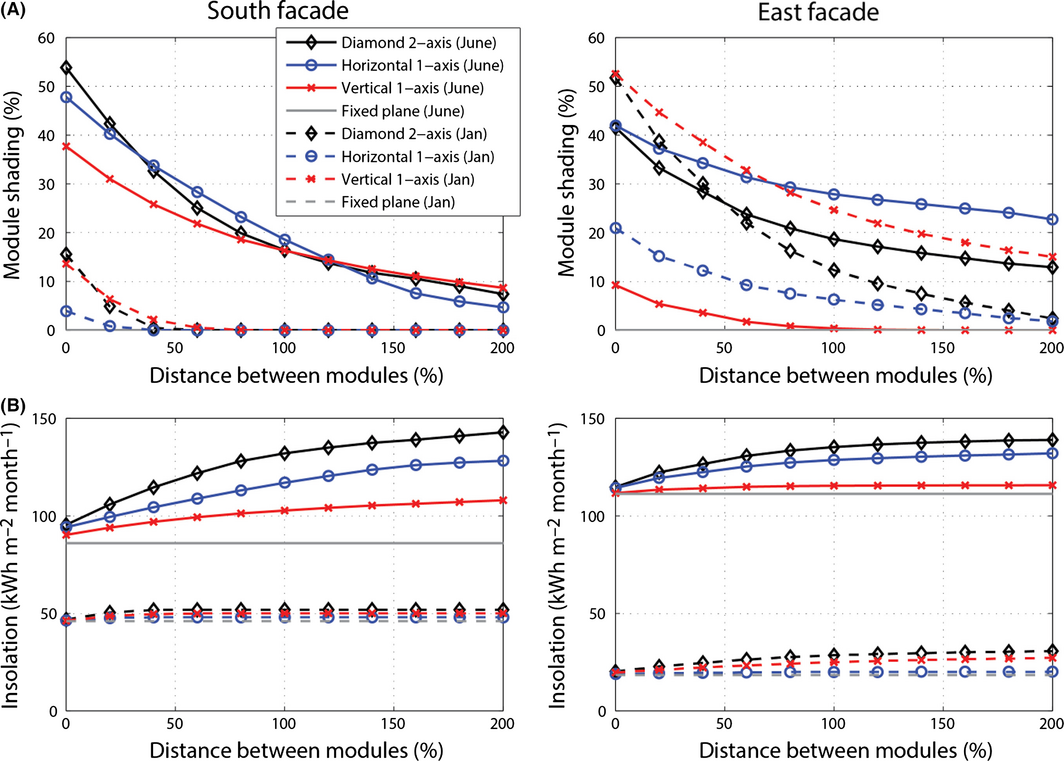
Mutual shading and solar insolation have been evaluated for different façade orientations as a function of the distance between modules, that is, the distance between rows or columns of single-axis or individual modules of dual-axis tracking systems in percent of the module dimension. Figure 7A shows the decrease in mutual shading with increasing module distance for a south and east facing façade. Module shading fraction is calculated as the average amount of mutual shading of all modules within the façade assembly at times, when there is direct light irradiation on the respective façade. For a south facing façade, the mutual shading fraction is high for all systems in summer and low in winter. This trend can be also compared to the results shown Figure 5B. The variation with module distance is smallest for the vertical and horizontal louver system in summer and winter, respectively. For the east oriented façade, shading is high in winter, particularly for the vertical louver and diamond configuration tracking system. This is because an east facing façade receives direct light in winter only for a short amount of time, during which these two systems generate high mutual shading. The horizontal louver tracking system is highly shaded in summer and less in winter. The dependence is opposite for the vertical louver system.
|
|
|
Figure 7. (A) Average module mutual shading and (B) insolation per module area as a function of the distance between modules for south (left) and east (right) oriented façade shading systems in June and January. |
The amount of shading and its reduction with increasing module distance lead to a variation in insolation per module area as shown in Figure 7B. At small module distance, the absolute amount of insolation is similar for all systems, but at a higher level for the east façade in summer and for the south façade in winter, respectively. In turn, the variation in insolation is higher for the south façade in summer and for the east façade in winter. Overall the increase in insolation with module distance is highest for the two-axis tracking system.
Further analysis not shown in Figure 7 reveals, that even though the insolation per module area increases with increasing module distance, the absolute amount of insolation on all modules of the façade decreases. This is because absolute module area decreases more rapidly than relative insolation increases. Note that an increase in the module spacing corresponds to less reduction in module area for the one-axis than for the two-axis tracking system, due to a variation in the module distance in only one instead of two dimensions. For conventional ground-mounted PV tracking systems [49-51], the ratio of module relative to ground area is known as the ground cover ratio and the trade-off between land occupation and energy yield is discussed in [10, 52]. Comparing the performance of the different tracking systems analyzed in this work relative to the ground cover ratio instead of the module distance, shows that the horizontal louver one-axis and diamond two-axis tracking systems achieve the highest insolation per façade area in summer. In winter, the best performance is reached by vertical louver and two-axis tracking systems. On an annual basis, the two axis-tracking system reaches highest insolation per façade area.
Electrical Performance Analysis
Knowledge of the irradiance per module can be used to design electrical configurations that reduce power losses. Due to mutual shading, the irradiance per module can vary significantly depending on the shading system type and the location of the module within the façade assembly. In this section, we first evaluate the shading patterns by configuration for a south oriented facade shading system. On the basis of this, we analyze suitable electrical designs and present simulation results of power production.
Shading analysis and system design
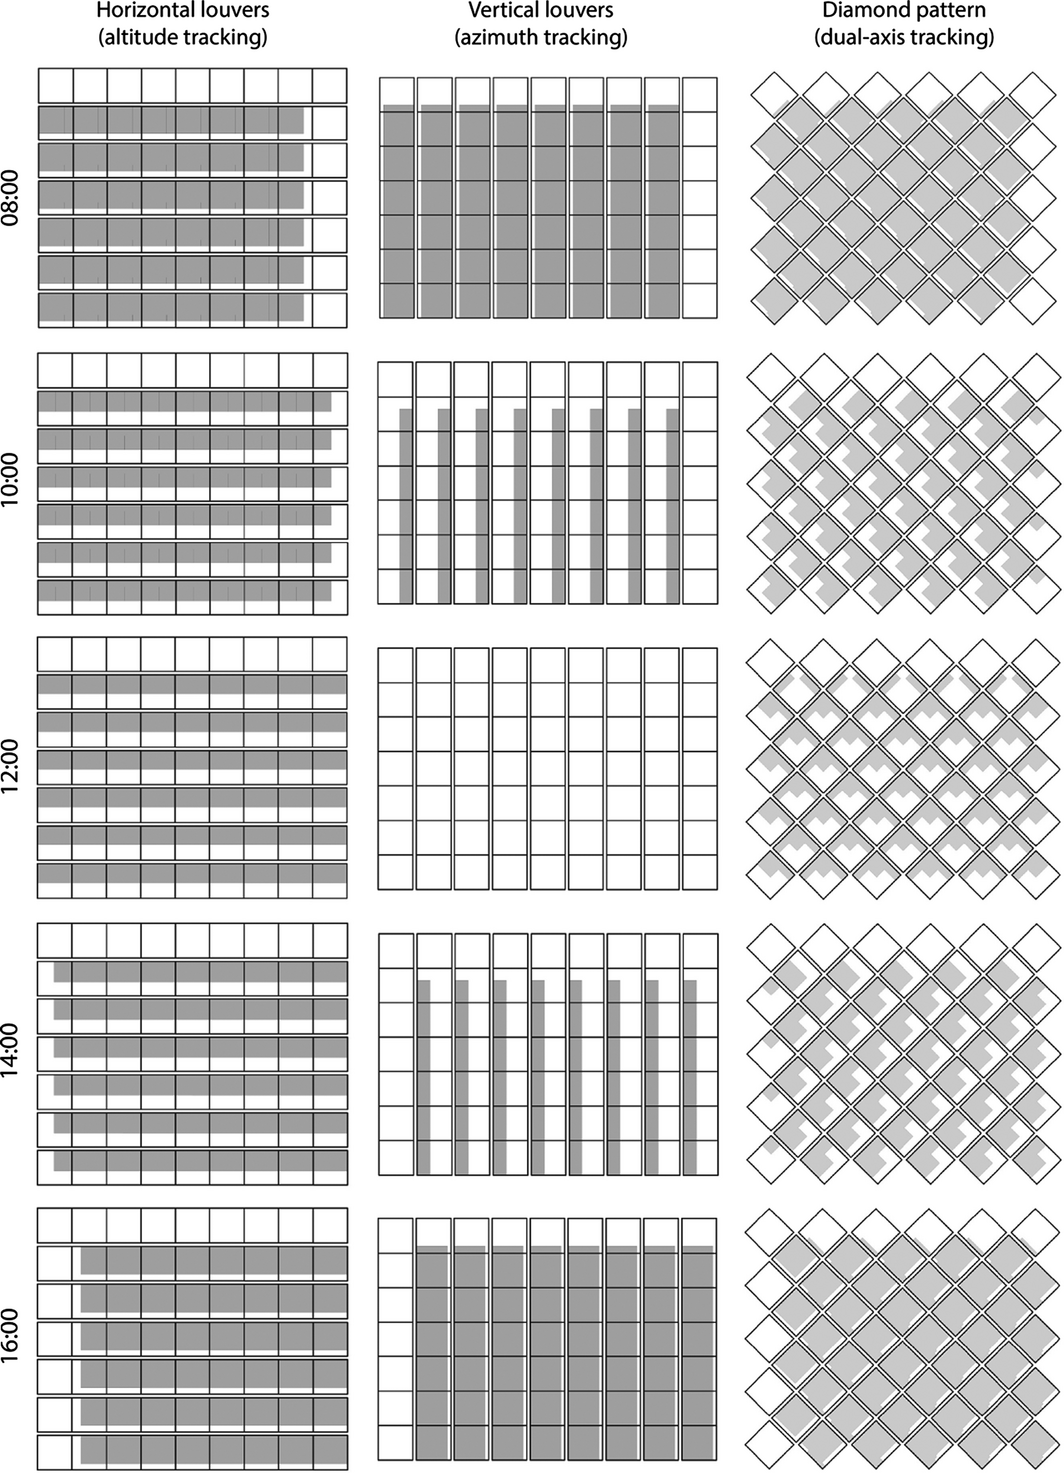
In shaded conditions the photocurrent produced by a PV module decreases significantly. Because series connected PV modules are forced to operate at the same current, shading of a single module within a string of modules connected in series limits the current of other not shaded modules. On the hand, parallel-connected modules are forced to operate at the same voltage. Since the voltage decrease during partial shading is comparably low, parallel connection of modules leads to lower mismatch and power losses in partially shaded conditions than series connection [8, 16, 19]. There is, however, a limit to the degree of parallelism, because currents in parallel-connected modules, and hence resistive (ohmic) losses, are higher. In addition, wiring is more complex for parallel connected modules and usually for the inverter a certain minimum input voltage is required. For this reason, modules are often connected in series-parallel arrays by first forming series connection of modules in strings and then connecting those strings in parallel. In order for these strings to work most efficiently, the current at the maximum power point should be similar for PV modules connected in a string. For the analyzed PV shading systems, we therefore connect modules with similar shading pattern and solar irradiance over the course of a day in series strings. In particular, we try to avoid the situation that only one or few modules within a string are shaded, while others are fully illuminated. Figure 8 depicts calculated mutual shading among modules of a south oriented façade for the three shading systems analyzed.
|
|
|
Figure 8. Projected mutual shading patterns over one clear day in June for a south oriented façade. |
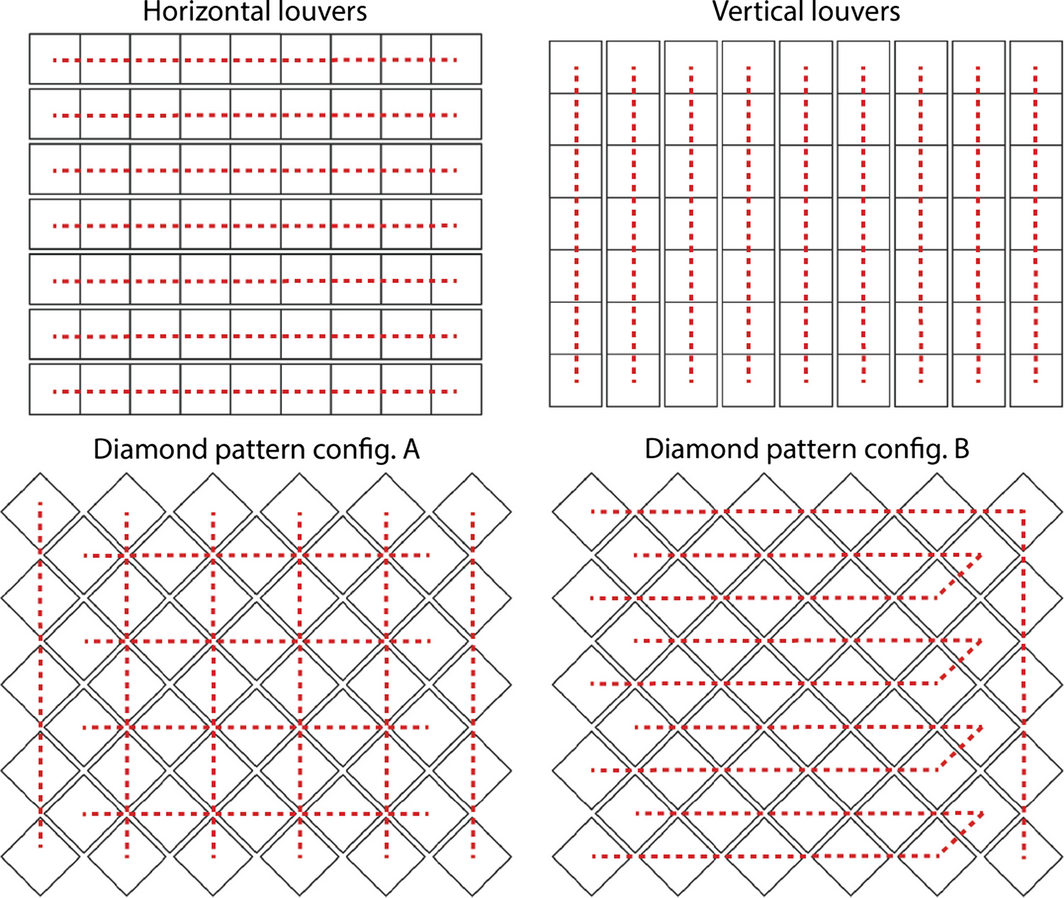
The figure shows the 2D projection of mutual shading for five instances from morning to afternoon of a clear day in June. For horizontal and vertical louver systems, shadows follow the direction of the axis of rotation. Therefore, it is straightforward to connect modules within louver blinds in series, which also facilitates wiring. For the diamond configuration, the shading pattern is more complex. Generally, modules located in the top and subsequent row, the left and right column, as well as all central modules receive similar irradiance. For the analyzed arrangement of 50 modules, it is, however, impossible to find string connections of more than two modules exactly matching this shading pattern. For this reason, we constrain the analysis to two cases of either five or ten modules in series as shown in Figure 9. Note that configuration B is unsymmetrical and favors the shading situation in the morning. The string connections shown in Figure 9 will be analyzed further in the next section.
|
|
|
Figure 9. Possible string connection of modules based on shading analysis. |
Electrical performance of different configurations
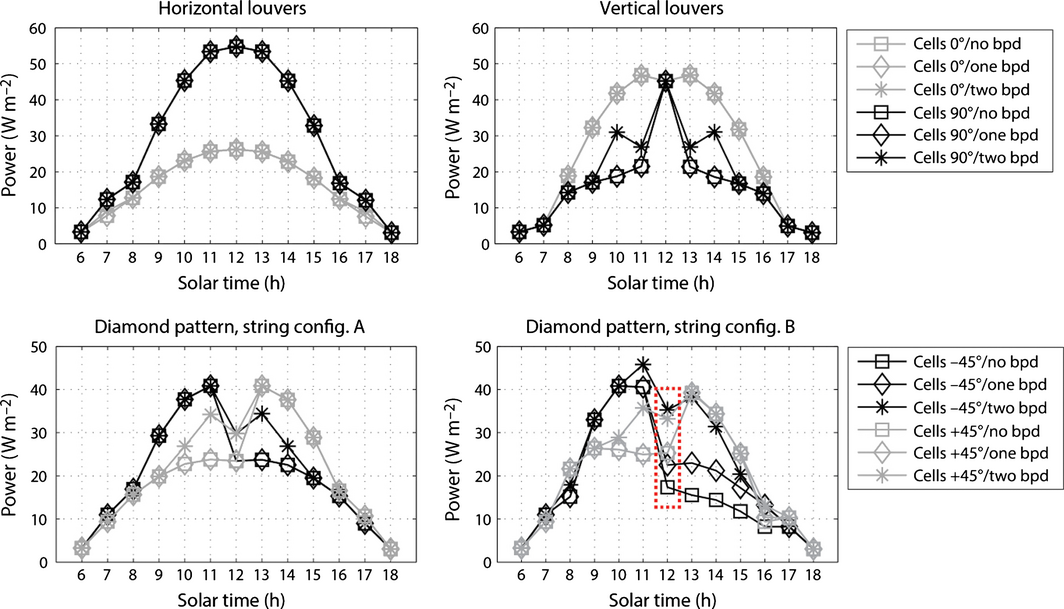
In this section, we analyze the electrical performance in terms of array I-V characteristic and maximum power as a function of relevant electrical design parameters. In addition to possible string connections shown in Figure 9, these parameters include PV cell orientation and the placement of bypass diodes. For each string configuration, we model three cases for the placement of bypass diodes: (1) none; (2) one bypass diode in parallel to the entire 50 cells of a module; (3) two submodules of 25 cells in series, each with one bypass diode in parallel. Furthermore, we study the effect of a rotation of cell orientation by 90°.
Figure 10 shows the resulting maximum array power per module area for one clear day in June. For the horizontal louver system, vertical cell orientation (indicated as 90°) leads to significantly higher electricity generation than horizontal cell orientation. This can be explained by shading of the upper part of most modules (Fig. 8) and the stronger decrease in module MPP for lateral than longitudinal shading (Fig. 4E and F). In contrast, electricity generation of the vertical louver system, is higher for horizontal cell orientation. This can be explained by the inverted shading pattern. At solar noon, cell orientation is irrelevant for the vertical louver system, because modules are not shaded (Fig. 8). For the diamond pattern system in both string configurations, −45° cell orientation leads to higher electricity generation in the morning and +45° in the afternoon. Our analysis shows, that power losses caused by differing morning and evening shading conditions, can be reduced by integration of two bypass diodes per module. While string configuration A leads to a symmetrical electricity generation profile for different cell orientations, it is asymmetric for configuration B due to the nonuniform string design (Fig. 9).
|
|
|
Figure 10. Maximum power per module area during a clear day in June. For each configuration, two different cell orientations and three options for the placement of bypass diodes (bpd) are simulated. The highlighted area is analyzed further in Figure 11. |
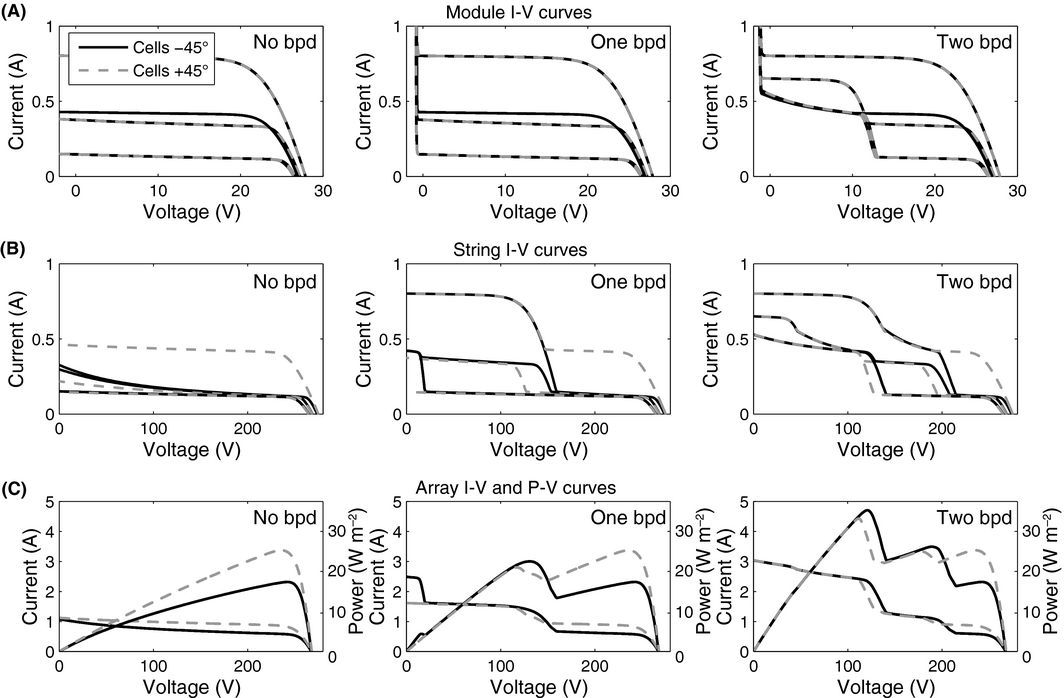
The results shown in Figure 10 are on a highly aggregate level. For many applications it is of interest to know the exact I-V characteristic of modules, strings, and array, e.g. for the design of optimal electrical interconnections [14-16] and MPPT (maximum power point tracking) methods [30, 53-55]. Figure 11A shows the I-V curves of all 50 modules for one specific instance in Figure 10 (diamond configuration, string layout B, at 12o'clock). With one integrated bypass diode, reverse bias losses are limited, because the diode conducts below certain a threshold voltage. With two bypass diodes, module I-V curves exhibit a stepwise profile for some shading conditions. The integration of module bypass diodes leads to multiple steps for the I-V curves of strings (Fig. 11B) and arrays (Fig. 11C), as well as multiple peaks in the P-V (power-voltage) characteristic of arrays.
|
|
|
Figure 11. (A) I-V curves of individual modules for one specific instance shown in Figure 10 (diamond configuration, string layout B, at 12 o'clock). The diagram shows the I-V curves of all 50 modules (mostly overlapping) for either −45° or +45° cell orientation. From left to right, the number of bypass diodes per module increases from zero to two. (B) I-V curves of different strings with 10 modules in series. (C) Resulting array I-V (left) and P-V curves (right axis). |
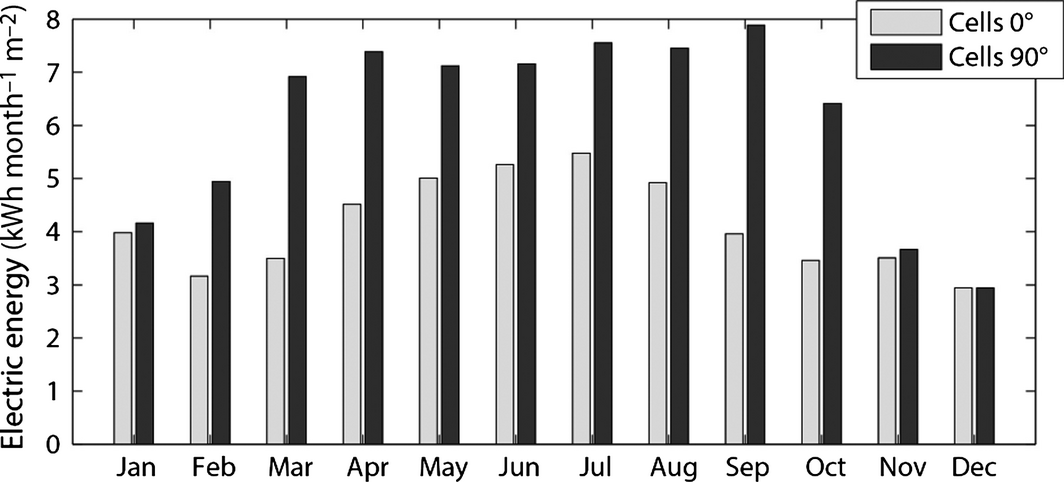
Varying shading conditions and solar irradiation influence the relative performance of the configurations analyzed in this section. In an analysis of monthly electricity generation of those different configurations, we find that the order from lowest to highest electric yield remains the same as the comparison for a single clear day in Figure 10 suggests. However, the absolute difference varies significantly throughout the year. As an example, Figure 12 shows monthly electricity production of the horizontal louver tracking system for horizontal and vertical PV cell orientation. Results are based on hourly weather data and shading simulations. The difference in electric energy yield between horizontal and vertical PV cell orientation is low from November to January and high from March to October. The main reason for this trend is a decrease in module shading during winter (Fig. 7A).
|
|
|
Figure 12. Monthly electricity generation of horizontal louver system for horizontal and vertical PV cell orientations with one integrated bypass diode per module. |
System comparison
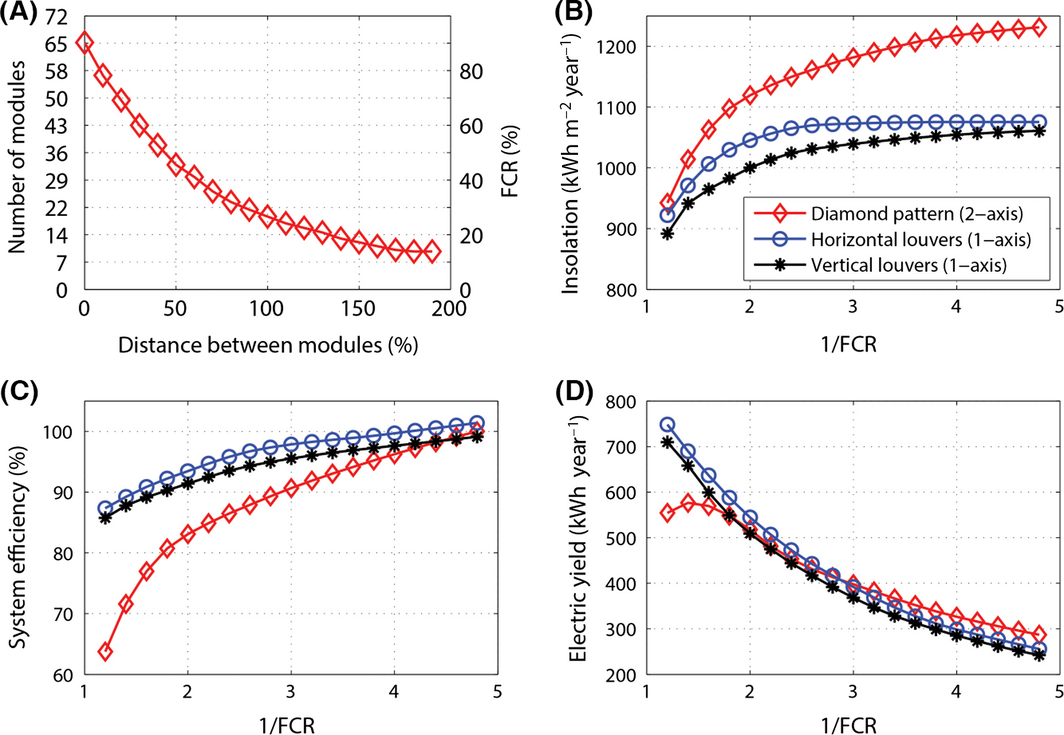
In this section, we compare the performance of the three PV shading system configurations analyzed (cf. Fig. 2A) with regard to solar insolation, system efficiency, and electric energy yield. As can be seen from Figure 7, raising the distance between PV modules reduces mutual shading and increases solar irradiance on the module. In addition, reducing the amount of shading leads to less mismatch between cells and improves the electrical conversion efficiency. On the other hand, increasing the distance between modules reduces the FCR (façade cover ratio). The FCR is a measure of the density of PV modules on the façade and defined as the PV module area relative to the total area of the façade. Based on the FCR, the performance of different system configurations can be compared at the same module density. Figure 13A shows the relation between number of modules, FCR and distance between modules for the diamond pattern configuration. In the analysis, the FCR is reduced from ca. 90% to 15% by varying the spacing between individual modules of the diamond pattern or rows and columns of the louver systems, but keeping the total façade area constant. Figure 13B–D illustrate corresponding performance characteristics for a south oriented façade as a function of the inverse FCR for the three different shading system configurations analyzed. Note that each module is fully laminated with thin-film CIGS cells (used in the most efficient orientation) and equipped with one external bypass diode.
|
|
|
Figure 13. (A) Number of modules in the diamond pattern configuration and façade cover ratio as a function the distance between modules. (B) Annual solar insolation per module area as a function of the inverse façade cover ratio for three different system configurations. (C) Corresponding normalized electrical efficiency and (D) total electric yield of the façade shading systems. |
Figure 13B shows solar insolation per module area as a function of 1/FCR. Due to mutual shading it decreases with increasing module density. Only at large module spacing, the full potential of the solar tracking system can be exploited, in particular for the two-axis system. Figure 13C shows the corresponding average efficiency for conversion of solar radiation to electric energy. It is normalized to the maximum efficiency of the diamond pattern system. With increased mutual shading at narrow module distance, electrical efficiency decreases. This is in particular the case for the diamond pattern system, due to inefficient alignment of the module shading pattern relative to cell orientation. At wide distance between modules, the efficiency of all systems is similar. Total electric yield of the façade system is the product of specific solar insolation, PV module area, and electrical efficiency. It is depicted for constant façade area in Figure 13D. Electric yield continuously decreases with increasing module distance for the horizontal and vertical louver systems. In the diamond pattern configuration, it exhibits a maximum at ca. 70% FCR or 30% distance between modules. Up to this value, the increase in electrical efficiency and specific solar insolation offsets the reduction in active module area. Overall, the highest electric yield is achieved with the horizontal louver system up to a FCR of ca. 35% and with the diamond pattern system at lower FCR.
Note that the results shown in this section only apply to a south facing façade at the location of Zurich and modules covered fully by PV. Efficiency loss at narrow module distance can be reduced by PV module design with improved shading tolerance [41], the integration of multiple bypass diodes per module, or placement of PV cells in module areas with little shading. The efficiency degradation in the diamond configuration relative to the louver systems at narrow module distance is also less critical for east and west relative to south oriented facades.
Experimental Implementations
Measurement of I-V characteristics in partially shaded conditions
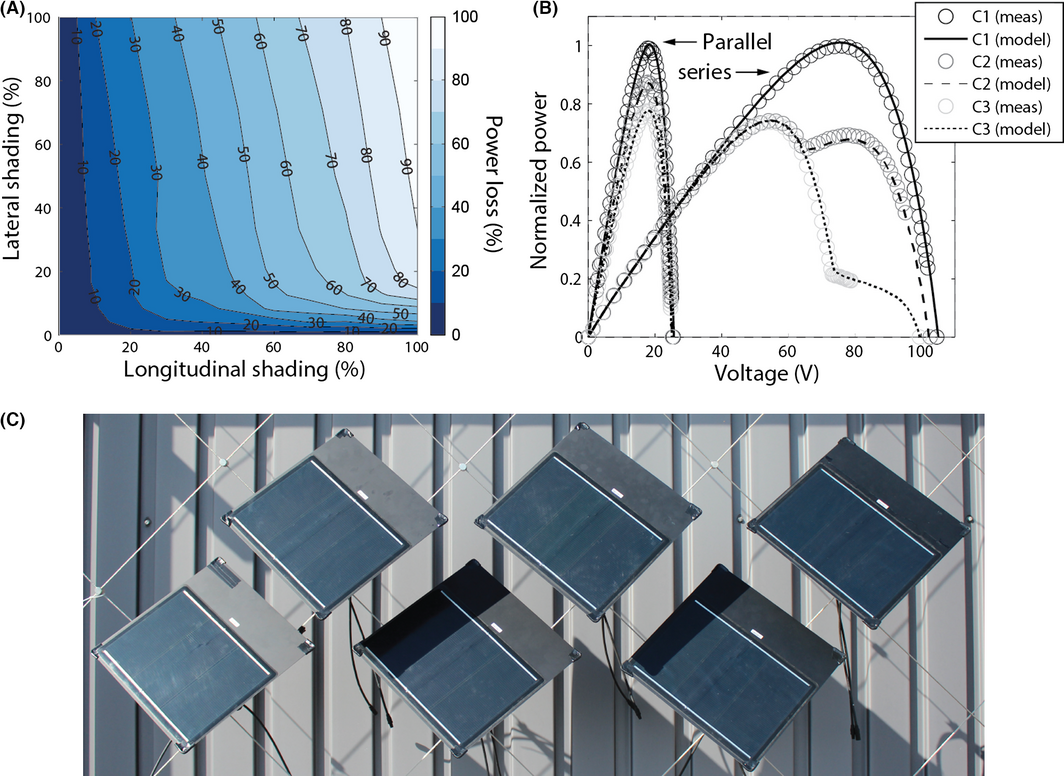
To validate the electrical model, outdoor measurements have been performed using six CIGS module prototypes produced by Flisom AG (www.flisom.ch). Each module has a size of 40 by 40 cm with one external bypass diode integrated in the junction box. Currently only approximately two-third of the module area is covered by PV cells and each module consists of three submodules connected in parallel (Fig. 14C). The next generation of modules is planned to be entirely laminated with PV cells that span the full width of the module.
|
|
|
Figure 14. (A) Measured power loss of a single module as a function of longitudinal and lateral shading. (B) Normalized measured and modeled P-V curves of four modules in parallel and series connection for different shading conditions: C1 – no module shaded, C2 – one module shaded 100% in lateral and 50% in longitudinal direction, C3 – one module shaded 50% in lateral and 100% in longitudinal direction. (C) Thin-film copper indium gallium selenide module prototypes installed in diamond pattern on cable-net structure. The spacing between modules is increasing from left to right, leading to asymmetric mutual shading. Each module consists of three submodules connected with a bus bar in parallel. |
I-V curves have been measured for different shading conditions with a PVPM2540C measurement device from PV Engineering. I-V curves were obtained in controlled shading experiments for single modules at clear sky. In these experiments, a module was mounted horizontally on the ground and an appropriate shading object moved in approximately 30 cm distance from the module to incrementally adjust the lateral and longitudinal shading fraction with a step size of 5–10%, depending on the influence on output power. The irradiance in the shaded and unshaded region was measured using an external reference cell and a pyranometer. For each shading condition, the MPP was inferred from the P-V characteristic curve. The measured power loss relative to the unshaded condition is shown Figure 14A. In order to compare these measurements to simulation results, we applied nonlinear least squares fitting of the model to the measured, unshaded module I-V curve to extract parameters relevant for the employed equivalent circuit [43]. Based on this and the assumed cell reverse characteristic, the subcell I-V curve in the shaded and unshaded region is modeled and the module I-V curve reconstructed. Note that it is not possible to directly relate the measurement results of Figure 14A to the simulation results shown in Figure 4E, because the underlying module characteristics are different. For comparison of measurement and simulation, the specific design of the measured module prototype as a parallel connection of three submodules has been considered in the model. The deviation of measured and simulated MPP is below 5% for most shading conditions and largest for regions with strong variation in the MPP, that is, at low lateral and high longitudinal shading. The percentage root mean square deviation between measured and simulated values is 4.8% and the mean absolute deviation 4.6%. This deviation may be caused by the inaccuracy in positioning the shading object and potential unknown mismatch between submodules.
In addition to single module measurements, I-V curves of arrays under different partial shading conditions and module interconnections were obtained. To compare measurements and model, the array I-V curve was reconstructed based on a fit of each unshaded module I-V curve, the specific shading pattern, and the interconnection of modules. As an example, Figure 14B shows measured and simulated normalized P-V curves of four modules in series and parallel for three different shading conditions. As expected, power loss in shaded conditions is lower for parallel-connected than series connected modules, however, currents and resistive losses are higher. For both module interconnections, the power loss with one module shaded 50% in lateral and 100% in longitudinal direction is higher than in the opposite case of 100% lateral and 50% longitudinal shading. For series connected modules, this has no influence on the MPP though. Multiple extrema of the P-V curve are caused by bypass diodes, which limit the power loss of partially shaded strings.
Figure 14C shows CIGS module prototypes mounted in diamond pattern configuration on a cable-net structure. Each module is equipped with a novel soft robotic actuator, which allows the module to rotate along two axes based on pneumatic inflation [56]. This can be used for solar tracking and daylight control. Measurements of the PV modules in this configuration are currently performed.
Building integration
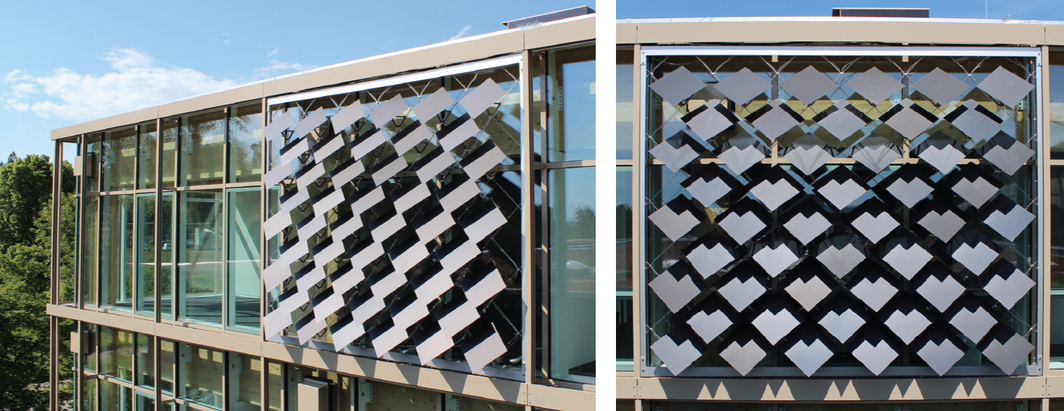
The framework presented in this study is currently being applied in a living lab experiment at the ETH House of Natural Resources (HoNR, www.honr.ethz.ch), in which an ASF (Adaptive Solar Façade) is designed, constructed, and operated [2, 4]. The design of the ASF is close to the diamond pattern façade discussed in this study. The HoNR has been inaugurated in June 2015 and the ASF installation is shown in Figure 15. The ASF consists of 50 modules on a modular frame placed in front of a south facing, two-person office, in order to evaluate its thermal and electric performance in an office environment. For reference, the adjacent office with a conventional shading system is monitored. Continuous monitoring will allow us to study the interconnection between power generation, solar intake, user preferences, and heating and ventilation systems energy demand.
|
|
|
Figure 15. Adaptive Solar Façade installed at ETH House of Natural Resources. The right picture shows the shadow pattern on the modules for highest sun position, which can be compared to the calculated shadow pattern in Figure 8. |
Discussion and Conclusions
In this work we presented a parametric modeling framework of solar insolation and electric energy yield for building integrated dynamic PV systems. The methodology is applied to evaluate the performance of different façade-mounted PV shading system configurations with one and two-axis solar tracking. We furthermore study the influence of façade orientation and module distance.
The analysis shows, that there is a trade-off between tracking performance, in terms of the amount of incident solar radiation perpendicular to module surface, and mutual shading between modules, in particular for closely positioned modules. The orientation of the tracking axis strongly influences timing and spatial distribution of shading patterns on the modules, which has immediate consequences on the optimal electrical configuration. The distance between modules is a critical parameter influencing the amount of mutual shading and hence limiting solar irradiation on shading modules using solar tracking. For a certain module spacing, highest solar insolation per module area is reached for two-axis tracking, followed by one-axis tracking, and finally fixed systems. The difference between the systems is negligible at very small distances, but increases for larger module distances. The relative performance between horizontal and vertical louver façade tracking systems depends on the season, façade orientation, and geographical location.
With regard to PV electricity generation, mutual shading between PV modules reduces the conversion efficiency from incident solar radiation to electrical energy. At narrow module spacing, the highest electric yield on a south facing façade is reached by horizontal louver systems. Only at wider module spacing with less shading, the full potential of the two-axis tracking system can be exploited. The methodology we have developed offers high spatial resolution, which helps to minimize electrical mismatch losses in case of strongly shaded conditions. We show that careful planning of module string configuration, PV cell orientation, and location of bypass diodes reduces electrical mismatch losses induced by partial shading and can result in more than 50% higher energy yield compared to uninformed design strategies. Knowledge of the precise shading pattern and electrical performance is furthermore useful to evaluate potential benefits of power electronic converters using advanced MPPT [30, 53-55] and for the development of thin-film PV cell geometries with improved shading tolerance [41].
The analysis presented in this study focuses on solar insolation and electric energy yield of different BIPV shading system configurations. However, these systems will be used as adaptive shading elements in exchange with users and the building climate and energy system. Analysis taking into account building lighting, heating, and cooling energy demand in addition to PV electricity production will be performed for a complete assessment of the different systems. In this regard, it is possible to couple dynamic shading system simulations in Rhinoceros/Grasshopper to building energy modeling in EnergyPlus [57]. Previous work of dynamic shading systems has shown that specific module control sequences minimize building energy demand for heating, cooling, and lighting [2]. While solar tracking achieves good glare protection and high insolation on PV modules, it does not take into account energy required for heating, cooling, and lighting. In future work, solutions balancing PV electricity production and building energy demand will be investigated.
Single and dual-axis tracking systems have the potential to significantly enhance power generation of PV modules [49-51]. While solar tracking is adequate to determine the potential of systems with large module distances, there may be other control strategies that are more suitable for panel configurations with smaller module distances and high mutual shading. The methodology presented in this study will help us to develop such advanced control methods minimizing power losses. One control strategy used for tracking PV plants is the so-called back-tracking method, for which shading is completely avoided and losses due to small angle of incidence are minimized. Solutions of back-tracking for one and two-axis tracking systems exist [10, 11], however, the parametric 3D modeling framework developed in this work may help to find solutions for complex system geometries. In addition to back-tracking, strategies with motion control of individual modules (or module clusters) and their impact on electricity generation can be evaluated. Further integration of 3D parametric, PV electric, and building system simulation will enhance integrated design and open new optimization possibilities.
The work presented in this study is currently applied in the context of the ASF project. The developed methodology is used to investigate the performance of different geometrical arrangements, advanced module control, and PV system electrical design.
Acknowledgments
This research has been financially supported by CTI within the SCCER FEEB&D (CTI.2014.0119) and by the Building Technologies Accelerator program of Climate-KIC. We gratefully acknowledge Flisom AG for provision of high-efficiency CIGS PV modules.
Conflict of Interest
None declared.
References
- Perez, M. J., V. Fthenakis, H. C. Kim, and A. O. Pereira. 2012. Façade–integrated photovoltaics: a life cycle and performance assessment case study. Prog. Photovoltaics Res. Appl.20:975–990.
- Jayathissa, P., Z. Nagy, N. Offedu, and A. Schlueter. 2015. Numerical Simulation of Energy Performance, and Construction of the Adaptive Solar Façade. Proceedings of Advanced Building Skin Conference.
- Velasco, R., A. P. Brakke, and D. Chavarro. 2015. Computer-aided architectural design futures. The next city-new technologies and the future of the built environment. Springer, Berlin Heidelberg, 172–191.
- Rossi, D., Z. Nagy, and A. Schlueter. 2012. Adaptive distributed robotics for environmental performance, occupant comfort and architectural expression. Int. J. Arch. Comp.10:341–360.
- Yoo, S. H., and E. T. Lee. 2002. Efficiency characteristic of building integrated photovoltaics as a shading device. Build. Environ.37:615–623.
- Yoo, S. H., and H. Manz. 2011. Available remodeling simulation for a BIPV as a shading device. Sol. Energy Mater. Sol. Cells95:394–397.
- Mandalaki, M., K. Zervas, T. Tsoutsos, and A. Vazakas. 2012. Assessment of fixed shading devices with integrated PV for efficient energy use. Sol. Energy86:2561–2575.
- Roche, D., H. Outhred, and R. J. Kaye. 1995. Analysis and control of mismatch power loss in photovoltaic arrays. Prog. Photovoltaics Res. Appl.3:115–127.
- D'Alessandro, V., A. Magnani, L. Codecasa, F. Di Napoli, P. Guerriero, and S. Daliento. 2015. Dynamic electrothermal simulation of photovoltaic plants. International Conference on Clean Electrical Power (ICCEP), 682–688.
- Narvarte, L., and E. Lorenzo. 2008. Tracking and ground cover ratio. Prog. Photovoltaics Res. Appl.16:703–714.
- Lorenzo, E., L. Narvarte, and J. Munoz. 2011. Tracking and back-tracking. Prog. Photovoltaics Res. Appl.19:747–753.
- Castellano, N. N., J. A. G. Parra, J. Valls-Guirado, and F. Manzano-Agugliaro. 2015. Optimal displacement of photovoltaic arrays rows using a novel shading model. Appl. Energy144:1–9.
- Diaz-Dorado, E., A. Suarez-Garcia, C. J. Carrillo, and J. Cidras. 2011. Optimal distribution for photovoltaic solar trackers to minimize power losses caused by shadows. Renewable Energy36:1826–1835.
- Mermoud, A.2012. Optimization of Row-Arrangement in PV Systems, Shading Loss Evaluations According to Module Positioning and Connexions. Proceedings of the 27th European Photovoltaic Solar Energy Conference.
- Tian, H., F. Mancilla-David, K. Ellis, E. Muljadi, and P. Jenkins. 2013. Determination of the optimal configuration for a photovoltaic array depending on the shading condition. Sol. Energy95:1–12.
- La Manna, D., V. Li Vigni, E. R. Sanseverino, V. Di Dio, and P. Romano. 2014. Reconfigurable electrical interconnection strategies for photovoltaic arrays: a review. Renew. Sustain. Energy Rev.33:412–426.
- Alonso-Garcia, M. C., J. M. Ruiz, and W. Herrmann. 2006. Computer simulation of shading effects in photovoltaic arrays. Renew. Energy31:1986–1993.
- Dongaonkar, S., C. Deline, and M. A. Alam. 2013. Performance and reliability implications of two-dimensional shading in monolithic thin-film photovoltaic modules. IEEE J. Photovol.3:1367–1375.
- Bishop, J. W.1988. Computer simulation of the effects of electrical mismatches in photovoltaic cell interconnection circuits. Solar Cells25:73–89.
- Deline, C., A. Dobos, S. Janzou, J. Meydbray, and M. Donovan. 2013. A simplified model of uniform shading in large photovoltaic arrays. Sol. Energy96:274–282.
- Patel, H., and V. Agarwal. 2008. MATLAB-based modeling to study the effects of partial shading on PV array characteristics. IEEE Trans. Energy Convers.23:302–310.
- Karatepe, E., M. Boztepe, and M. Colak. 2007. Development of a suitable model for characterizing photovoltaic arrays with shaded solar cells. Sol. Energy81:977–992.
- Maeki, A., S. Valkealahti, and J. Leppaaho. 2012. Operation of series-connected silicon-based photovoltaic modules under partial shading conditions. Prog. Photovol.20:298–309.
- Celik, B., E. Karatepe, N. Gokmen, and S. Silvestre. 2013. A virtual reality study of surrounding obstacles on BIPV systems for estimation of long-term performance of partially shaded PV arrays. Renewable Energy60:402–414.
- Tsai, H.-L.2010. Insolation-oriented model of photovoltaic module using matlab/simulink. Sol. Energy84:1318–1326.
- Ishaque, K., Z. Salam, and Syafaruddin. 2011. A comprehensive MATLAB simulink PV system simulator with partial shading capability based on two-diode model. Sol. Energy85:2217–2227.
- Quaschning, V., and R. Hanitsch. 1996. Numerical simulation of current-voltage characteristics of photovoltaic systems with shaded solar cells. Sol. Energy56:513–520.
- d’Alessandro, V.,F.,Di Napoli,P.,Guerriero, and S.Daliento, et al. 2015. An automated high-granularity tool for a fast evaluation of the yield of PV plants accounting for shading effects. Renew. Energy83:294–304.
- Capdevila, H., A. Marola, and M. Herrerias. 2013. High resolution shading modeling and performance simulation of sun-tracking photovoltaic systems. Proceedings of the 9th Int. Conf. on Concentrator Photovoltaic Systems.
- Poshtkouhi, S., V. Palaniappan, M. Fard, and O. Trescases. 2012. A General approach for quantifying the benefit of distributed power electronics for fine grained MPPT in photovoltaic applications using 3-D modeling. IEEE Trans. Power Electron.27:4656–4666.
- www.rhino3d.com (accessed 30 June 2015).
- www.grasshopper3d.com (accessed 30 June 2015).
- Häberlin, H.2012. Photovoltaics system design and practice. John Wiley & Sons, Hoboken, New Jersey, USA.
- Goswami, D. Y., F. Kreith, and J. F. Kreider. 2015. Principles of solar engineering, 3rd ed. Taylor and Francis, CRC Press, Boca Raton, Florida, USA.
- Jakubiec, J. A., and C. F. Reinhart. 2011. DIVA 2.0: Integrating daylight and thermal simulations using Rhinoceros 3D, Daysim and EnergyPlus. Proceedings of the 12th Conference of International Building Performance Simulation Association.
- Duffie, J. A., and W. A. Beckman. 2006. Solar engineering of thermal processes (Vol. 3). Wiley, New York, NY.
- Salomon, D.. 2011. The computer graphics manual: oblique projections. Springer Science & Business Media, London, England.
- www.luxrender.net (accessed 30 June 2015).
- Pharr, M., and G. Humphreys. 2010. Physically based rendering: from theory to implementation. Morgan Kaufmann, Burlington, Massachusetts, USA.
- www.meteonorm.com (accessed 30 June 2015).
- Dongaonkar, S., and M. A. Alam. 2015. Geometrical design of thin film photovoltaic modules for improved shade tolerance and performance. Prog. Photovoltaics Res. Appl.23:170–181. doi:10.1002/pip.2410.
- Koishiyev, G. T., and J. R. Sites. 2009. Impact of sheet resistance on 2-D modeling of thin-film solar cells. Sol. Energy Mater. Sol. Cells93:350–354.
- Mermoud, A., and T. Lejeune. 2010. Performance assessment of a simulation model for PV modules of any available technology. Proc. of the 25th European Photovoltaic Solar Energy Conference.
- Product datasheet Shell Solar ST40. Available at http://www.gehrlicher.com/fileadmin/content/pdfs/de/produktarchiv/Shell_ST40.pdf (accessed 30 June 2015).
- www.pvsyst.com (accessed 30 June 2015).
- Spirito, P., and V. Abergamo. 1982. Reverse bias power dissipation of shadowed or faulty cells in different array configurations, Proc. of the 25th European Photovoltaic Solar Energy Conference, 296–300.
- Alonso-Garcia, M. C., and J. M. Ruiz. 2006. Analysis and modelling the reverse characteristic of photovoltaic cells. Sol. Energy Mater. Sol. Cells90:1105–1120.
- Mack, P., T. Walter, R. Kniese, D. Hariskos, and R. Schäffler. 2008. Reverse Bias and Reverse Currents in CIGS Thin Film Solar Cells and Modules, Proc. of the 23rd European Photovoltaic Solar Energy Conference.
- Huld, T., M. Suri, and E. D. Dunlop. 2008. Comparison of potential solar electricity output from fixed-inclined and two-axis tracking photovoltaic modules in Europe. Prog. Photovoltaics Res. Appl.16:47–59.
- Koussa, M., A. Cheknane, S. Hadji, M. Haddadi, and S. Noureddine. 2011. Measured and modelled improvement in solar energy yield from flat plate photovoltaic systems utilizing different tracking systems and under a range of environmental conditions. Appl. Energy88:1756–1771.
- Drury, E., A. Lopez, P. Denholm, and R. Margolis. 2014. Relative performance of tracking versus fixed tilt photovoltaic systems in the USA. Prog. Photovoltaics Res. Appl.22:1302–1315.
- Perpinan, O.2012. Cost of energy and mutual shadows in a two-axis tracking PV system. Renewable Energy43:331–342.
- Garcia, M., J. M. Maruri, L. Marroyo, E. Lorenzo, and M. Perez. 2008. Partial shadowing, MPPT performance and inverter configurations: observations at tracking PV plants. Prog. Photovoltaics Res. Appl.16:529–536.
- Sarvi, M., S. Ahmadi, and S. Abdi. 2015. A PSO-based maximum power point tracking for photovoltaic systems under environmental and partially shaded conditions. Prog. Photovoltaics Res. Appl.23:201–214.
- Ishaque, K., and Z. Salam. 2013. A review of maximum power point tracking techniques of PV system for uniform insolation and partial shading condition. Renew. Sustain. Energy Rev.19:475–488.
- Svetozarevic, B., Z. Nagy, D. Rossi, and A. Schlueter. 2014. Experimental Characterization of a 2-DOF Soft Robotic Platform for Architectural Applications. Proceedings of the Robotics Science and Systems Conference, UC Berkeley, California.
- Roudsari, M., M. Pak, and A. Smith. 2014. Ladybug: A Parametric Environmental Plugin for Grasshopper to Help Designers Create an Environmentally-Conscious Design. Proc. of Int. Conf. of IBPSA, Chambery, France.
Document information
Published on 01/06/17
Submitted on 01/06/17
Licence: Other
Share this document
Keywords
claim authorship
Are you one of the authors of this document?
