Abstract
For a healthy and productive life, good sleep is essential, which has prompted studies on how comfortable sleep can be achieved. Understanding the relationship between thermal environment and physiological responses such as skin and core temperatures, and psychological responses such as thermal and sleep sensations is necessary to identify the most suitable thermal environment for sleep. As an energy-saving and practical method of creating the most appropriate thermal environment for sleep, local heating or cooling is sometimes used, which takes into consideration the differences in local thermal responses. We performed this study to identify the most effective thermal environment for inducing comfortable sleep by identifying the physiological responses during sleep on the basis of sleep experiments conducted under local body heating or cooling conditions. We also used a human thermal model, which can be applied for predicting physiological responses.
In the experiments, the feet of the subject were the primary area to be heated or cooled, which was achieved by installing a flexible duct with an outlet placed close to the subjects feet and inlet connected to an air conditioner. Differences in the fluctuation of body temperature and sleep stage depended on the airflow direction from the duct to the feet. When air was blown downward towards the feet, body temperature decreased and the subject was able to sleep well. Measured skin and core temperatures were calculated using an improved 27-node human thermal model that was originally developed for use in subjects who are not in sleep. Although skin temperature fluctuated significantly under local cooling, the results calculated using the proposed model agreed well with the measured results since the changes in heat conductance between the skin surface and surrounding environment as a result of the changes in the posture and feet position were taken into account. This result indicates that posture-associated changes in the heat conductance significantly influence skin temperature.
Keywords
Sleep ; Thermal environment ; Local air conditioning ; Physiological response ; Human thermal model
1. Introduction
For a healthy and productive life, good sleep is essential, which has prompted studies on how comfortable sleep can be achieved (Ishiguro et al., 2006 ). For comfortable sleep, it is very important to create an indoor thermal environment, which could still be improved. Understanding the relationship between thermal environment, physiological responses such as skin and core temperatures, and psychological responses such as thermal and sleep sensations is necessary for identifying the most suitable thermal environment for sleep. As an energy-saving and practical method for creating the most appropriate thermal environment for sleep, local heating or cooling is sometimes used, taking into consideration the differences in local thermal responses. Several studies on thermal comfort during waking hours have been conducted (Fanger, 1970 ; Kubota et al ., 1988 ; Mori et al ., 2003 ). However, only a few studies have examined the differences in the thermal sensation during sleep (Zhang, 2003 ); therefore, sufficient information for designing an ideal sleep environment has not been obtained. We performed this study on the basis of sleep experiments conducted under local body heating or cooling conditions to identify the most effective thermal environment for inducing comfortable sleep by identifying the physiological responses during sleep. We also used a human thermal model that can be applied for predicting physiological responses.
2. Sleep experiments under local heating or cooling conditions
2.1. Experimental outline
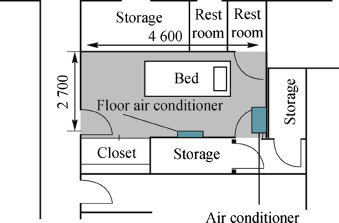
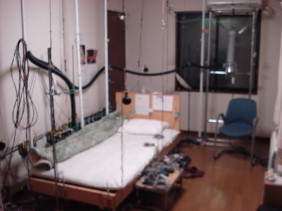
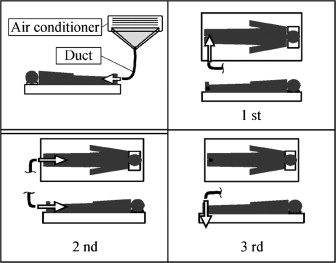
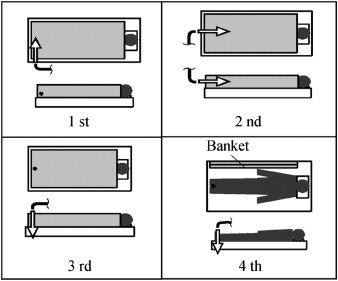
In an experimental chamber (Fig. 1 ; Fig. 2 ), we conducted three experiments in the summer and four experiments in the winter. Experimental conditions are listed in Table 1 (summer) and Table 2 (winter). The subject was a healthy university student (male; height: 167 cm; weight: 58 kg). In the summer experiments, the subject wore a short-sleeved T-shirt, short-pants, and trunks, while in the winter experiments, he wore a long-sleeved T-shirt, long-pants, and cotton trunks. A 9-cm-thick mattress having three cotton layers was placed on the bed. A 5-cm-thick cotton blanket was used in the winter, except for the fourth experiment in which the subject was not covered by the blanket at the start of the experiment and the room temperature was increased. However, the blanket was placed beside the subject for use when he felt cold. During the experiments, the room temperature was maintained by a floor air conditioner, while the subjects feet were heated or cooled using a flexible duct with an outlet placed close to the subjects feet and an inlet connected to another air conditioner (Fig. 3 ; Fig. 4 ).
|
|
|
Fig. 1. Floor plan of experimental chamber. |
|
|
|
Fig. 2. Photo of experimental chamber. |
| 1st | 2nd | 3rd | |
|---|---|---|---|
| Sleep time | 10:52 p.m.–7:00 a.m. | 0:00 a.m.–7:00 a.m. | 10:18 p.m.–7:00 a.m. |
| Preset temperature of floor air conditioner (°C) | 28 | 28 | 28 |
| Relative humidity (%) | 52.4±1.0 | 45.8±1.3 | 61.4±1.8 |
| Preset temperature of duct outlet (°C) | 26 | 26 | 26 |
| Direction of airflow | From side toward feet | From feet toward face | Downward toward feet |
| 1st | 2nd | 3rd | 4th | |
|---|---|---|---|---|
| Sleep time | 10:45 p.m.–7:00 a.m. | 10:30 p.m.–7:00 a.m. | 11:13 p.m.–7:00 a.m. | 10:35 p.m.–7:00 a.m. |
| Preset temperature of floor air conditioner (°C) | 21 | 21 | 21 | 24 |
| Relative humidity (%) | 37.9±1.5 | 38.6±1.3 | 43.1±0.9 | 36.9±1.6 |
| Preset temperature of duct outlet (°C) | 34 | 34 | 34 | 34 |
| Direction of airflow | From side toward feet | From feet toward face | Downward toward feet | Downward toward feet |
|
|
|
Fig. 3. Schematics of local heating or cooling (upper left) and positions and directions of duct (summer). |
|
|
|
Fig. 4. Positions and directions of duct (winter). |
2.2. Experimental results (indicated by “E” in Fig. 5 ; Fig. 9 )
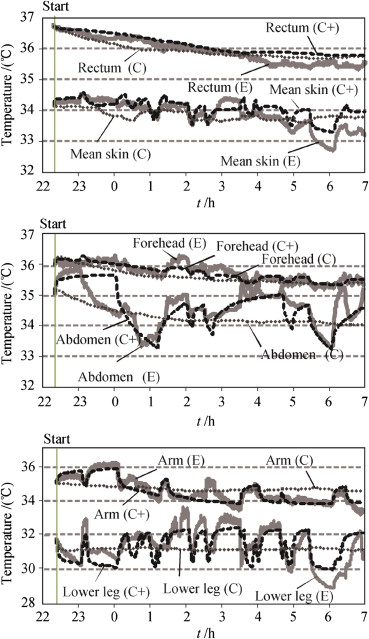
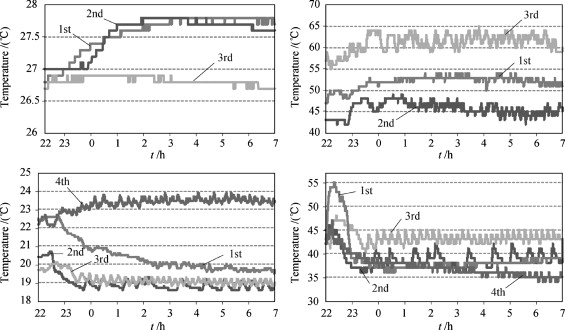
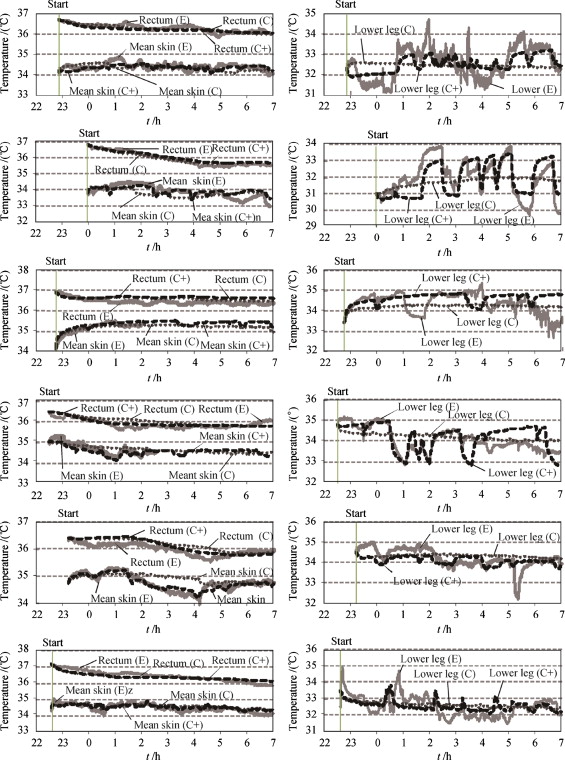
The measured skin (forehead, abdomen, arm, lower leg, and average) and core (rectum) temperatures in the third summer experiment are shown in Fig. 5 . For other experiments, only the results for skin (lower leg and average) and core temperatures are shown in Fig. 9 . The room temperature and relative humidity are shown in Fig. 6 .
- Core (rectum) temperature (Fig. 5 , upper graph).
The core temperature generally decreased with time in all experiments.
- Skin temperature.
The forehead temperature was stable between 35 and 36 °C in all experiments, while the temperatures of the extremities fluctuated significantly. In particular, the temperatures of the legs, which were locally heated or cooled, fluctuated significantly. It appeared that there were two periods, one when the air from the duct blew toward the leg surface directly and the other when it did not. Additionally, the skin temperature of the trunk fluctuated, likely because air from the duct blew onto the body. The mean skin temperature fluctuated as well, but gradually decreased like the core temperature.
|
|
|
Fig. 5. Skin and core temperatures (Top : rectum, mean skin; Middle : forehead, abdomen; Bottom : arm, lower leg). |
|
|
|
Fig. 6. Room temperature and relative humidity (Upper : summer experiments; Lower : winter experiments). |
2.3. Effect of airflow direction from duct
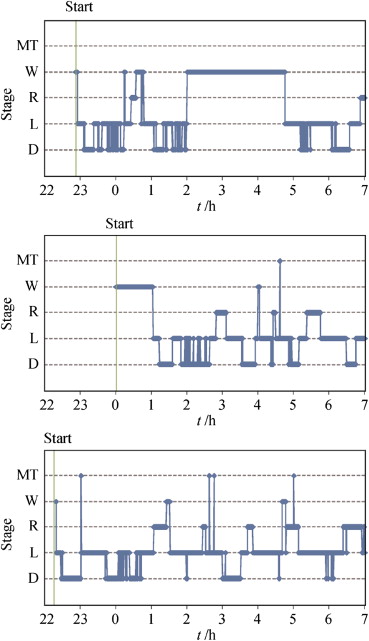
Sleep stages in the summer experiments are shown in Fig. 7 .
|
|
|
Fig. 7. Sleep stages in summer experiments (Top : 1st; Middle : 2nd; Bottom : 3rd). |
The effects of the airflow direction from the duct are summarized as follows. In the summer experiments,
- When air was blown from the side toward the feet (first experiment), a longer awakening period, more frequent body motion, and lesser decrease in the body temperature were observed than in any other summer experiment. However, these results may be partly attributed to the first night effect.
- When air was blown from the feet toward the face (second experiment), the subject experienced difficulty in getting to sleep. At the end of the experiment, the subject reported that the airflow to his face disturbed his sleep and he experienced dryness.
- When air was directed downward toward the feet (third experiment), the subject experienced deeper sleep than in other experiments and the body temperature decreased to the greatest extent.
It can be summarized that the best direction for the airflow is downward toward the feet. In the winter experiments, only slight differences were observed between all airflow directions probably because of the use of the blanket.
3. Analysis of physiological response during sleep using a human thermal model
3.1. Outline of human thermal model
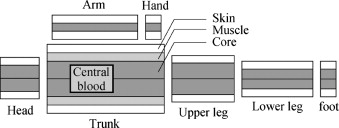
The human thermal model used in this study was originally proposed by Stolwijk and Hardy (1966) and modified by Ishiguro et al. (2009) to examine subjects during sleep. During sleep, there is a significant difference in the amount of heat loss to the environment, depending on whether the skin is exposed to the blanket or to air. To take non-uniformity into account, the human body is divided into 27 parts (Fig. 8 ) and the temperature of each part is calculated on the basis of the heat balance in Ishiguros model. The skin blood-flow rate is calculated using the model proposed by Munir et al. (2009) .
|
|
|
Fig. 8. Schematics of 27-node human thermal model. |
3.2. Calculated results (indicated by “C” in Fig. 5 ; Fig. 9 )
- Core temperature.
The calculated core (rectum) temperatures agreed well with the measured results, although when compared to the measured results, the calculated core temperatures were lower during early periods and higher during later periods.
|
|
|
Fig. 9. Skin and core temperatures (from top, 1st (summer), 2nd (summer), 1st (winter), 2nd (winter), 3rd (winter), 4th (winter)). |
- Skin temperatures.
The calculated forehead temperature agreed well with the measured results. With respect to the trunk part and extremities, however, the calculated temperature fluctuations did not agree with the measured values, although the averages were predicted reasonably well. Since the subjects feet were locally heated or cooled during the experiment, the heat conductance between the skin and surrounding environment varied significantly because of the posture changes, particularly in the feet. Therefore, the fluctuations in the skin temperatures could not be accurately predicted.
4. Analysis considering posture changes
To improve the calculated results, the effect of posture changes was taken into consideration for the simulations.
4.1. Method of analysis
In simulations, the heat conductance between the skin and surrounding environment, which was time-dependent because of posture changes, was estimated using the subjects posture shot on an infrared thermograph. In the estimation, we searched for the best values so that the calculated results agreed well with the measured results.
4.2. Calculated results considering posture change (indicated by “C+” in Fig. 5 ; Fig. 9 )
The heat conductance in the simulations for several parts of the body is listed in Table 3 for the third summer experiment.
- Core temperature.
The calculated core temperatures were nearly the same as those without considering posture changes, although there was a small difference between experimental cases. This indicates that heat conductance has little influence on the core temperature.
- Skin temperatures.
The calculated temperature fluctuations in the trunk and extremities agreed very well with the measured results because posture changes were taken into account (Fig. 5 ). This result indicates that heat conductance change associated with posture change significantly influences skin temperature, which plays a particularly important role under local body heating or cooling conditions.
| Part of the body | Posture | Heat conductance (W/m2 /K) |
| Trunk (upper part): air | Back on bed | 8.0 |
| Lateral | 2.0 | |
| Hands on stomach | 2.0 | |
| Arm: air | Back on bed/lateral | 7.0 |
| Hands on stomach | 3.0 | |
| Lower leg (upper part): air | Back on bed | 25.0 |
| Lateral | 10.0 | |
5. Conclusion
In this study, we conducted sleep experiments under local body heating or cooling, and measured skin and core temperatures using a human thermal model. Differences in the fluctuations of body temperature and sleep stage depend on the airflow direction from the duct to the feet. When air was blown downward toward the feet, body temperature decreased and the subject was able to sleep well. Although skin temperature fluctuated significantly under local cooling, the results calculated using the proposed model agreed well with the measured results, for which the changes in heat conductance between the skin and surrounding environment due to posture changes were taken into account. This result indicates that heat conductance change associated with posture change significantly influences skin temperature.
References
- Fanger, 1970 P.O. Fanger; Thermal Comfort; McGraw-Hill, New York (1970)
- Ishiguro et al., 2009 A. Ishiguro, S. Hokoi, S. Takada, K. Ishizu; Thermal model of human body considering clothes and bedding during sleep; Journal of Environmental Engineering, 74 (636) (2009), pp. 141–149
- Ishiguro et al., 2006 Ishiguro, A., Hokoi, S., Takada, S., Komoto, N., Abuku, M., Ishizu, K., 2006. Indoor climate for comfortable sleep, considering heat and moisture transfer between the room, bedding and human body: air control system using a predictive model for thermal comfort. In: Proceedings of the Third International Building Physics Conference, Research in Building Physics and Building Engineering, Montreal, Canada, 27–31 August 2006, pp. 775–781.
- Kubota et al., 1988 H. Kubota, Y. Ishitoya, K. Ishio, I. Ige; Evaluation of heating room temperature in regard to a thermal sensation of finger; Journal of Architecture, Planning and Environmental Engineering, AIJ, 384 (1988), pp. 12–19 (in Japanese)
- Mori et al., 2003 I. Mori, S. Hokoi, S. Takada, H. Tanaka; Experimental study on thermal sensation index in thermal transients; Journal of Architecture, Planning and Environmental Engineering, AIJ, 563 (2003), pp. 9–15 (in Japanese)
- Munir et al., 2009 A. Munir, S. Takada, T. Matsushita; Re-evaluation of Stolwijks 25-node human thermal model under thermal-transient conditions: prediction of skin temperature in low-activity conditions; Building and Environment, 44 (2009), pp. 1777–1787
- Stolwijk and Hardy, 1966 J.A.J. Stolwijk, J.D. Hardy; Temperature regulation in man – theoretical study; Pflugers Archiv, 291 (1966), pp. 129–162
- Zhang, 2003 Zhang, H., 2003. Human Thermal Sensation and Comfort in Transient and Non-uniform Thermal Environments. Dissertation for the Doctoral Degree.
Document information
Published on 12/05/17
Submitted on 12/05/17
Licence: Other
Share this document
Keywords
claim authorship
Are you one of the authors of this document?
