Abstract
A trimaran is a multihull vessel designed to reduce wave-making resistances at high speeds. Optimization of the hull shape increases hull efficiency and speed of a vessel. The behavior of a ship is generally analyzed through numerical methods to save time and reduce high expenditures as compared to experimental methods. Although wide ranges of studies have investigated the hydrodynamic behavior of a vessel, the effect of trim angle, yaw angle, and heel angle of side hulls on hydrodynamic behavior of a trimaran has not been addressed properly. In the present study, a trimaran was modeled using computer-aided design software. Dimensions of the computational domain and boundary conditions were applied. Furthermore, mesh convergence was carried out. The accuracy of the method was validated. Analyses are based on the finite volume method. The analysis is carried out to obtain the resistance of side hulls and its effect on total trimaran resistance, effect of speed on hulls vessel resistance, wave patterns generated by the vessel at different trim and yaw angles, effect of trim, heel and yaw angles on side hull and total resistance of trimaran, the wetted surface at different trim, yaw, and heel angles, shape of free surface between the hulls, and the optimal position and trim angle of side hulls relative to the main hull. This computational analysis represents a step in quantifying the role of the trim, heel and yaw angles of side hulls on hydrodynamic characteristics of trimaran in calm water. The worth of information from the present study may express the importance of the factors that could reduce the total resistance of a trimaran.
Keywords: Trimaran, hydrodynamics, resistance, trim angle, side hull
1. Introduction
Different hull forms have been proposed to date to reduce resistance as well as to increase vessel speeds. Flight boats, hydrofoils, catamaran, and trimaran are such forms of hulls. The friction resistance has been minimized to achieve higher speeds with the same engine power. Various methods have been used to increase vessel speeds thus far, such as by increasing the power of the propulsion system, changing the materials, and modifying the hull shape. Augmenting engine power directly enhances fuel consumption, thus adding towards a higher initial cost and an increase in vessel weight. On the other hand, optimization of the hull shape can increase hull efficiency and speed without imposing extra costs due to the increase in power of the propulsion system. Planing hulls and hydrofoils reduce the contact area between the hull and the water to minimize friction resistance. Previous studies have demonstrated the effectiveness of use of spray rail, step, and tunnel [1,2].
Unlike planing and hydrofoil vessels, the main idea behind the design of catamaran and trimaran is to reduce the wave-making resistance at high speeds, which is achieved by consolidating a large amount of slenderness coefficient in the initial design of the hull form. Hence, hulls with high length and low width were made such that there is significant reduction in the wave-making resistance. However, the low transverse stability from these types of hulls was undesirable. To overcome this problem, catamaran and trimaran vessels were designed by putting two and three hulls together.
A trimaran is a type of multihull vessel that comprises three narrow and long hulls. On one hand, the advantageous wave interference caused by the side hulls gives the trimaran a smaller resistance and better stability; on the other hand, its complex cross-deck structure makes the investigation on vibration for trimarans more difficult [3]. In most cases, the hydrodynamic behavior of a trimaran is similar to that of a catamaran, however, several differences have deemed the trimaran a better performing vessel [4]. Davis et al. (2007) studied the behavior of trimaran vessels and concluded that vessel roll motion is greatly increased by decreasing the volume of the side hulls [5]. Therefore, the main factor for the transverse stability of a trimaran vessel is the presence of side hulls with appropriate dimensions. Despite increasing frictional resistance due to the existence of several hulls alongside each other, the total resistance is always decreased by the reduction of wave-making resistance in the hull form of a trimaran. The correct understanding of the nature of the wave-making resistance and the destructive interference of the waves depends on the accurate knowledge of the waves generated by the vessel. Zhang et al. (2015) investigated the interference of waves made by a mono-hull vessel using the Kelvin wave pattern [6]. The authors expanded their studies to a catamaran vessel [7].
A variety of analytical, experimental and numerical methods can be are used to study the hydrodynamic behavior of a vessel. Analytical methods use the mathematical formulas presented by previous researchers for their model. Existing mathematical relationships have been generally created through the experiences achieved in laboratories. However, generalizations of the mathematical relationships to different models require complex mathematical operations. Xiao et al. (2004) calculated the amount of wave-making resistance of a trimaran vessel using mathematical formulae [8]. Then, the formula was used to optimize the hull configuration with the minimum wave-making resistance. Doctor et al. (2005) and Macki et al. (2006) measured the total resistance of a vessel by developing an empirical formula [9,10]. In addition to the analytical method, a wide range of studies on trimaran hull forms have been performed in the laboratory. Begovic et al. (2001) evaluated the effect of wave pattern on the resistance of trimaran hulls experimentally [11]. Tang et al. (2016) investigated the hydrodynamic behavior of a trimaran in irregular and asymmetric wave conditions and examined the vibrations of these motions in the laboratory [12].
Nowadays, the development of numerical methods has simplified the conditions for researchers who do not have access to a laboratory. Many studies have investigated the hydrodynamic behavior of a vessel using numerical methods, such as boundary element method, finite element method (FEM), finite volume method (FVM), and strip theory. Savander et al. (2002) used the boundary value method for stable planing hulls [13]. Kohansal et al. (2010) predicted the hydrodynamic characteristics of different hull forms at small trim angles using the same method [14]. In another study, Kohansal et al. (2011) calculated the wetted surface area of a vessel by combining the boundary element method and potential theory [15]. Many studies have also been conducted using numerical and experimental methods for trimaran vessels. Wang et al. (2010) and Hu et al. (2010) also undertook a series of trimaran model tests to analyze vibrations on the longitudinal and transverse structures in regular and irregular waves [16, 17]. Deng et al. (2015) calculated clam water resistance as well as the resistance components of a trimaran model test with and without appendages via computational fluid dynamics (CFD) under different conditions [18]. The author compared the numerical results of the free model with the test data, which did show good agreement. Hampshire et al. (2004) carried out the loading experiment at QinetiQ Rosyth using a segmented trimaran model [19]. The segments of the main hull and side hull were connected separately by a beam of varying stiffness. The data were applied to the design and structure analyses of trimaran.
The form and configuration of side hulls are significant to reduce the resistance of trimaran vessels. Hence, any changes in the configuration of the side hulls would alter the overall form of the vessel while encountering with the wave and the water level. Consequently, by changing the angle of the trim, heel, and yaw of side hulls can investigate the effect of wave-making resistance, changes of the resistance coefficient (lift and drag), and the effect of configuration on hydrodynamic components of the vessel. Until now, there is a wide range of studies on the behavior of trimaran vessels; however, the effect of trim angle, yaw angle and heel angle of side hulls on hydrodynamic behavior have rarely been given much attention. Therefore, the relevant problems have not been fully addressed. In the present study, the effect of trim, yaw and heel angle of side hulls on the hydrodynamic behavior of the trimaran were investigated using numerical method. A trimaran model was simulated using computer-aided design software. To ensure the accuracy of the method, the results of the resistance coefficients were compared with an experimental study. The longitudinal and transverse positions and the height of side hulls remained unchanged. Meanwhile, the optimum computational domain was investigated, and mesh convergence was carried out. The analysis is carried out to obtain the resistance of side hulls and its effect on total resistance, effect of speed on hulls resistance, wave patterns generated by the vessel at different trim and yaw angles, effect of trim, heel and yaw angles on side hull and total resistance, the wetted surface at different trim, yaw, and heel angles, shape of free surface between the hulls, and the optimal position and trim angle of side hulls relative to the main hull. The worth of information from these analyses may express the important factors that could mitigate the total resistance of a trimaran. The conclusion of the study would play a great role in providing guidelines on side hull design and further contribute towards the improvement of the hydrodynamic characteristics of trimarans.
2. Material and Method
2.1 Model geometry
The hull model and hull lines were selected from the model tested by Brizzolara et al., which is a trimaran with a main hull and two side hulls [20]. The dotted lines of the hull lines were made using the plot digitizer software; then the coordinates of the obtained results were entered into the AutoCAD (Autodesk , USA) software, and the same hull lines were drawn and modeled (Figure 1). Afterward, the lines of the body were plotted, and the shape of the float was obtained.

|
| Figure 1. Hull lines of the trimaran. (a) Front. (b) Top |
Figure 2 shows a 3-dimensional (3D) model of the trimaran, which was simulated using AutoCAD software. The full-scale vessel has a length of 105.6 m. The main and side hulls were both selected from the 64 series and had round bilge. This standard series was introduced in 1974 and includes several hull lines to design planing hulls. Table 1 presents the principal dimensions of the main and side hulls [20].

|
| Figure 2. 3D model of the trimaran |
| Parameter | Main hull | Side hull |
| LWL (m) | 105.6 | 35.19 |
| T (m) | 4.416 | 0.69 |
| B (m) | 8.38 | 1.65 |
| (kg) Δ | 2318.19 | 14.37 |
| (kn) | 36 | 36 |
| CB | 0.55 | 0.35 |
| L/B | 11.96 | 21.5 |
| B/T | 2.00 | 2.39 |
Due to the large dimensions of the full-scale vessel, it was necessary to provide a scaled model according to the laboratory conditions to test the towing tank. The choice of the appropriate scale for the model always depends on the dimensions of the towing tank. The initial model of the vessel was scaled and modeled in AutoCAD software. Table 2 shows the different modes of hull and side hulls to indicate the two-heel orientation [20]. Generally, the position of the side hull is defined in the same direction as the main hull. This position is expressed in terms of longitudinal, transverse and vertical distances of the hulls from each other. The longitudinal distance is the distance between the stern of the main hull and the stern of the side hull, which is measured along the x-axis. The transverse distance is the distance between the longitudinal centerline of the main hull and the longitudinal centerline of the side hull, which is measured along the y-axis. The third position determines the position of the hulls relative to each other, which is the vertical position of the side hull relative to the main hull. In this study, the side hull was 0.077 m above the main hull. Also, the side hull was at a longitudinal distance of 0 m and a transverse distance of 0.209 m from the main hull (Figure 3).

|
| Figure 3. The position of side hull relative to the main hull |
| Parameter | Main hull | Side hull |
| LWL (m) | 2.112 | 0.697 |
| T (m) | 0.091 | 0.014 |
| B (m) | 0.177 | 0.032 |
| (kg) Δ | 18.124 | 0.109 |
| scale | 0.02 | 0.02 |
| CB | 0.55 | 0.35 |
| L/B | 11.96 | 21.5 |
| B/T | 2.00 | 2.39 |
Based on Figure 4, a right-handed coordinate system was considered at the center line of the main hull. The origin of this coordinate system coincides at the intersection point of keel and stern. The x-axis is along the vessel and its positive direction is towards the bow of the vessel. The z-axis is defined in the vertical direction, and the positive direction of the y-axis is towards the starboard of the vessel. The position of the side hull relative to the main hull can be calculated relative to the coordinate axes.

|
| Figure 4. Coordinate axes |
2.2 Resistance components
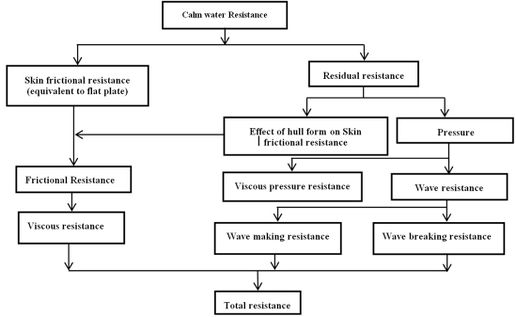
The study of resistance in trimaran vessel is slightly different due to the positioning of the three hulls alongside each other, therefore, the interaction between the hulls must be considered. The resistance of a vessel consists of several components. Figure 5 shows the resistance components of a vessel, separately [21]. Hence, the main components of the resistance are shown, whereas other resistances, such as wind resistance, dormancy strength, and resistance to motion in shallow water are excluded. This pattern has always been used for a variety of vessels, and with small changes, it can be generalized to a trimaran vessel. Of course, in this model, the main components of the resistance have been cited, and other resistances, such as wind resistance have been ignored. With regards to the dependence of each component of the resistance on a dimensionless number, the model's resistance is generalized using the dimensionless number scale corresponding to the total resistance of the vessel. Based on the type of vessel, some components of resistance shown in Figure 5 are more important than others. The vessel resistance in water is divided into two parts of residual and frictional resistance. To calculate total resistance in this study, the residual resistance, (it has two components; pressure resistance and shell resistance), shell frictional resistance, wave-making resistance, wave resistance, frictional resistance, viscous resistance, and viscous pressure were considered.
|
| Figure 5. Resistance components of a vessel in calm water |
Calm water was considered as an initial condition to calculate the resistance and resistance coefficient in simulating the trimaran. Vessel speed in each Froude number was calculated using Eq.(1) to (2). Eq.(1) is used for the calculation of Froude number. In this equation, is the vessel speed, and is the gravity (9.81 N/kg). Also, is vessel displacement and is obtained using Eq.(2)
|
|
(1) |
|
|
(2) |
where is the total vertical force that consists of the weight of the fluid in the negative direction and the buoyant force, the total weight of the trimaran, which is given by Eq.(3). The weight of the main and side hulls is as presented in Table 2. Thus, the vessel speed for each Froude number is given by inserting the values of displacement and water density in Eq.(1)
|
|
(3) |
The simulations were carried out by assuming that there is no freedom of movement for the vessel. Therefore, the amounts of trim vessel draft were determined based on the laboratory results and were constant throughout the analysis. The dynamic amount of trimaran draft was calculated relative to the initial draft at different Froude numbers. The final amount of draft was obtained from the summation of the static and dynamic drafts. Residual resistance is one of the main components of resistance that has a significant impact on the final vessel resistance
|
|
(4) |
where is the resistance coefficient of the resonant wave propagation, the hull shape factor in the main and side hulls, , , and are the total wetted surface of the vessel, the main hull, and the side hull, respectively. The wetted surface of the main hull and side hull is obtained through software analysis. However, the total wetted surface of the trimaran is calculated as follows:
|
|
(5) |
where is the frictional resistance in calm water, which was obtained from Eqs.(6) and (7):
|
|
(6) |
|
|
(7) |
The Reynolds number (Rn) for the main and side hulls was calculated using Eqs.(8) and (9)
|
|
(8) |
|
|
(9) |
where is the vessel velocity and the waterline length in each part. The irrigation resistance coefficient in calm water is obtained as follows:
|
|
(10) |
where is the wave-making resistance coefficient for the main and side hulls, which were calculated using Eqs.(11) and (12)
|
|
(11) |
|
|
(12) |
where is the water density, the wetted surface of the vessel, and the pressure section of the resistance applied to the hull when the vessel moves in calm water. This resistance includes the wave resistance and the viscous compressive resistance of the hull. The wave resistance includes wave breaking resistance and wave-making resistance. Using Eqs.(4) and (12), the residual coefficient in the trimaran can be calculated.
Speed of vessel was calculated in each Froude number using Eqs.(1) and (2) based on Figure 5, mentioned equations, and the initial conditions used in the simulation of trimaran in calm water. In Eq.(2), is a vertical force and the total weight of the trimaran which is obtained from Eq.(3). To obtain the resistance, it was necessary to calculate the wetted surface and the resistance coefficient. The level of the wetted surface of the vessel can be calculated for the main hull and the side with using Eq.(5). In the trimaran, the residual coefficient of resistance is obtained from Eq.(4) which consists of two components; the coefficient of wave-making resistance and the resistance coefficient of the form of the hull in the shell, (it is, in fact, the friction resistance). Eq.(10) is used to calculate the coefficient of wave-making resistance. The coefficient of wave-making resistance for main and side hulls is obtained by Eqs.(11) and (12). is obtained from the results of the simulation.
2.3 Computational domain and boundary conditions
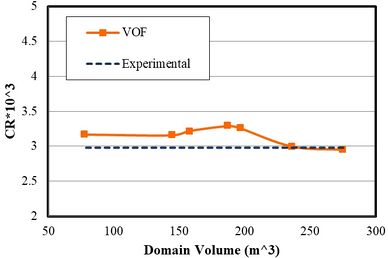
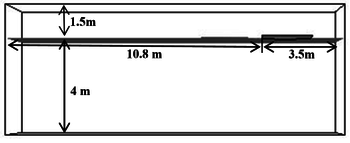
In this study, various dimensions of the computational domain were considered. Therefore, all models were imported to Star-CCM (CD-adapco, USA) software for analysis. Then, the results for each computational domain were compared with an experimental study [20]. Figure 6 shows the comparison between the numerical and experimental results in terms of computational domain volume. The simulations were performed at the highest speed (Froude number 0.6). Based on Figure 5, at the volume of fluid (VOF) of 235 , the numerical results were reasonably close to the experimental results and there was a very small error. However, with further increase in domain size, the results did not change significantly, whereby this only led to an increase in unnecessary computations. From here, a domain with a volume of 235 was chosen for the simulations in this study. Figure 7 shows the dimensions of this domain. The width of the computational domain was 3 m as well.
|
| Figure 6. Independence of the results from computational domain size at Froude number of 0.6 |
|
| Figure 7. Dimensions of the computational domain |
These computational dimensions for vessel simulations were used to ensure that vessel waveforms do not match the magnitude of the waveform. Thus, for further investigations, smaller dimensions may be selected such that the necessary conditions can be created with unnecessary calculations reduced, ultimately minimizing time spent for analysis. Therefore, by changing the dimensions of the computational range of the star Star-CCM software and comparing the numerical results in each domain with the experimental results, the optimal dimensions were chosen without any significant effect on the final results.
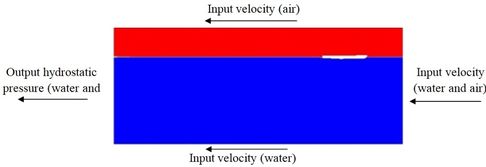
After determination of the computational domain, it was necessary to define the boundary conditions of this domain with respect to the physics of the problem (Figure 8). At the input, the boundary condition was velocity, acting perpendicular to the boundary. The tangential velocity was at the upper and lower boundaries. At the output, the conditions were defined such that output pressure is equal to hydrostatic pressure. The boundaries at the right and left sides of the vessel were considered symmetric. Table 3 shows the physical properties of water and air [20]. The fluids in the computational domain were defined as the Eulerian multiphase, which includes air, water, and the combination of the two phases. Furthermore, due to the interaction between the water and the moving cylinder under the water surface, the flow regime was considered turbulent. The model was also used to solve the equations governing the turbulent flow regime.
|
| Figure 8. Boundary conditions |
| Viscosity (Pa-s) | Density () | Fluid Physical |
| 8.887 × | 997.561 | water |
| 1.85× | 1.18415 | air |
2.4 Mesh Convergence
Mesh convergence was carried out using the Star-CCM software. Three types of mesh, including surface, prism layer, and trimmer were used in this study. The surface mesh was used for the surface of the hull as well as the outer boundaries of the computational domain. The finest surface mesh was defined on the side hulls by considering the dimensions of the side hull in comparison with the main hull. At the free surface of the contact area of the two fluids (air and water), the cells contain two phases of fluid that are combined in the presence of a spray flow of these two fluids. Otherwise, water is placed, as the heavier fluid on the cell floor and the cell contains both fluids. To determine the exact location of each fluid within the cells in the free surface, smaller cells must be created in the area. For this purpose, a free-timer network was used. As shown in Figure 9(a), at the free surface, the height of the cells decreases along the z-axis in a controlled manner. Two cubes were defined around each side hull and main hull. In these volumes, using the surface network of the cells, the model was minified as desired, thus reducing calculation error. Figure 9(b) shows the grid on the surface of the main and side hulls. Due to the smaller dimensions of the side hull, a smaller mesh was chosen for its surface. With regards to the base size, each cell in the Star-CCM software was 0.3 m with a growth rate of 1.3, the maximum cell size was estimated to be about 5000 times the size of the base. By moving away from the hull and approaching the outer boundaries of the computational domain, the mesh size was increased by the growth rate of 1.3, hence, generating the largest cell size at the outer boundaries. Also, to accurately resolve the interface between air and water, a trimmer mesh was used for this region. Six parallel layers of prism layer mesh with a thickness of 0.007 m were generated around the hull. This type of mesh helps to improve simulation results.

|
| Figure 9. (a) Comparison of mesh on the side and main hull surfaces. (b) Mesh structure |
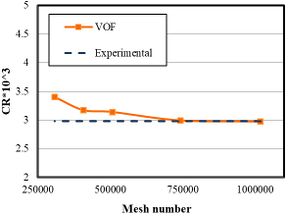
A mesh convergence was performed at Froude number 0.6. Fundamentally, the resistance coefficient was obtained using different mesh sizes and the results were compared with an experimental study under the same conditions (Figure 10). The computational domain size was the same for all simulations. As the number of cells approached 741,868, the numerical results approached closer to that of experimental with a decrease in value of error. Then, with a further increase in the number of cells, the simulation time increased without any significant change in accuracy. Consequently, the mesh with 741,868 cells was chosen as the optimal mesh to perform the simulations at different Froude numbers.
|
| Figure 10. Mesh convergence at Froude number 0.6 |
3. Results
3.1 Validation of residual resistance coefficients
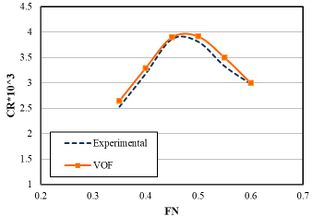
Figure 11 compares the residual resistance coefficients of the numerical method with the experimental values. Resistance coefficient depends on various parameters, such as wetted surface area, forces acting on the vessel, and hull speed. Therefore, the explanation of the fluctuation of the resistance coefficient diagram depends on an exact understanding of the hull behavior and a detailed investigation of each of these parameters at different speeds.There was good consistency between experimental and numerical results. The maximum numerical error was 5%, which was at Froude number 0.55. The residual coefficient had a peak of at Froude number 0.5. The residual coefficient increased from Froude number 0.35 to 0.5. In other words, by increasing the vessel speed at Froude number higher than 0.5, the resistance coefficient decreased to , as seen at Froude number 0.6. As such, the hull at lower speeds would have more volume of the vessel underwater. The non-submerged vessel body and the decrease of the wetted surface area both reduce the friction and viscosity resistances. The wetted surface and viscosity of the fluid are two important factors for increasing resistance, hence, the resistance coefficient reduced as the Froude number exceeds 0.5. The residual resistance coefficient peaked at Froude number 0.5, and then decreased as velocity increased.
|
| Figure 11. Numerical and experimental results of residual resistance coefficient (VOF: Volume of fluid) |
3.2 Impact of speed on resistance
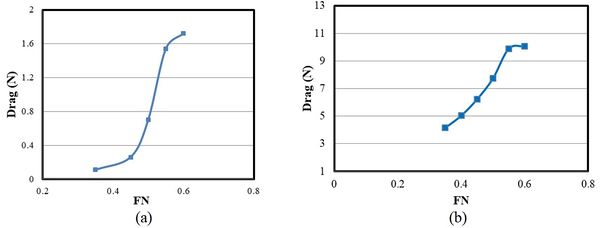
The resistance of the side and main hulls is the most important parameter affecting the resistance coefficient. Figure 12 shows the effect of speed on the resistance of the side and main hulls. As speed is increased, the resistance in both hulls increases with a high slope. For the side hull, the resistance increases with the growth of the Froude number at 0.5. This sudden growth may be due to the wave-making pattern and wave interference. For the main hull, the resistance continuously increases with Froude number. However, there was no significant change in resistance beyond Froude number 0.55. Maximum total resistance for side hull was seen at 1.72 N however, the lowest total resistance occurred at 0.059 N. For the main hull, the maximum total resistance for the side hull was observed at 10.065 N, however, the lowest total resistance was seen at 5.033 N.
|
| Figure 12. (a) Total resistance of side hull. (b) Total resistance of the main hull |
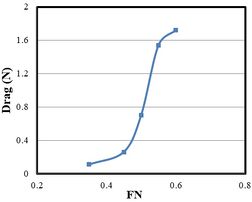
Table 4 shows all variations in the side hull resistance and total resistance. Since the side hulls have smaller dimensions than the main hull in a trimaran vessel, it is expected that the side hulls have a smaller contribution in total resistance. At Froude number 0.35, the total resistance was 4.16 N and the total resistance of side hull was 0.11. An increasing trend was observed for both total resistance and the total resistance of the side hulls with the growth of Froude number. Consequently, at Froude number 0.6, the total resistance was 1.72 N and the total resistance of the side hull was 10.065. Figure 13 shows the ratio of the side hull resistance to the total resistance in terms of Froude number. At Froude numbers below 0.45, less than 5% of the total resistance originated from the side hulls. However, as the speed increased, the contribution from the side hulls intensified until Froude number 0.6. Here, approximately 17% of the total resistance came from the side hulls. Using the optimal hull arrangement, the total resistance can be reduced at high speeds by decreasing the resistance of the side hulls.
| Total resistance (N) | Total resistance of side hull (N) | Froude Number | No. |
| 4.16 | 0.11 | 0.35 | 1 |
| 6.22 | 0.26 | 0.45 | 2 |
| 7.73 | 0.7 | 0.5 | 3 |
| 9.89 | 1.54 | 0.55 | 4 |
| 10.065 | 1.72 | 0.6 | 5 |
|
| Figure 13. The ratio of the side hulls resistance to the total resistance at different Froude numbers |
3.3 Effect of trim angle on the side and main hull resistance
In this study, the angular configuration of trimaran side hulls was considered. With regards to the coordinate axes, the side hull was rotated around the -axis at determined angles. Then, this motion was investigated at different speeds, including its effect on vessel resistance. The transverse distance of the side hull from the main hull was 0.209 m, and the transoms of all three hulls were in the same direction. The effect of trim angle of the side hull was investigated relative to the main hull at four Froude numbers and four trim angles of 0º, 0.4º, 0.8º and 1.2º (Table 5 and Figure 14). The results showed that resistance of the side hull reduced as the trim angle of the side hull increased. Also, at all speeds, the total resistance of the trimaran vessel reduced with growing relative trim angle. Furthermore, with the increase of Froude number, the percentage of reduction in hull resistance increased due to relative trim angle. The wetted surfaces of the vessel were investigated for different trim angles and Froude numbers. At Froude number 0.4 and speed of 2.98 m/s, the trim angle of the main hull was 0.2°; and at Froude number 0.45 and speed of 3.356 m/s, the trim angle of the main hull increased to 0.44°. The increasing trend retained until it peaked at 0.77° for the speed of 4.47 m/s and Froude number 0.6.
| No. | Froude Number | Speed (m/s) | Trim angle of main hull (ᵒ) | Trim angle of side hull (ᵒ) |
| 1 | 0.4 | 2.98 | 0.2 | 0º, 0.4º, 0.8º, 1.2º |
| 2 | 0.45 | 3.356 | 0.44 | 0º, 0.4º, 0.8º, 1.2º |
| 3 | 0.4 | 3.73 | 0.66 | 0º, 0.4º, 0.8º, 1.2º |
| 4 | 0.55 | 4.1 | 0.72 | 0º, 0.4º, 0.8º, 1.2º |
| 5 | 0.6 | 4.47 | 0.77 | 0º, 0.4º, 0.8º, 1.2º |

|
| Figure 14. Trim angle (1.2º) for side hull relative to main hull |
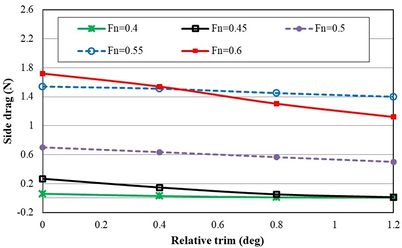
Figure 15 shows the effect of the trim angle on side hull resistance. The horizontal axis is the relative trim angle between the side hull and the main hull. The zero-relative angles correspond to the situation where the trim angles of the side hull and the main hull are equal. All trim angles were towards the stern. The side hull resistance was calculated in the presence of the main hull together with its effect on the shape of the flow encountering the side hull. The increase in relative trim angle led to a decrease in the side hull resistance. However, with the increase of relative trim angle from 0.8° to 1.2° at Froude number 0.4, the changes in resistance were insignificant. It was seen that regardless of Froude number, the increase in relative trim angle between the side and main hulls led to a reduction in side hull resistance. However, the effect of this parameter varied at different speeds.
|
| Figure 15. The resistance of side hulls at different trim angles |
For Froude number 0.4 and speed of 2.98 m/s, the side hull resistances were 0.059 N, 0.0269 N, 0.0089 N, and 0.007 N for trim angles of 0°, 0.4°, 0.8°, and 1.2°, respectively. The larger wetted surface resulted in higher frictional resistance. For Froude number 0.45 and speed of 3.31 m/s, side hull resistances were 0.262 N, 0.146 N, 0.051 N, and 0.011 N for trim angles of 0°, 0.4°, 0.8° and 1.2°, respectively. For Froude number 0.5 and speed of 3.73 m/s, the side hull resistances were 0.7 N, 0.635 N, 0.5649 N, and 0.5 N for trim angles of 0°, 0.4°, 0.8° ,and 1.2°, respectively. Furthermore, for Froude number 0.55 and speed of 4.1 m/s, the side hull resistances were 1.54 N, 1.499 N, 1.51 N, and 1.12 N for trim angles of 0°, 0.4°, 0.8°, and 1.2°, respectively. Finally, for Froude number 0.6 and speed of 4.47 m/s, the side hull resistances were 1.72 N, 1.52 N, 1.303 N and 1.12 N for trim angles of 0°, 0.4°, 0.8° ,and 1.2°, respectively.
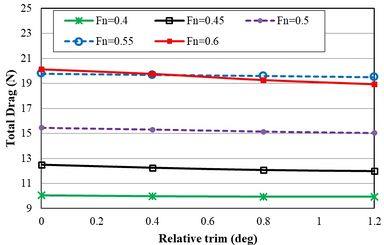
Figure 16 shows the effect of relative trim angle on the total resistance of vessel at different Froude numbers and trim angles. The effect of the trim angle on the performance of the main hull was very little. However, due to the contribution of side hull resistance to the total resistance of a trimaran vessel, the relative trim angle can indeed affect the total resistance. For Froude number 0.4, the vessel resistances were 5.033 N, 4.99 N, 4.98 N, and 4.98 N at trim angles of 0°, 0.4°, 0.8°, and 1.2°, respectively. This indicates that, for constant Froude number and speed, increasing the trim angle also increases the total resistance. For Froude number 0.6 and speed of 4.46 m/s, the vessel resistances were 10.065 N, 9.83 N, 9.637 N, and 9.47 N at trim angles of 0°, 0.4º, 0.8º, and 1.2º respectively, which showed a considerably less reduction than that of Froude number 0.5. With the increase of relative trim angle, the total resistance decreased at Froude number 0.4. Then, the total resistance remained constant at 9.96 N with a further increase in the trim angle. Therefore, it can be stated that the effect of increasing trim angle on the reduction of total resistance is only due to the reduction of the side hull resistance. So, the relative trim angle between the side hulls does not affect the main hull resistance, as it is constant for all conditions.
|
| Figure 16. The total resistance of the trimaran vessel at different Froude numbers and trim angles |
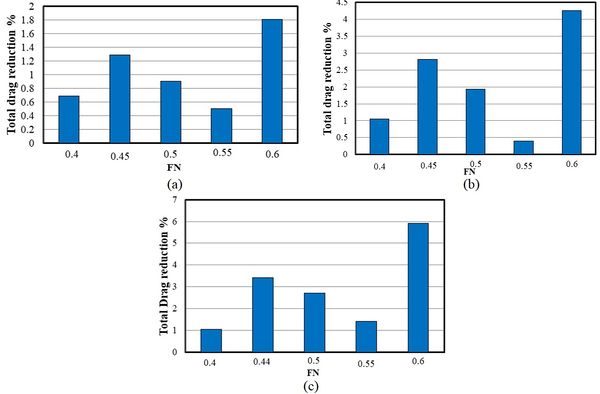
Figure 17 presents the effect of relative trim angle on the total resistance reduction at different speeds using Eq.(14). The total drag at 0 is the total resistive force or the vessel drag at the trim angle of 0°. In fact, the side and main hulls were included in the initial trim, while other drag forces were calculated separately at trim angles 0.4°, 0.8° and, 1.2°. The maximum reduction of side hull resistance occurred at relative trim angle of 0.4° and Froude number 0.4. It was also seen that the relative trim angle of 0.4° reduced the side hull resistance up to 10% at Froude number 0.6, while the side hull resistance was more than 17% of the total resistance for this Froude number. Therefore, a 10% reduction in side hull resistance at Froude number 0.4 led to a significant reduction (1.8%) in the total resistance. Although it is recommended to consider all these parameters to study the effects of relative trim angle of side hull on the total resistance of the vessel, this resistance reduction does not follow a specific pattern and shows different behaviors depending on the trim angle, flow spray, and draft
|
|
(14) |
|
| Figure 17. The effect of relative trim angle on reduction of total resistance (a) Trim angle of 0.4ᵒ (b) Trim angle of 0.8ᵒ (c) Trim angle of 1.2ᵒ |
3.4 Effect of heel angle on resistance
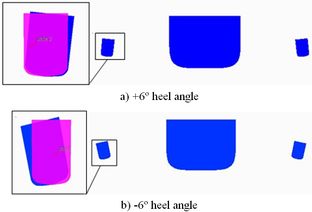
In this section, the effect of the heel angle of the side hull on the hydrodynamic characteristics of the trimaran was investigated. Results were obtained by changing the angle of the side hull around the x-axis. The effect of this feature on hydrodynamic characteristics of the trimaran was studied by changing the heel angle of the side hull constant draft, trim, and velocity. Table 6 shows the characteristics of the simulations. The direction of heel angle is considered positive (converge) while side hulls turn toward to main hulls, and it is negative (divergent) in reverse direction. Figure 18 shows the positive and negative angle of side hull. Pint color presents balance position of side hull.
| No. | Froude Number | Speed (m/s) | heel angle of main hull (ᵒ) | Draft(m) | hell angle of side hull (ᵒ) |
| 1 | 0.4 | 2.98 | 0.2 | 0.092 | 2- ، 4- ، 6- ، 2+ ، 4+ ، 6+ |
| 2 | 0.45 | 3.356 | 0.44 | 0.093 | 2- ، 4- ، 6- ، 2+ ، 4+ ، 6+ |
| 3 | 0.4 | 3.73 | 0.66 | 0.094 | 2- ، 4- ، 6- ، 2+ ، 4+ ، 6+ |
| 4 | 0.55 | 4.1 | 0.72 | 0.095 | 2- ، 4- ، 6- ، 2+ ، 4+ ، 6+ |
| 5 | 0.6 | 4.47 | 0.77 | 0.095 | 2- ، 4- ، 6- ،15-، 2+ ، 4+ ، 6+، 15+ |
|
| Figure 18. Rotation direction the of the side hull |
Figure 19 shows the resistance of the side hull at different heel angles. The resistance increased when the side hull is positioned at a negative angle. While, at positive heel angles, the resistance of the side hull was reduced initially and then increased at the heel angle of +6º. Negative heel angle was always associated with increased side hull resistance. While at positive heel angle trimaran showed different behavior and resistance was increased and then decreased from heel angle of 0º to +4º. Thus, at Froude number 0.4 and 0.45, float behavior was not constant and did not show a stable pattern at positive heel angles. However, in higher Froude numbers, side hull resistance showed more regular behavior. At Froude number 0.5, 0.55 and 0.6, resistance showed increasing trend at negative heel angles. This trend was the same as the trend seen at Froude numbers 0.4 and 0.45. Therefore, the resistance of the side hull was increase for all Froude numbers at negative heel angles. Furthermore, the resistance of side hulls, at the positive heel angles, was decreased as the heel angle increased. This issue can be used to reduce the resistance of trimaran at high speeds. Nevertheless, there is an inflection point at positive heel angles in Froude numbers 0.4 and 0.45 at low speeds. A large growth of the heel angle of the side hull may even lead to increase resistance at low speeds. To ensure the effectiveness of the heel angle in the predicted specifications, trimaran resistance also was obtained in -15º and +15º at Froude number 0.6 and it was seen the reduction of the side hull resistance at positive the heel angles.
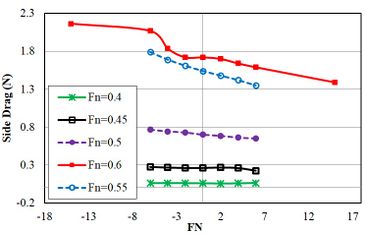
|
| Figure 19. The resistance of side hulls at different heel angles |
Figure 20 presents the total resistance of trimers in different Froude numbers and heel angles. In Froude number 0.4, the total resistance of trimaran enhanced with the increase of heel angle in the negative direction, while it was decreased at the heel angle of +2 and again reduced. Totally, the total resistance of trimaran was increased with the growth of heel angle in the negative direction. Except in Froude number 0.6, an increase of the heel angle at the positive direction led to the reduction of total resistance
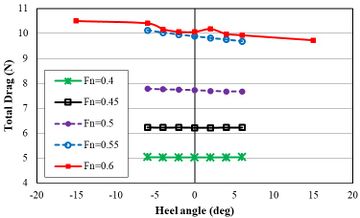
|
| Figure 20. The total resistance of the trimaran vessel at different Froude numbers and heel angles |
Figure 21 shows the effect of heel angle on the percentage of reduction in the total resistance of the trimaran at different Froude numbers using Eq.(16). The percentage of resistance was enhanced at negative heel angles with the increase of Froude number. In a Froude number 0.4, the total resistance of trimaran increased at just below 0.1% at the heel angle of -6º.However, at Froude number 0.55, the total resistance enhanced by 42.2% at same heel angle. At Froude number 0.5, it was seen the reduction of resistance at 0.64% at the heel angle of +6º
|
|
(16) |
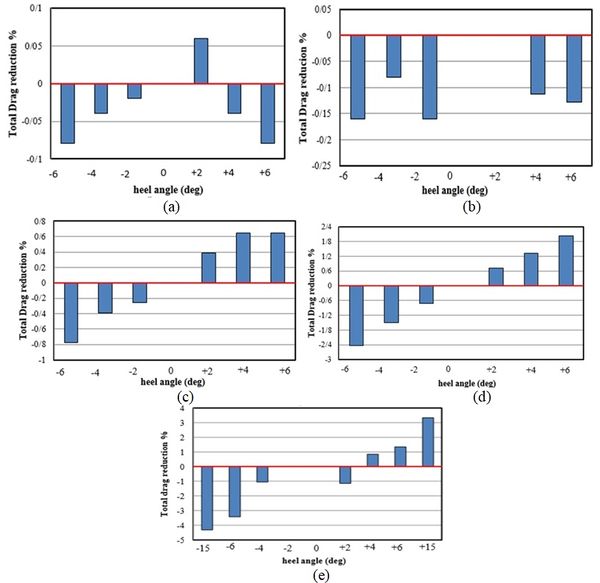
|
| Figure 21. The effect of heel angle on reduction of total resistance. (a) . (b) . (c) . (d) . (e) |
Table 7 shows critical conditions for each Froude number using obtained resistance results (due to heel angle) previously. Among all Froude numbers, heel angle of -6º had the greatest effect to increase the resistance of trimaran. The least resistance was seen for heel angles of +4ºand +6º. Heel angle of side hull showed the highest effect on the change of trimaran resistance at Froude number 0.55.
| Maximum reduction of
Resistance (%) |
Desirable heel angle
(Degree) |
Maximum Increased
Resistance (%) |
Undesirable heel angle
(Degree) |
Froude Number |
| 059/0 | 4+ | 79/0 | 6- و 6+ | 0.4 |
| - | - | 160/0 | 6- | 0.45 |
| 64/0 | 4- و 4+ | 776/0 | 6- | 0.5 |
| 33/12 | 6+ | 23/16 | 6- | 0.55 |
| 34/1 | 6+ | 42/3 | 6- | 0.6 |
3.5 The effect of relative yaw angle on the resistance of side hull
In this section, the effect of yaw angle was on the hydrodynamic characteristics of the trimaran was investigated in constant draft, trim and speed. The six different yaw angles were considered in both positive and negative directions around the z-axis of the side hull (Table 8). The trim and draft angles were considered based on previous studies [20]. The distance between the main hull and each side hull was 0.209. Six yaw angles were simulated in the directions of -6º, -4º, -2º, +2º, + 4º and +6º. The direction of rotation was around the vertical axis (z) through the center line of the side hull. Figure 22 shows positive and negative yaw angles.
| No. | Froude Number | Speed (m/s) | yaw angle of main hull (ᵒ) | Draft(m) | yaw angle of side hull (ᵒ) |
| 1 | 0.4 | 2.98 | 0.2 | 0.092 | 2- ، 4- ، 6- ، 2+ ، 4+ ، 6+ |
| 2 | 0.45 | 3.356 | 0.44 | 0.093 | 2- ، 4- ، 6- ، 2+ ، 4+ ، 6+ |
| 3 | 0.4 | 3.73 | 0.66 | 0.094 | 2- ، 4- ، 6- ، 2+ ، 4+ ، 6+ |
| 4 | 0.55 | 4.1 | 0.72 | 0.095 | 2- ، 4- ، 6- ، 2+ ، 4+ ، 6+ |
| 5 | 0.6 | 4.47 | 0.77 | 0.095 | 2- ، 4- ، 6- ، 2+ ، 4+ ، 6+ |

|
| Figure 22. Rotation direction of the side hull |
Figure 23 shows the resistance of side hulls in different Froude numbers and yaw angles. The resistance of the side hull was increased along the longitudinal axis at Froude numbers 0.4 and 0.45. Also, among all Froude numbers, the resistance of the side hull showed more growth at the yaw angle of +6º than other angles. The resistance of the side hull at the Froude numbers of 0.5 and 0.55 was initially reduced and then increased with the collapse of trimaran symmetry at negative yaw angles. Resistance was enhanced with the increase of yaw angles at positive directions. For Froude number 0.6, the resistance decreased at yaw angles of -4º and -2º however, it increased again at the yaw angle of -6º.
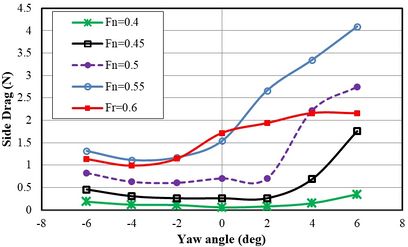
|
| Figure 23. The resistance of side hulls at different yaw angles |
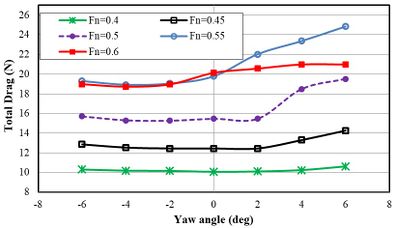
Figure 24 shows the total resistance of the trimaran in different Froude numbers and yaw angles. The total resistance was increased by creating the yaw angle at Froude number 0.4. This issue occurred at all yaw angles and hit the pick at the yaw angle of + 6º. Similarly, the total resistance of trimaran was increased at Froude number 0.45 and reached to the maximum at the yaw angle of +6º. At Froude number 0.5, the negative yaw angles did not show a significant effect on the total resistance of the trimaran, while total resistance was significantly increased at positive yaw angles. At Froude numbers 0.55 and 0.6, total resistance showed increasing trend at positive yaw angles from 0º to +6º.
|
| Figure 24. The total resistance of the trimaran vessel at different Froude numbers and yaw angles |
Table 9 shows the critical yaw angles side hull in different Froude number. Generally, the resistance of trimaran was significantly increased by creating the yaw angle of +6º in all Froude numbers. The highest total resistance was seen at Froude number 0.55. At the Froude number in 0.4 and 0.45, creating yaw angle of side hull did not decrease resistance. However, at higher speeds, the yaw angles of -4ºand -2º can reduce vessel resistance.
| Maximum reduction of Resistance (%) |
Desirable yaw angle (Degree) |
Maximum Increased Resistance (%) |
Undesirable yaw angle (Degree) |
Froude Number |
| - | - | 5/5 | +6 | 0.4 |
| - | - | 63/14 | +6 | 0.45 |
| 29/1 | -2 | 26/26 | +6 | 0.5 |
| 34/4 | -4 | 58/28 | +6 | 0.55 |
| 004/7 | -4 | 22/4 | +4 | 0.6 |
3.6 Wetted surface area
Figures 25 to 30 show the effect of the side hull trim angle on the wetted surface area of the vessel relative to the main hull at different Froude numbers. As shown in Figure 25, at Froude number 0.4 under normal conditions and with a trim angle of 0°, the side hulls had contact with water from their fore body and made white lines around the main hull. At the relative trim angle of 0.4°, the white lines (representing the contact surface with water) increased. Under these conditions, despite the constant flow spray, the aft body of the side hulls got closer to the water surface and was affected by the water spray. The wetted surface was 0.5 m2 at Froude number 0.4 and trim angle of 0°. The wetted surface decreased to 0.499 m2, 0.498 m2, and 0.497 m2 at trim angles of 0.4°, 0.8°, and 1.2°, respectively. In other words, the wetted surface can be reduced by increasing the trim angle at constant Froude number. For Froude number 0.45 (Figure 26), the highest value of wet surface (0.52 m2) was seen at trim angles of 0°. The wetted surface was 0.5183 m2, 0.518 m2, and 0.514 m2 at trim angles of 0.4º, 0.8º, and 1.2º, respectively. Similarly, for Froude number 0.5 (Figure 27), the highest value of wetted surface (0.53 m2) was seen at trim angles of 0°. The wetted surface was 0.528 m2, 0.5277 m2, and 0.5251 m2 at trim angles of 0.4º, 0.8º, and 1.2º, respectively. For Froude number 0.55 (Figure 28), the wetted surface showed 0.5953 m2, 0.592 m2, 0.5852 m2, and 0.5806 m2 at trim angles of 0º,0.4º, 0.8º, and 1.2º, respectively.As the trim angle was increased, the Froude number also increased as the wetted surface enlarged. For Froude number 0.6 (Figure 29), the wetted surfaces were 0.52 m2, 0.51994 m2, 0.51986 m2, and 0.51973 m2 at trim angles of 0°, 0.4°, 0.8°, and 1.2°, respectively.

|
| Figure 25. (a) Wetted surface at Froude number 0.4 and different relative trim angles. (b) Wetted surface of the trimaran at different trim angles |

|
| Figure 26. (a) Wetted surface at Froude number 0.45 and different relative trim angles. (b) Wetted surface of the trimaran at different trim angles |

|
| Figure 27. (a) Wetted surface at Froude number 0.5 and different relative trim angles. (b) Wetted surface of the trimaran at different trim angles |

|
| Figure 28. (a) Wetted surface at Froude number 0.55 and different relative trim angles. (b) Wetted surface of the trimaran at different trim angles |

|
| Figure 29. (a) Wetted surface at Froude number 0.6 and different relative trim angles. (b) Wetted surface of the trimaran at different trim angles |
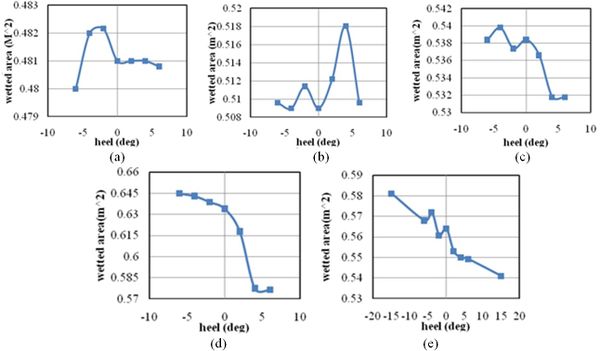
Figure 30 shows the free surface area at different Froude numbers and heel angles. At Froude number 0.4, the wetted surface area did not present significant difference at the negative and positive heel angles. The Wetted surface of side hull was increased only at +6º and -6º compared to the other heel angles. The wetted surface of side hull was slightly higher at heel angle of +6º than -6º. At Froude number 0.45, it was seen a 13.74% reduction in side hull resistance at the +6º. This is due to the fact that there is asymmetry of side hull in the form of flow spray. At Froude numbers 0.5 and 0.55, wetted surface showed considerably higher values at negative heel angles compared with positive ones. At Froude number 0.6, the wetted surface was decreased initially at negative heel angles and showed the lowest value at -6º. However, the wetted surface then increased gradually with the growth of heel angles in a negative direction.
|
| Figure 30. Wetted surface of trimaran at different heel angles (a) Froude number 0.4. (b) Froude number 0.45. (c) Froude number 0.5. (d) Froude number 0.55. (e) Froude number 0.6 |
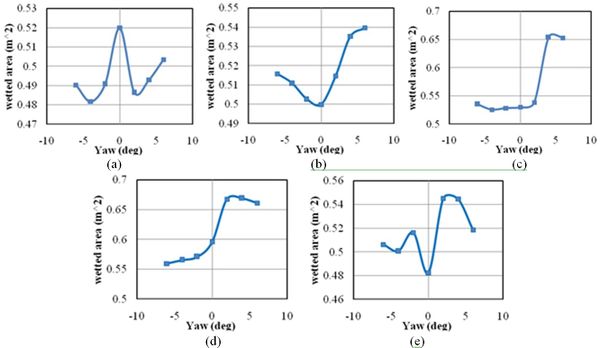
Figure 31 shows the wetted surface area of the trimaran in different yaw angles and Froude numbers. Generally, the wetted surface area was greater at the positive yaw angles. At Froude number 0.4, the highest level of the wetted surface was seen at the yaw angle of 0º. At Froude number 0.45, (b), it was seen an increasing trend in the wetted surface for both negative and positive yaw angles. However, the wetted surface was significantly higher at positive yaw angles. Similarly, at Froude numbers 0.5, 0.55, and 0.6, levels of the wetted surface were greater at positive yaw angles compared with negative ones.
|
| Figure 31. Wetted surface of the trimaran vessel at different yaw angles. (a) Froude number 0.4. (b) Froude number 0.45. (c) Froude number 0.5. (d) Froude number 0.55. (e) Froude number 0.6 |
3.7 Wave pattern
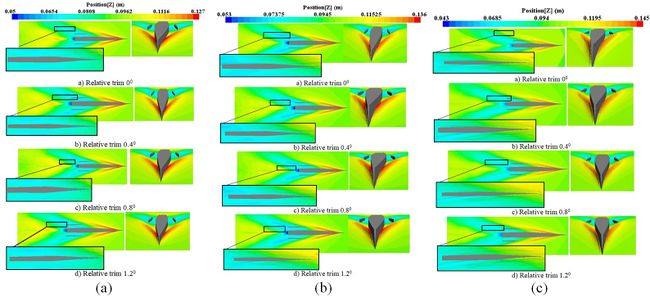
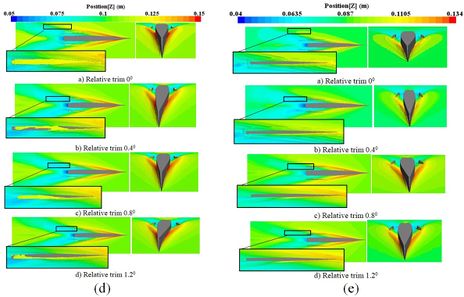
The wave pattern of a particle on the water surface consists of two types; transverse and divergent waves. The transverse wave has the greatest effect on the wave-making resistance. A wave pattern is made of a set of movable points on the surface of the hull, which is complex in terms of the presence of three hulls alongside each other and the interference of the waves. As shown in Figure 32, as the velocity is increased, the angle of the wave is reduced and the distance from the vessel point is seen to decrease. This leads to the collision of the wavepeak to the side hulls at high speeds. Thus, the collision of the crest of the wave with the side hull increases the hull resistance and generates a lot of sprays; however, at lower speeds, the peak of the wave does not have any contact with the side hulls. It is obvious from these results that increasing speed promotes wave elevation at the main vessel nose, which enhances wave resistance.
|
|
| Figure 32. The wave pattern around the trimaran at different relative trim angles. (a) Froude number 0.4. (b) Froude number 0.45. (c) Froude number 0.5. (d) Froude number 0.55. (e) Froude number 0.6 |
Figure 33 presents the wave pattern of the trimaran at Froude number 0.4 with the trim angles of 0°, 0.4°, 0.8°, and 1.2°, relative to the vessel length. The water height was measured relative to the coordinate axis, which was presented by the contour. For Froude number 0.4, the maximum wave elevation was 0.12 m at a trim angle of 0°, which was less than one-third of the main hull at the nose. The side hull had no effect on the generated waveform at Froude number 0.4. This was due to the separation of side hulls from the water surface at this Froude number. Therefore, the trim angle did not affect the shape of the generated waves for the same Froude number. For Froude number 0.45, trough point of the wave was located at the stern of the main hull. The blue region had a wave elevation of 0.07375 m to 0.0945 m. On the front part of the vessel (the area less than one-third of the vessel length is the orange-red spectrum) the wave ultimately reached a peak at height of 0.136 m. As the trim angle was increased, the front part of the side hull was in less contact with the water. For Froude number 0.5, the wave elevation was 0.043 m. The increase of trim angle resulted in the reduction of wetted surface. For Froude number 0.55, at trim angles of 0°, 0.4°, 0.8°, and 1.2°, the wave pattern increased, and the surface of the wetted deck reduced. For Froude number 0.6, at trim angles of 0°, 0.4°, 0.8°, and 1.2°, the wave pattern of the side hull was located in the yellow color spectrum, which indicated that increasing trim angle results in the reduction of the wetted surface. In the region of the blue spectrum, the wave elevation was 0.04 m and increased to 0.0635 m as it reached the front of the vessel. Ultimately, by increasing the speed, the effect of the trim angle was more prominent on the wave pattern generated by the side hull, so the wave pattern of the side hull was clearly visible at Froude number 0.6 and relative trim angle of 1.2°. However, for Froude number 0.4, the waves around the side hull and between the hulls were the same waves generated by the main hull.
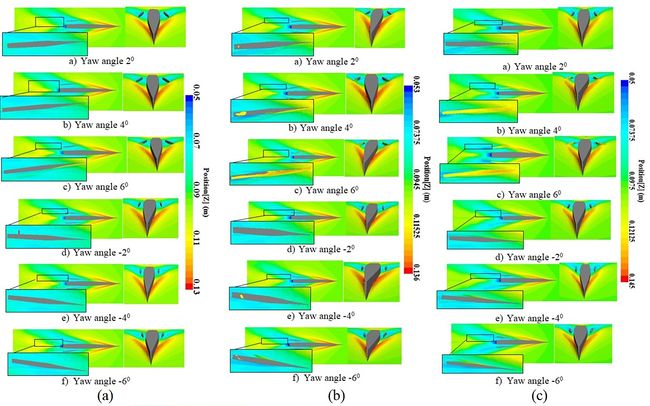
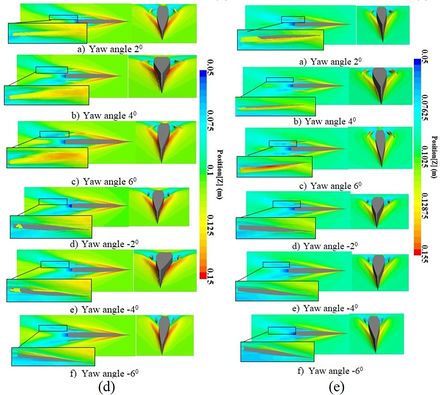
Figure 33 shows the wave pattern of the trimaran in different Froude numbers and yaw angles. For Froude number 0.4 and yaw angle of +2º, the side hull was still at the trough point of wave generated by the main hull. Then, with a further increase in the yaw angle to +4º, the nose of the side hull was located along the peak of the wave created by the main hull. With an increase of yaw angle to +6º, the wave pattern of the side hull appeared on the inner side of the inner hull. Therefore, with the increase in the height of the waves encountered on the nose of the side hull, the wave pattern of side hull is increased, and the wave pattern of side hull appear on the free surface between the side and main hull. This issue increases the resistance of trimaran. For Froude number 0.45, the peak of the wave encountered the nose of the side hull at the yaw angle of +2º. For yaw angle of- 6º, the wave pattern of side hull was formed in the non-adjacent part of the hull, and there was still trough of the wave in the inner half of the hull. For Froude number 0.5, it was seen a significant wetted surface at yaw angles of +4º and +6º, which leads to increase resistance considerably in these angles. As the speed increased, wetted surface of side hull started from yaw angle of +2º and it increased sharply as yaw angles enhanced in a positive direction.
|
|
| Figure 33. The wave pattern around the trimaran at different yaw angles. (a) Froude number 0.4. (b) Froude number 0.45. (c) Froude number 0.5. (d) Froude number 0.55. (e) Froude number 0.6 |
3.8 Free surface between the hulls
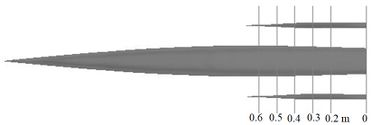
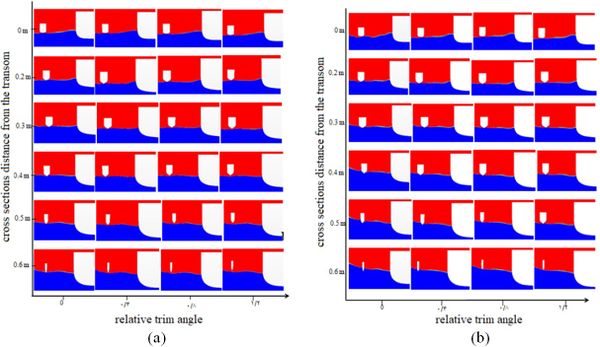
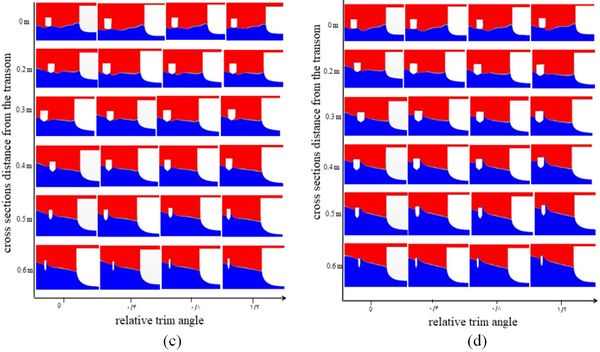
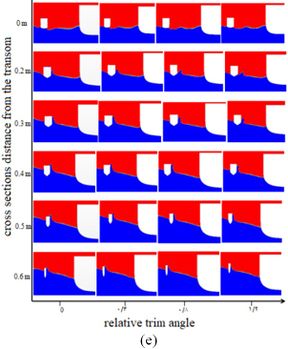
Since the length of the side hull is 0.697 m and the interaction between the two hulls is important, the authors examined the transverse position for six equal segments (Figure 34). The segments in each row and column were arranged by their distance from the transom and the relative trim angle. Figure 35 shows the effect of trim angle on the shape of free surface at different segments and speeds. At Froude number 0.4 and sections from 0 m to 0.2 m, the trim angle did not have a significant effect on the shape of the free surface. As the distance was increased from the transom, the inner part of the side hull was affected by the waves at the section of 0.3 m and trim angle of 0°. The bottom of the side hull was wetted at the inner half body. Due to the trim angle of the side hull, the water surface shape was changed at this section, so that the wetted surface of the side hull was in less contact with the encountering waves. This trend was seen repeated at the other sections such that the side hull was almost completely separated from the water surface at sections 0.4 m, 0.5 m, and 0.6 m and trim angle of 1.2°.
|
| Figure 34. Transverse position with six equal sections |
|
|
|
| Figure 35. Free surface between the hulls at different sections and trim angles. (a) Froude number 0.4. (b) Froude number 0.45. (c) Froude number 0.5. (d) Froude number 0.55 (e) Froude number 0.6 |
Similarly, for Froude number 0.45, the wave pattern (near the main hull) was not affected by the relative trim angle. Furthermore, from segment 0.2 m, the side hull surface receded from the water surface as the trim angle was increased. Reduction in the wetted surface area of the side hull in segments 0.4 m, 0.5 m, and 0.6 m was considerable. By increasing the trim angle from 0° to 1.2°, the wetted surface of the side hull was higher in the segments from 0 m to 0.2 m, while in segments 0.3 m, 0.4 m, 0.5 m, and 0.6 m, the wetted surface was decreased. For Froude number 0.5, there was no considerable change in water level for segment 0 at the trim angles 0°, 0.4°, 0.8° and 1.2°, while in segment 0.2 m, the side hull experienced higher water levels. The highest water level was seen in segments 0.3 m and 0.4 m, and this trend was seen to decrease in segments 0.5 m and 0.6 m. For Froude number 0.55 in segment 0, no changes were observed at the free surface of the two hulls with increase in the trim angle. However, in section 0.2 m, the water level did not increase with increasing trim angles. In segments 0.5 m and 0.6 m, the highest water level was observed for the trim angle of 0°. For Froude number 0.6, the water level increased for the trim angle of 0°, while the water level was the same for trim angles 0.4°, 0.8°, and 1.2°. In segment 0.3 m, the water level was higher for the trim angles 0° and 0.4° as compared to the other trim angles. In section 0.4 m, the deck was submerged under water for the trim angle 0º. In segments 0.5 m and 0.6m, the highest water level occurred at the nose of the side hull for the trim angle 0º. Essentially, by increasing the Froude number and vessel speed, the water level was found to increase for the trim angle 0º. The highest water level was seen for troude number 0.55.
4. Discussion
A trimaran is one of the several types of vessels that involves three thin bodies. In most cases, the hydrodynamic characteristics of the hulls of trimaran and catamaran are similar; however, the partial differences indicate higher performance for the trimaran [2]. Various analytical, laboratory and numerical methods have been used to investigate the hydrodynamic characteristics of these vessels. In the case of analytical methods, designers used mathematical formulas provided by previous researchers for their model. Existing mathematical relationships are generally discovered through laboratory experiments. In order to design vessel hulls, choosing suitable hull lines may reduce wave-making resistance. Thus, by reducing the wave-making resistance, the wetted surface increases. Proper hull shape and water line, hull positioning, and hull orientation all influence the interference of waves generated by the vessel. Many studies have been carried out on the longitudinal and transverse positioning of the side hull relative to the main hull. Furthermore, there have always been attempts to predict the optimal interference of the waves. Although many studies have investigated the behavior of trimarans, the effect of trim angle, yaw angle and heel angle of side hulls on the hydrodynamic behavior has not been properly addressed, hence, this is a call for further studies. In this study, the hydrodynamic behavior of a trimaran was investigated numerically using the Star-CCM software in calm water. In addition to the resistance, the contribution of each side hull to the total resistance and the wetted surface areas were investigated. Furthermore, the wave pattern around the hull was studied at different speeds. Finally, the free surfaces between the hulls were presented at different speeds and sections of the hull.
Besides the position of side hulls along the main hull in the most appropriate longitudinal and transverse location, the angles of their placement are also considerably important. These angles can be changed relative to the main hull which affects the waveform. In this study, by changing the placement angle of the hull around the coordinate axes (x, y, and z), the effect of this parameter was investigated pertaining to waves and vessel behavior. The results showed that the side hull have no considerable effect on the resistance rate at low speeds. For low Froude numbers, the side hull was located at the bottom of the waves generated by the main hull. As the angular velocity increased, the angle of the generated waves was seen to reduce, whereas the peak of the waves generated by the main hull encountered the side hulls and consequently, the side hullwas wetted from the front part. Furthermore, as speed increased, the free surface between the hulls became more turbulent; however, it was relatively flat at lower speeds. Therefore, the effect of the trim angle of the side hull on the trimaran hydrodynamics was analyzed. Results showed that the resistance of the side hull decreased with the increase of trim angle. Besides, at all speeds, the total resistance of the vessel showed a decrease due to the growing trim angle of the side hull. It was seen that as the Froude number increased, the resistance of the trimaran also became prominent because of the relative trim angle of the side hull.
In this study, the effect of heel angle of side hull on the trimaran resistance was also investigated at different Froude numbers. Heel angles were arranged at -6º, -4º, -2º, +2º, + 4º and +6º. Results showed that at low Froude numbers, trimaran resistance does not follow the same pattern in each heel angle. For Froude numbers 0.5, 0.55 and 0.6, side hull resistance and total resistance was decreased at positive heel angles. Because in this situation, the outer half side of each hull is separated from the surface of the water and the lower surface is in contact with water. On the other hand, it was seen an increase of resistance at negative heel angles. Nevertheless, the designer should make the final decision about the proper configuration of side hulls, which is determined by the trimaran maneuvers requirements.
In addition, trimaran behavior was evaluated at different yaw angles of side hull in this study. Results proved that the resistance of the side hulls and the total resistance always increase at positive yaw angles. While at negative yaw angles, despite the increase of resistance at Froude numbers of less than 0.5, on higher speeds of trimaran resistance was decreased at higher speeds. From obtained results, it is highly recommended that designers avoid creating positive yaw angles. Furthermore, the use of negative yaw angles can reduce the resistance of trimaran and increase the speed.
As the trim angle increases, the vessel bream extended further from the water, and simultaneously, as the Froude number increased, the vessel was in less contact with water hence the causing the drop in resistance. A reduction trend of the wetted surface graph was also observed for different Froude numbers. For low Reynolds numbers, the flow is laminar and as speeds increases, it turns into a turbulent flow. Therefore, this study used the turbulent flow (the K-epsilon mode). There are two types of surface and volumetric forces in each element. Surface force is applied to the outer surface of the element and results in tensile, compression and shear stresses. However, volumetric forces affect all particles of an element. The gravitational force is a volumetric force. In this study, the elements in the computational domain were affected by gravity and were used to calculate the linear position of the regular wave (free surface).
The hull configuration and relative position of the hull relative to each other have a significant effect on the interference of the waves and the hydrodynamic behavior of the vessel. The longitudinal and transverse positions, and even the height of the side hulls, are significant to trimaran vessels. To this extent, the best configuration for proper hydrodynamic characteristics should be identified. A wide range of studies in the prediction of the behavior of vessels have been carried out using analytical methods and mathematical relations. Yanuar et al. investigated a trimaran with five Wigley hulls; a combination of with and without transoms [22]. The influence of the diverse position of side hull showed that the model with the non-transom stern gave beneficial resistance than the model with transom at high speeds. Sayeed et al. developed a non-linear time domain mathematical model for predicting the vertical motions of a planing hull in head waves [23]. The algorithm for predicting the planing motions and forces was based on a two-dimensional strip theory that can be run in real-time and fast mode. It was found that the method gave good predictions of heave and pitch motions in semi-planing and planing speed regions.
In this study, the stair of the hulls was neglected because the vessel form was smooth without stairs. This was because applying stairs and changing the hull angle at the same time made the analysis rather complicated. DashtiMansh et al. developed a computer program to evaluate the performance of a two-step flight vessel. Then, they calculated the strength and angle of the hull trim in calm water using the mathematical model [24]. Ackers et al. evaluated the effect of this parameter on vessel behavior by placing side hulls in the main and longitudinal positions [25]. Although the authors changed the transverse and longitudinal positions of the side hulls, they did not address the angle of rotation. However, in this study, the angle of rotation of the side hulls was particularly addressed. Dagiulli et al. investigated the effect of the hull configuration in the wave pattern generated by the vessel and measured the range of vessel motions under different conditions [26]. Although in the study, the wave pattern applied was not under experimental conditions, acceptable results were obtained numerically. Therefore, the degree of freedom of motion can be controlled in accordance with the modeling conditions for better analysis.
Brizzolara et al. and Min et al. investigated the effect of the hull configuration on the level of wave-making resistance using numerical methods [20, 27]. Dubrovsky compared the multi-hull and mono-hull vessels and concluded that all multi-hull ships are generally more seaworthy than their mono-hull counterparts [28]. Brizzolara et al. considered special positions for side hulls, while the current study was conducted at a specific point with rotation applied with respect to the side hull. Wave-making resistance at any angle and other hydrodynamic characteristics, such as the free surface were analyzed. Savitsky predicted the lift force, drag force, wetted surface, and the pressure center using experimental equations [29]. The equations are still used to predict the extent of the resistance of the flying vessels. Chen et al. calculated a mathematical equation for the wave-making resistance of trimaran and catamaran [30]. They optimized the hull configuration and introduced the best configuration with the lowest wave-making resistance using this equation. Tarafder et al. studied the catamaran vessel behavior using FEM [31]. Wang et al. and Xie et al. eliminated the fluctuations in the pressure distribution with the development of a low-pressure element method [32,33]. Mizine et al. modified the pseudo-linear theory to calculate the resistance of trimaran hull forms [34]. In this study, computational fluid dynamics equations and the Star-CCM software were used to determine the lift/drag forces and wetted surface, which delivered acceptable results in desirable time. In the present study, FVM was used for its computational domain whereby pressure and lift forces were obtained to ascertain the total drag force. Then, the hydrodynamic characteristics were calculated by changing the angle of side hulls.
The initial idea behind catamaran and trimaran was to reduce the wave-making resistance while retaining the advantage of good transverse balance and wide deck surfaces. Therefore, the total resistance can always be decreaeds by increasing frictional resistance due to the presence of several hulls in the opposite direction. The correct understanding of the wave-making resistance and the mode of optimal interference generated by the waves depended on a precise recognition of the waveform generated by the vessel. The total resistance of the vessel in calm water is divided into two groups depending on the Froude number and Reynolds number. For example, the wave-making resistance or residual resistance depends on the Froude number. In addition to this, the viscosity and frictional resistance are components of the Reynolds number. Thus, with regards to the dependence of each component of resistance on a dimensionless number, the model's resistance is generalized using the dimensionless number scale corresponding to the total resistance of the vessel.
Governing equations for the Star-CCM software included the Naiver-Stokes and continuity equations. These are some of the most important and applicable equations for hydrodynamic simulations. The proposed mathematical model can predict the movement of fluid particles and calculate the exact shape of the flow. In this study, a state equation was not used due to the assumption of incommensurable fluid. Furthermore, energy equations were not considered due to a constant temperature. Although the results were obtained numerically, it was not possible to apply the trim angle to the side hulls experimentally due to experimental limitations. The time variation of mass was considered zero due to the assumption of incompressible fluid with constant volume. To investigate the shape of the wave pattern, researchers have always used a generalized Kelvin wave pattern for different vessels. Zhang et al. investigated the interference of waves generated by a mono-hull vessel using the Kelvin wave pattern [5]. In the present study, for calm water, the effect of the wave conditions was avoided due to the huge volume of calculations; thus altogether reducing the analysis time. In addition to the volumetric forces, the surface forces imposed on each element were calculated at each step of time. The amount of force depended on the surface stress and the rate of strain of the fluid caused by the changes in the velocity of the fluid.
Different limitations were observed in this study. Due to the lack of angular configuration, if the analysis was carried out experimentally, the results would be more tangible. In the past, generally, the behavior of a vessel is evaluated experimentally in the laboratory. However, human error is inevitable in measuring the exact amount of quantities. Using computational software, human intervention during calculation of the problem was minimized. Therefore, the software analysis conditions were slightly different from the actual conditions of the fluid flow in a drainage basin. Furthermore, by comparison, a study on the behavior of any hull forms in real dimensions and a model for researchers who do not have laboratory access is simply impractical. Also, the present study did not investigate large trim angles applied to the side hulls. Water and air have complex interactions on the contact surface when the vessel is placed in water. This issue made it difficult to accurately determine the shape of the free surface. In this study, the mixture of water and air was used, which was as close to the free surface conditions.
5. Conclusion
This computational analysis represents a step in quantifying the role of the trim, yaw and heel angles of side hulls and velocity on the hydrodynamic characteristics of a trimaran in calm water. The worth of information from these analyses may express the importance of the factors that could reduce the total resistance of a trimaran. The study demonstrated that side hull resistance does not have significant effects on total resistance of a vessel at low velocities; however its effect is evident at high velocities. Despite the experimental limitations, the method used in the study and its results can be used by researchers and designers to configure the trim, yaw and heel angles of a trimaran side hull.
Acknowledgment
The authors wish to thank the research management unit of Universiti Teknologi MARA (UiTM) for providing funds no. 600-IRMI/FRGS 5/3 (189/2019) that made this research possible and also Universiti Sains Malaysia for supporting the study.
References
[1] Garland W.R., Class M.F. Stepped planning hull investigation. Transactions-Society of Naval Architects and Marine Engineers, 119:448-458, 2012.
[2] Yusefi R., Shfaghat R., Shakeri M. High speed hull drag reduction using tunnel. Ocean Engineering, 84:54-60, 2014.
[3] Lu X.P., Li Y., Dong Z.S. A research summary on high speed trimaran. J. Naval University of Engineering, 17(2):43-44, 2005.
[4] Dubrovsky V., Lyakhovitsky A. Mullty Hull Ships. Back Publishing, USA, 2001.
[5] Davis M.R., Holloway D.S. A comparison of the motions of trimarans, catamarans and mono-hulls. Aus. J Mechanical Engineering, 4(2):183-19, 2007.
[6] Zhang C., He J., Zhu Y., Yang C.J., Li W., Noblesse F. Interference effects on the Kelvin wake of a mono-hull ship represented via a continuous distribution of sources. European J Mechanics-B/Fluids. 51:27-36, 2015.
[7] Zhang C., He J., Zhu Y., Zou L., Li W., Noblesse F. Interference effects on the Kelvin wake of a catamaran represented via a hull-surface distribution of sources. European J Mechanics-B/Fluids. 56:1-12, 2016.
[8] Lu X.P., Pan Y.C. An investigation of wave resistance on the high speed trimarans and their piece hull position optimization. J. Hydrodynamics, 2004.
[9] Doctors L.J., Beck R.F. The separation of the flow past a transom stern. Proceedings of the First International Conference on Marine Research and Transportation (ICMRT ‘05), Naples, Italy, September 19-21, 2005.
[10] Maki K.J., Doctors L.J., Beck R.F., Troesch A.W. Transom-Stern flow for high-speed craft. Australian Journal of Mechanical Engineering, 3(2):191-199, 2006.
[11] Begovic E., Bertorello C., Cassella P. Calm water experimental research on geosims of high speed trimaran: hydrodynamic characteristics and model-ship correlation. Proceeding of 8th International Symposium on Practical Design of Ships and Other Floating Structures, Shanghai, China, 135-141, 2001.
[12] Tang H., Ren H., Li H., Zhong Q. Experimental investigation of wave-induced hydro elastic vibrations of trimaran in oblique irregular waves. Shock and Vibration.Doi.org/10.1155/2016/8794560, 2016.
[13] Savander B.R., Scorpio S.M., Taylor R.K. Steady hydrodynamic of planning surface. J. Ship Research, 46(4):248-279, 2002.
[14] Kohansal A.R., Ghassemi H. A numerical modeling of hydrodynamic characteristics of various planning hull forms. Ocean Engineering, 37(5):498-510, 2010.
[15] Kohansal A.R., Ghassemi H., Ghiasi M. Hydrodynamic characteristics of high speed planning hulls, including trim effects. Turkish J. Engineering and Environmental Sciences, 34(3):155-170, 2011.
[16] Wang X.L., Hu J.J., Geng Y.C., Xu C. Experimental investigation of wave induced loads of a trimaran. In Proceedings of the Conference of China Steel Structure Association on Marine Steel Structure Branch, Luoyang, China 47-54, 2010.
[17] Hu J.J., Wang X.L., Zhang F., Xu C. Wave-induced loads forecast and design loads determine based on the model test of a trimaran. In Proceedings of the Conference of China Steel Structure Association on Marine Steel Structure Branch, Luoyang, China. 61-69, 2010.
[18] Deng R., Li C., Huang D., Zhou G. The effect of trimming and sinkage on the trimaran resistance calculation. Procedia Engineering, 126:327-331, 2015.
[19] Hampshire J., Erskine S., Halliday N., Arason M. Trimaran structural design and assessment. Design & Operation of Trimaran Ships, 55-61, 2004.
[20] Brizzolara S., Bruzzone D., Tincani E. Automatic optimization of a trimaran hull form configuration. International Conference on Fast Sea Transportation (FAST), Saint Petersburg, Russia, 136-145, 2005.
[21] Hafez K.A., El-Kot A.A. Comparative investigation of the stagger variation influence on the hydrodynamic interference of high speed trimaran. Alexandria Engineering J., 51(3):153-169, 2012.
[22] Yanuar Y., Sulistyawati W., Yones R.J., Mahardika S., Analysis of trimaran-pentamaran side hull location based on clearance and staggers with stern form variations E3S Web of Conferences. 67: 2018
[23] Sayeed T.M., Peng H., Veitch B., Billard R. Numerical simulation of fast rescue crafts in waves and its application in a training simulator. J. Ocean Technology, 8(4):41-63, 2013.
[24] Dashtimanesh A., Tavakoli S., Sahoo P. A simplified method to calculate trim and resistance of a two-stepped planning hull. Ships and Offshore Structures, 12:317-329, 2013.
[25] Ackers B.B., Michael T.J., OTredennick O.W., Landen H.C., Miller E.R., Sodowsky J.P., Andrews D. An investigation of the resistance characteristics of powered trimaran side-hull configurations. Transactions-Society of Naval Architects and Marine Engineers, 105:349-373, 1997.
[26] Dagiulli N., Werner A. Determination of optimum position of outriggers of trimaran regarding minimum wave pattern resistance, International Conference on Fast Sea Transportation (FAST), 7-10 October, Ischia, Italy, Proceedings of FAST 2003.
[27] Min X., Zhang S.L. A numerical study on side hull optimization for trimaran. J. Hydrodynamics, 23(2):265-272, 2011.
[28] Dubrovsky V.A. Multi-Hulls: Some new options as the result of science development. Brodogradnja. 61(2):142-152, 2010.
[29] Savitsky D. Hydrodynamic design of planning hulls. Marine technology, 1(1):71-95, 1964.
[30] Chen J.P., Zhu D.X., He S.L. Research on numerical prediction method for wave making resistance of catamaran/trimaran. Chuanbo Lixue/(J. Ship Mechanics), 10(2):23-29, 2006.
[31] Tarafder M.S., Suzuki K. Computation of wave-making resistance of a catamaran in deep water using a potential-based panel method. Ocean Engineering, 34(13):1892-1900, 2007.
[32] Wang X., Day A. Numerical instability in linearized planning problems. Int. J. Numerical Methods in Engineering, 70:840-875, 2007.
[33] Xie N., Vassalos D., Jasionowski A. A study of hydrodynamics of threedimensional. Ocean Engineering, 32:1539-1555, 2005.
[34] Mizine I., Amromin E., Crook L., Day W., Korpus R. High-speed trimaran drag: Numerical analysis and model tests. J. Ship Research, 48(3):248-259, 2004.
Nomenclature
CR: Residual Resistance Coefficient
CT: Total Resistance Coefficient
D: Drag (in general)
FN: Froude Number
LWL: Length Waterline
: Area wetted surface trimaran
: Area wetted surface main hull
: Area wetted surface side hull
: Form main hull coefficient
: Form side hull coefficient
: Frictional resistance main hull coefficient
: Frictional resistance side hull coefficient
: Length wetted surface main hull
: Length wetted surface main hull
: Wave making resistance side hull
: Wave making resistance side hull
: Confident residual trimaran
: Wave making resistance trimaran confident
R: Resistance (in general)
Rn: Reynolds Number
Re: Reynolds
U: Speed (Velocity)
X: Longitudinal Distance
Y: Transverse Distance
Z: Vertical Distance
: Water density
: Displacement
T: Draft
B: Breath
CB: Coefficient body
L/B: Length /breath
B/T: Breath /draft
Document information
Published on 19/06/19
Accepted on 17/06/19
Submitted on 22/04/19
Volume 35, Issue 2, 2019
DOI: 10.23967/j.rimni.2019.06.004
Licence: CC BY-NC-SA license
Share this document
Keywords
claim authorship
Are you one of the authors of this document?