Abstract
This paper presents a method for the automatic generation of a spatial architectural layout from a user-specified architectural program. The proposed approach binds a multi-agent topology finding system and an evolutionary optimization process. The former generates topology satisfied layouts for further optimization, while the latter focuses on refining the layouts to achieve predefined architectural criteria. The topology finding process narrows the search space and increases the performance in subsequent optimization. Results imply that the spatial layout modeling and the multi-floor topology are handled.
Keywords
Spatial allocation problem ; Layout planning ; Evolutionary strategy ; Multi-agent system ; Computer-aided architectural design
1. Introduction
Building layout design is regarded as one of the major tasks in architecture design. It determines the shapes, dimensions, and positions of internal building spaces to satisfy architectural criteria. This task becomes complicated for human designers when the topology relationships of rooms are complex. Thus, the automated design technique attracts significant attention because it may be a potential way for researchers to find novel solutions for spatial design or quickly plan complex architecture programs, such as hospitals, schools, and laboratories. The idea of introducing such a technique does not mean replacing architects, but rather developing powerful tools to find fast solutions, verify ideas, and choose the best tool for furthering design.
The automated layout design problem is referred to as a space allocation problem in the field of computer-aided architectural design. Various approaches represent architectural layouts as two-dimensional (2-D) geometries and multi-story buildings as the combination of multiple layers. Galle (1981) adopted a grid system for layout representation and proposed an approach to enumerate all arrangements of rooms within the grid. The exponential growth in the number of possible arrangements makes this approach infeasible. A similar grid-based strategy can be found in Rosenman (1996) , Lopes et al. (2010) , and Peng et al. (2014) . The methods adopted for layout generation are different in these approaches, which range from genetic algorithms (Rosenman, 1996 ) and procedural modeling (Lopes et al., 2010 ) to integer programming (Peng et al., 2014 ). The latter two have addressed the generation of multi-story building layouts, where vertical spaces, such as stair cases, were also involved. However, in Peng׳s approach, these spaces were manually positioned instead of optimized by computer. Another model widely used for layout representation is 2-D polygons. Michalek et al. (2002) represented rooms as 2-D rectangles and adopted mathematical optimization to decide the positions and the aspect ratios. Martin (2006) represented rooms as rectangles, and the positioning process in his approach was carried out by procedural modeling. Neither of these approaches addressed the multi-floor layout. Similar strategies can also be found in Goetschalckx and Irohara (2007) , Afrazeh et al. (2010) and Ramtin et al. (2010) . Doulgerakis (2007) generated internal layouts from the polygon that represents the boundary of the building. Rooms were generated by dividing the original polygon into small parts, and the division operations were encoded using genetic algorithms. Multi-floor layouts were addressed in this approach, but vertical spaces, such as a staircase and a two-floor-high living room, were not mentioned. Rodrigues et al ., 2013a ; Rodrigues et al ., 2013b ; Rodrigues et al ., 2013c ) and Merrell et al. (2010) also achieved the generation of multi-floor layouts. Staircases were addressed in the former, while other vertical spaces, such as two-floor-high living rooms, were addressed in the latter.
The above investigation indicates that discrete and continuous models are common for layout representation. Most approaches adopt a 2-D layout representation. Approaches that directly modify three-dimensional (3-D) spaces are rare. This trend may be explained by conventional and technical reasons. First, generated layouts represented by 2-D geometries can easily be converted into common architectural drawings. Second, 2-D computer graphics algorithms are stronger and faster than 3-D algorithms. Generating 2-D layouts is faster because the rooms in most buildings have the same height and can be directly extruded from the plan. However, such strategy may limit the solution space when designers intend to find novel combinations of building spaces. The strategy also encounters difficulties in dealing with situations such as multi-story buildings with different room heights or vertical rooms that cross several floors. Thus, we proposed an approach for spatial architectural layout design to directly modify architectural spaces. Our approach to the modeling of spatial layout improves the efficiency of topology finding. The major challenges of this work include (1) introducing a model for spatial layout representation, because few approaches directly modify architectural spaces, and (2) guaranteeing the efficiency of the program, because the number of possible arrangements in 3-D graphics is greater than that in 2-D ones. These challenges are tackled through the combination of a multi-agent system, which is inspired by Li (2012) , and an evolutionary strategy. The former enhances the latter by providing it with topology-satisfied layouts. The latter, which is based on a grid system, improves the layouts to satisfy user-specified architectural criteria.
2. Agent-based topology finding
Unlike other constraints involved in the design process, topology relationships are fundamental requirements for layout designs. Changes in the dimensions or shapes of rooms do not lead to unusable rooms. A certain degree of redundancy exists for the entire layout to accept such deviations. However, compared with improper sizes or shapes, the missing connections between rooms lead to incorrect topology relationships and are disastrous for the layout design. The chance of this outcome happening grows higher when the number of rooms increases. Moreover, starting with layouts that have proper topology relationships can narrow the search space and may improve the efficiency of the evolutionary process. Thus, the purpose of introducing the topology finding process is to reduce the probability of incorrect topology relationships that occur in the latter optimization process by providing it topologically satisfied layouts.
2.1. Agent model
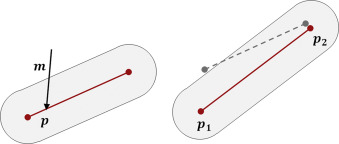
The topology finding process is implemented through a multi-agent system, where rooms are represented as bubble-like agents and connections as strings linking the agents. Bubble agents are divided into two types based on the type of room. Fig. 1 shows that the first type is a sphere-like agent that consists of a center point and a buffer distance. The second type is a capsule-like agent that consists of a segment and a buffer distance. Common rooms are represented as sphere-like agents and linear spaces, such as corridors, staircases, and rooms, which are represented as capsule-like agents across several floors. For horizontal capsule-like agents, the endpoints of their segments are affected by other agents. Thus, the endpoints can adjust their length and orientation automatically during the interaction between agents (Fig. 2 ). For vertical capsule-like agents, which usually represent staircases and tall rooms, the endpoints of its segment are locked and can only adjust their position, but not the length or the orientation.
|
|
|
Fig. 1. Left: sphere-like agent. Right: capsule-like agent. |
|
|
|
Fig. 2. Effect of the push operation on a horizontal capsule-like agent. |
The distance between agents is calculated according to their internal geometries. Sphere-like and capsule-like agents adopt point and segment as their internal geometries respectively. Thus, the distance between two sphere-like agents is equivalent to the distance between two points. The sphere–capsule distance and capsule–capsule distance can be calculated in a similar manner.
2.2. Interaction rules
Rules are defined to control the behavior of agents during the interaction process. They are implemented based on three operations defined below: move, push, and swap. The operations modify the positions and orientations of agents.
The move operation is defined as moving the internal geometry of agent along vector . For capsule-like agents, this operation simply moves the agent and does not change its length or orientation.
The push operation is defined as pushing the agent at point with vector , where locates on the internal geometry of the agent. For the sphere-like agent, the position is always located on its center point; thus, this operation is equivalent to . The vertical capsule-like agent also ignores the position because its endpoints are locked. For the horizontal capsule-like agent, the position may be located on any point on its internal segment. The vector in this case is divided into two, and the results are assigned to the segment׳s endpoints and . The division process can be described as
|
|
The endpoints move along different vectors, and the orientation and length of the agent may then be changed. Fig. 2 shows an example of this operation.
The swap operation swaps the positions of agents. The position of a sphere-like agent is the center point, and the position of a capsule-like agent is the midpoint of the segment. The z coordinate is ignored if a sphere-like agent needs to swap with a vertical capsule-like agent.
The rules can then be described as follows.
2.2.1. Attraction
For a pair of connected agents and , the call operations are and , where and are the closest points between the geometries of and , and is the vector heading from to . The length is positively related with the distance between and . This rule is applied to all connected agents in the system. In addition, every agent that represents the entrance is connected with an extra agent that represents the exterior space. This rule is also applied to the agents.
2.2.2. Repulsion
For a pair of unconnected agents, and are in the same level when the distance between them is less than the sum of their buffer distance, and the call push operation is and . The meanings of the parameters are the same as the meanings in the attraction rule, except that the length of vector is negatively related to the distance between and .
2.2.3. Swap
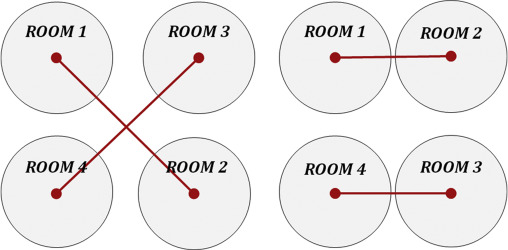
For any two pairs of connected agents that are at the same level, one agent from each pair is chosen if the connection strings intersect. The chosen agents are and . Thus, the call operation becomes . Fig. 3 shows an example of this rule. Rooms 2 and 3 are selected and swapped. Given that the intersections are likely to exist when the architectural program becomes complex, this rule avoids the invalid topology relationships caused by the intersections and ensures the robustness of the system.
|
|
|
Fig. 3. Swap operation between Rooms 2 and 4 avoids the incorrect topology caused by the intersection. |
2.2.4. Compression
This is an optional rule that may be involved if minimizing the volume of the entire building is necessary. The definition of this rule is that, for every agent , the call push operation is , where is the position of the agent, and is the magnitude that reduces by a specified reduction rate in each iteration. This rule compresses all the bubbles into a small group. The volume of the building may be relatively minimized when the system is stable.
Other informations, such as dimensions and heights, are ignored because the multi-agent system intends to generate topology-acceptable layouts for further optimization. The radius of the agents is the floor height multiplied by 0.5. Agents are randomly positioned at the beginning. As the program runs, connected rooms are dragged closer, and unconnected rooms push each other away if they are close enough. The entire system is stable in several iterations of running within just a few seconds. Layouts with acceptable topology relationships may then be provided. Fig. 4 shows an example of the running of the multi-agent system. The large white circle is the agent that represents the exterior space.
|
|
|
Fig. 4. Example of the multi-agent system. Left: initial status. Middle: status during the interaction. Right: stable status. |
3. Spatial layout optimization
The spatial layout generated by the multi-agent system is optimized through an evolutionary approach to satisfy architectural criteria. The multi-agent system represents rooms as points and segments and does not contain information such as volumes and shapes. The generated layout cannot be further optimized without conversion. Under the consideration of the diversity of results and the difficulty of implementation, we adopt a grid system for the conversion. The comparison between the grid (discrete) model and the continuous model will be in Section 5 . This optimization process continues running until it manually stops or all criteria are satisfied.
3.1. Grid-based model
The grid system defines a 3-D grid that contains number of cells with a size of . The size of the cell and the maximum number of cells are user defined and can cover the entire site. Rooms are represented as sets of continuous cells. Empty rooms and discontinuous cases (cells are contained by the same room and are not adjacent to one another) are considered as invalid and are discarded. Each cell owns an integer indicator that records the index of the room to which it belongs. Given that only one integer indicator is in each cell, multiple occupancy is not allowed, which means a cell cannot be shared by two or more rooms. Thus, changing the owner of a cell may have an effect on multiple rooms. Continuous and coplanar boundary cells form the surfaces of each room, which are referred to as faces. Vertical faces are regarded as potential walls, and horizontal faces are either the floor or ceiling according to their normal directions.
Similar to the half-edge data structure introduced by Muller and Preparata (1978) , faces record their owner׳s rooms and pair faces. This allows rooms to visit their neighbors without extra calculation. The number of pair faces a face can record is limited to 1. If a face is adjacent to multiple faces, it is divided into sub faces until each face corresponds to only one pair.
The conversion between the multi-agent layout and the grid system applies the principle of the Voronoi diagram. Cells are assigned to the closest agent on the current level according to the horizontal distance. Vertical capsule-like agents, such as stairs, can consume cells in different floors. This cell will not be assigned to any rooms if the closest agent of a cell is one of those extra agents that represent exterior spaces. This strategy ensures the connectivity between entrances and exterior spaces. An example of the conversion is shown in the left and middle images in Fig. 5 .
|
|
|
Fig. 5. Screenshots of the entire process. Left: generated multi-agent layout. Middle: converted grid system. Right: optimized grid system. |
3.2. Evolutionary optimization
Dillenburger et al. (2009) proposed the evolutionary approach adopted in this process. As opposed to the currently used optimization, multi-optimizations are discussed in Section 5 . The current layout in this approach is regarded as the parent and is replicated and mutated to become a child layout, which is then evaluated. If the child layout improves, it will replace the previous parent and become the new one; otherwise, it will discarded. If the child layout contains invalid rooms, empty rooms, or discontinuous rooms, it will also be discarded. The decision whether to keep a child layout is made by comparing the evaluation between child and parent layouts. The worse mutation is discarded. However, worse mutations may be accepted to escape the local maxima, especially when dealing with a complex architectural program. The probability of this case is controlled by the difference of evaluation results and a user-assigned constant, which anneals over time (White, 1984 ). This probability is calculated as follows.
|
|
where and are the parent and child layouts respectively, is the evaluation function, and is the user-assigned constants. The result returned by is greater if the layout is worse.
The mutation is achieved by pushing the faces of rooms. A set of coplanar faces is randomly selected and pushed forward or backward random steps. Cells that are affected by the movement change their owners. If only one face is selected, this face may be divided into two, and only one divided face is pushed. After a push operation, all faces refresh their pair references. Fig. 6 illustrates a 2-D version of this process, where the middle face is selected and pushed toward the left for one step. Thus, the number of cells owned by the left room increases, whereas the number of the right decreases.
|
|
|
Fig. 6. 2-D illustration of the mutation. |
In addition to the local adjustment, the mutation may also contain global adjustment to explore the solution space more effectively. The global adjustment has a certain probability to randomly select and swap the position of rooms and thus alter the layout significantly. The results modify the layout in a way that can hardly be achieved by moving faces only. However, this adjustment is optional because an acceptable topology relationship has been determined by the multi-agent system.
3.3. Evaluators
The quality of the mutated layout is determined by the cost values returned by evaluators. Each evaluator corresponds to one architectural criterion, and the cost values are weighted summed. If the result is great, then the quality of the mutation is worse. One of the purposes of the research is to build a framework and test its effectiveness. Thus, only four criteria are adopted (topology, shape, dimension, and aspect ratio and building shape) despite the many criteria used in actual architecture design. Other requirements, such as climate, energy, and cultural issues, may be involved in the different implementations of the evaluator. Given that the evaluation result is calculated through the weighted sum of all cost values, the number of the evaluators is flexible, and new evaluators can be easily involved. The calculation can be expressed as
|
|
where is the layout being evaluated, denotes the evaluators corresponding to different criteria, and is the corresponding weights.
3.3.1. Topology
The circulations throughout the building are specified by the architectural program and represented as connections between rooms. The basic requirement for a connection to be possible is the existence of shared walls (vertical faces) between rooms. For vertical connections, shared floors and ceilings (horizontal faces) are also accepted. This evaluator is denoted as if the basic requirements are not satisfied; otherwise, according to additional requirements that are introduced, i.e., .
Several additional requirements exist according to the type of connection. First, for horizontal connections that should be passages, such as doors or opening walls, the upper bound of the vertical distance between floors of the connected rooms is defined. Cases that are greater than this value are penalized as the increase of cost. Second, passage connections require the dimension and shape of the shared faces. For door connections, at least one shared face should have enough length and height to accommodate a door. Cases that do not reach the requirements are also penalized. For opening wall connections, the minimum length of each shared face is not required, but the total length of all shared faces should meet the lower bound. Third, for those connections that are not passages, only the overall area of shared faces is required.
We denote additional requirements, such as the length and height of the shared faces, as the factors , where is the number of factors. All factors satisfy and are calculated. Through a binding function, these results are bound to a single value as the output of the evaluation. The principle of the binding is that the result should be 1 if any factor is 1 (meaning the worst), and the result can be 0 if all factors are 0 (meaning the best). The binding function is defined as
|
|
where and are different factors. If more than two factors are involved, then this function is called in an iterative way as follows:
|
|
3.3.2. Dimension
Rooms require different dimensions according to their functions. The desired dimension of each room, which is specified in the architectural program, contains both lower and upper bounds to maintain the flexibility of design. Cases that lie within the range are not penalized and receive an evaluation result of 0. The evaluation considers two factors: floor area and room height. They are also bound using the method mentioned above.
3.3.3. Shape
Rooms must be rectangular within a proper range of aspect ratio because rectangular rooms are widely accepted and considered comfortable and easier to use (Alexander, 1997 ). The proper aspect ratio for each room is specified in the architectural program and contains the lower and upper bounds. Major rooms, such as living room, bedroom, and garage, have strict requirements on their shapes. The requirement for secondary functions, such as corridors and hallways, are not as strict as the major rooms. Thus, each room is assigned a weight between 0 and 1 according to the function. Rectangularity is calculated through the quotient between the volume of the room and the volume of the room׳s envelop. Aspect ratio is determined through the envelop. The binding of these factors also adopts the method mentioned above.
3.3.4. Building shape
The design of the external shapes of buildings is flexible, whereas irregular buildings may consume extra energy. Thus, the entire building is evaluated through the quotient between its surface area and volume. Moreover, faces that head downwards are relatively difficult to build and may increase construction costs. Thus, the area of these faces is doubled during the calculation.
The designer may involve additional evaluators, such as the terrain, lighting condition, climate, and noise. The optimization process combines all the constraints by calculating the weighted summed result, and the solution is provided through the compromises between constraints.
4. Results
Several cases are provided for demonstration. The figures that show the layouts generated by the multi-agent system are captured from the screen. For illustration, the figures that show the optimized building layouts are rendered based on automatically generated 3-D models, without exterior walls or division into layers. The adopted architectural programs contain multiple floors and several cross-floor rooms and are manually encoded and written as an xml file. All cases are run on an Intel Core i7 clocked at 1.7 GHz with 8 GB memory. The program is written in JAVA 1.7 without multithread implementation.
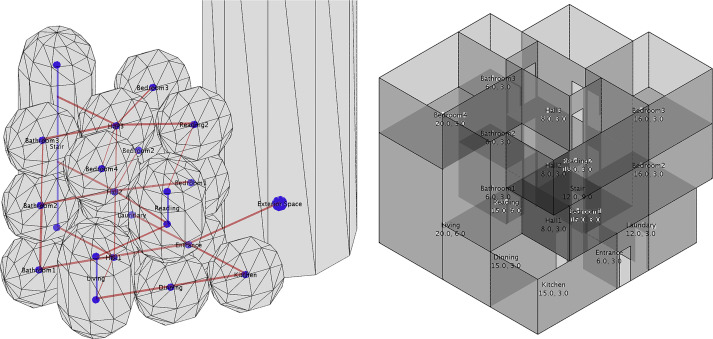
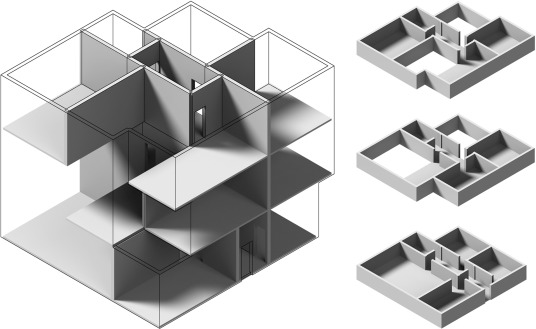
The first case is a three-level house that includes 17 rooms and 1 staircase. Three of its rooms in different floors are connected with one other, and two of them are two-floor high. For the considerations of pipeline distribution and structure stability, all the halls and bathrooms in different floors are required to be aligned. One of the results is shown in Fig. 7 ; Fig. 8 and implies that the proposed method performs well when dealing with cross-floor spaces. The room position generated by the multi-agent system is preserved in the optimized layout. The result satisfies the architectural criteria well, though few parts of the layout overhang.
|
|
|
Fig. 7. Left: generated topology relationships of the three-level houses. Blue points and lines show the internal geometries of bubbles, and red lines are connections between bubbles. Right: optimized grid-based layout. |
|
|
|
Fig. 8. Generated spatial layout based on the bubble diagram. The left image is rendered without an exterior wall, and the right images are separated into layers. |
Another case is a three-level office building that includes 1 staircase, 20 rooms, and 3 corridors. Half of the rooms are located on the first floor, and the other half are equally distributed on the second and third floors. This case aims to test corridors connected by a large number of rooms. Fig. 9 shows that the corridors are dragged by the rooms, extended, and shaped into capsules. A failure case exists on the first floor. Two rooms are collinear, and the outer one is blocked by the inner room. This error is fixed through the latter optimization process. However, it narrows the corridor and produces irregular architectural spaces (Fig. 10 ).
|
|
|
Fig. 9. Left: generated topology relationships of the office building. Agents marked in the red rectangle are failure cases. Right: optimized grid-based layout. |
|
|
|
Fig. 10. Generated layout of the office building rendered as separated layers. |
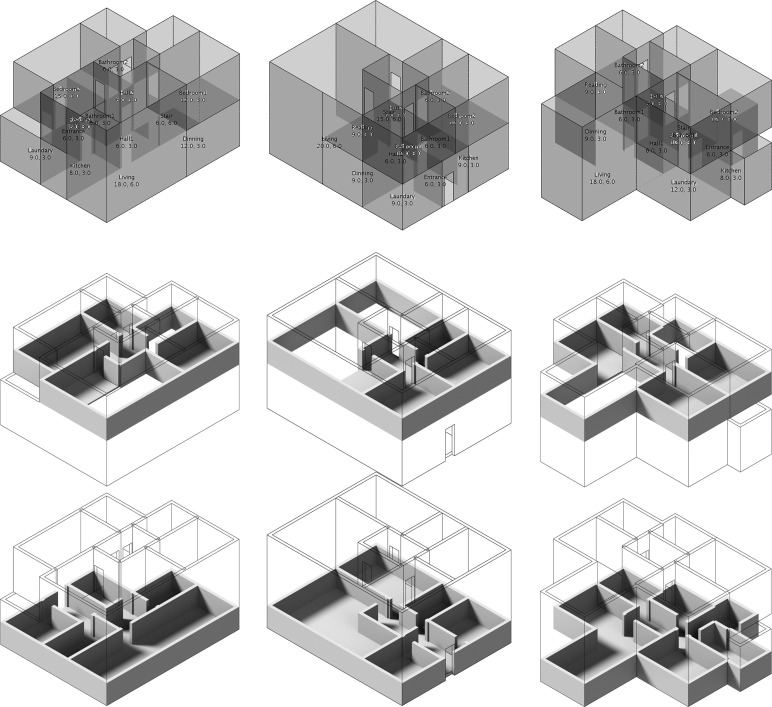
Fig. 11 shows three results generated from the same two-floor architectural program that contains 13 rooms. The variety of results implies that the automated layout optimization can assist architects during the conceptual design process by providing them numerous results within a short time.
|
|
|
Fig. 11. Generated layout from the same architectural program rendered as separated layers. |
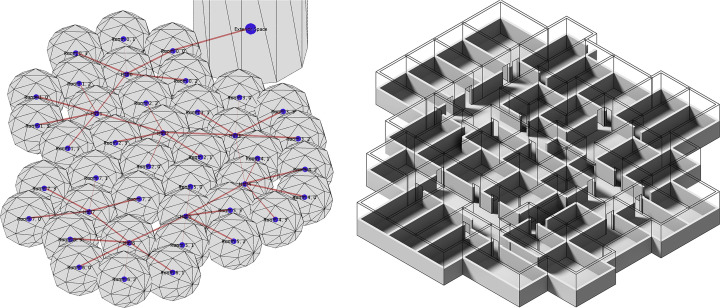
The three-level house takes about 5 min on average to generate the results. The office building takes about 15 min, while the two-level house only takes about 3 min on average. The time spent by the multi-agent system is also less than 30 s in all cases (Fig. 12 ).
|
|
|
Fig. 12. Generated layout that contains 40 rooms. |
5. Discussion and conclusion
The proposed method combines a multi-agent system and an evolutionary process. The latter operates on top of the topology founded by the former. The multi-agent system modeling the layout as points and lines makes it suitable to find topology for large and complex architectural programs. Moreover, it narrows the search space of the latter process and enables it to optimize 3-D layouts directly. This dual operation shortens the time cost by the optimization process, and thus more complex results may be produced within the same amount of time.
The model used by the evolutionary optimization is based on a 3-D grid system. This discrete model is easy to implement and does not require many calculations. For example, the volume of the room in the grid system can be determined by counting the number of cells. It can also generate layouts in different scales without numerous changes on time consumption by adjusting the resolution of the grid. Furthermore, grid-aligned layouts are easier to build because all their components have the same size. However, the grid system limits the solution space. For instance, non-orthogonal layouts are difficult to generate within one grid system, and curve-shaped rooms cannot be achieved within this model. An alternative for this is adopting a multiple grid system (Hua, 2012 ) or a non-orthogonal grid system (Peng et al., 2014 ) or using the continuous model instead of the discrete one. However, the continuous model requires much more complex calculations and sometimes strong Boolean operations, which are difficult to implement. The approach provided by Merrell et al. (2010) and Rodrigues et al ., 2013a ; Rodrigues et al ., 2013b ; Rodrigues et al ., 2013c is an example of adopting the continuous model in a 2-D layout design. The results of these approaches are still orthogonal.
The optimization adopts a simple evolutionary approach, where only one object is mutated and optimized. This approach is effective but may sometimes fall into local maxima. An alternative to this approach is the adoption of multi-optimization, such as the genetic algorithm. Assume the entire process is still the combination of a multi-agent system and an evolutionary optimization. Two possible approaches may apply the genetic algorithm into the latter process. The first one is that the integer indicator of the cells can be encoded as the gene, and the implementation of the crossover operation is not complicated. However, the crossover operation may easily produce discontinuous cases, which were mentioned in Section 3 , and result in a large number of invalid results. The second is that the sequence of the push operation may be encoded as the gene. The crossover may then be the testing of different combinations of push operations. This approach is inspired by the approach proposed by Rosenman (1996) and Doulgerakis (2007) . However, changing the sequence of the operations may cause the target faces to be unidentifiable because the positions and amount of the faces may change after each operation. Thus, a method to index faces must be developed.
Despite the issues discussed above, the proposed approach may be presented in many ways. One is the efficient approach for climate analysis, such as lighting condition and wind analysis, which is needed. These evaluations require complex calculations and greatly reduce the efficiency of the program. Another issue is that the architectural program may involve a concept of hierarchy, which means that rooms are divided into groups according to topology. The optimization process starts from organizing the positions of groups instead of rooms. After the group positions have been decided, the program modifies the rooms in each group. This step may reduce the difficulty of generating complex architectural layouts, such as hospitals and laboratories. Moreover, an interactive design process, especially during the multi-agent system, may be involved. The positions of the agents may be adjusted by architects in real-time. Thus, a powerful tool that assists the architects in the conceptual design process may be produced.
Acknowledgements
We are grateful to Dr. H. Hua for providing valuable references at the early stage of the research and Prof. P. Tang for her comments on the drafts of this paper. This research is funded by the National Natural Science Foundation of China (Grants 51478116 and 51538006 ).
References
- Afrazeh et al., 2010 A. Afrazeh, A. Keivani, L.N. Farahani; A new model for dynamic multi floor facility layout problem; Adv. Model Optim., 12 (2010), pp. 249–256
- Alexander, 1997 C. Alexander; A Pattern Language: Towns, Buildings and Construction; Oxford University Press, New York (1997)
- Dillenburger et al., 2009 Dillenburger, B., Braach, M., Hovestadt, L., 2009. Building design as an individual compromise between qualities and costs: a general approach for automated building generation under permanent cost and quality control. In: Proceedings of the Caadfutures: Joining Languages Cultures and Visions. 458–471.
- Doulgerakis, 2007 A. Doulgerakis; Genetic Programming + Unfolding Embryology in Automated Layout Planning (M.Sc. thesis); UCL, London (2007)
- Galle, 1981 P. Galle; An algorithm for exhaustive generation of building floor plans; Commun. ACM, 24 (12) (1981), pp. 813–825
- Goetschalckx and Irohara, 2007 M. Goetschalckx, T. Irohara; Efficient formulations for the multi-floor facility layout problem with elevators; Optim. Online (2007), pp. 1–23
- Hua, 2012 Hua, H., 2012. Decoupling grid and volume: a generative approach to architectural design. In: Proceedings of the 30th Education and Research in Computer Aided Architectural Design in Europe. Czech Technical University, Prague, Vol. 11, pp. 311–318.
- Li, 2012 B. Li; Architectural Generative Design: Searching for CAS-Based Methods of Generative Art in Architectural Design; Southeast University Press, Nanjing (2012), pp. 231–240
- Lopes et al., 2010 Lopes, R., Tutenel, T., Smelik, R.M., de Kraker, K.J., Bidarra, R., 2010. A constrained growth method for procedural floor plan generation. In: Proceedings of the 11th International Conference of Intelligence Games Simulation. pp. 13–20.
- Martin, 2006 Martin, J., 2006. Procedural house generation: a method for dynamically generating floor plans. In: Proceedings of the Poster Session, Symposium on Interactive 3D Graphics and Games.
- Merrell et al., 2010 P. Merrell, E. Schkufza, V. Koltun; Computer-generated residential building layouts; ACM Trans. Graph., 29 (6) (2010), pp. 181–192
- Michalek et al., 2002 J. Michalek, R. Choudhary, P. Papalambros; Architectural layout design optimization; Eng. Optim., 34 (5) (2002), pp. 461–484
- Muller and Preparata, 1978 D.E. Muller, F.P. Preparata; Finding the intersection of two convex polyhedra; Theor. Comput. Sci., 7 (2) (1978), pp. 217–236
- Peng et al., 2014 C.H. Peng, Y.L. Yang, P. Wonka; Computing layouts with deformable templates; ACM Trans. Graph, 33 (4) (2014), pp. 99–110
- Ramtin et al., 2010 Ramtin, F., Abolhasanpour, M., Hojabri, H., Hemmati, A., Jaafari, A. A., 2010. Optimal multi floor facility layout. In: Proceedings of the International Multi Conference of Engineers and Computer Scientists. Newswood Limited, Hong Kong, Vol. III, pp. 1797–1800.
- Rodrigues et al., 2013a E. Rodrigues, A.R. Gaspar, Á. Gomes; An approach to the multi-level space allocation problem in architecture using a hybrid evolutionary technique; Autom. Constr., 35 (2013), pp. 482–498
- Rodrigues et al., 2013b E. Rodrigues, A.R. Gaspar, Á. Gomes; An evolutionary strategy enhanced with a local search technique for the space allocation problem in architecture, Part 1: methodology; Comput.-Aided Des., 45 (5) (2013), pp. 887–897
- Rodrigues et al., 2013c E. Rodrigues, A.R. Gaspar, Á. Gomes; An evolutionary strategy enhanced with a local search technique for the space allocation problem in architecture, Part 2: validation and performance tests; Comput.-Aided Des., 45 (5) (2013), pp. 898–910
- Rosenman, 1996 M.A. Rosenman; The Generation of Form Using an Evolutionary Approach, Artificial Intelligence in Design; Springer, Netherlands (1996), pp. 643–662
- White, 1984 S.R. White; Concepts of scale in simulated annealing; Phys. VLSI, 122 (1) (1984), pp. 261–270
Document information
Published on 12/05/17
Submitted on 12/05/17
Licence: Other
Share this document
Keywords
claim authorship
Are you one of the authors of this document?

