Abstract
Wood frame walls typically need a vapour barrier at the warm side to avoid interstitial condensation due to vapour diffusion and air leakages from the interior. A more vapour open material than the traditional vapour barriers, here called vapour retarder, could allow condensed moisture, built-in-moisture or moisture from minor leakages to dry to the interior in addition to the outward drying. The application of permeable vapour retarders in wood frame walls have been investigated in this study by the use of a hygrothermal simulation tool. A traditional wood frame wall usually has good drying possibilities to the exterior. If a vapour retarder should have an effect on the total drying, it must not be too vapour tight. The purpose of this study was to find some threshold value for the maximum vapour resistance of a vapour retarder—when a requirement is that it should have a relatively large effect of the total drying of the wall. The increased risk for condensation as the vapour resistance decreases has however not been investigated in this study. In general it was found that permeable vapour barriers have relatively little effect on the total drying of ordinary wood frame walls in a Nordic climate.
Keywords
Vapour barrier ; Vapour retarder ; Wood frame wall ; Drying ; Moisture
1. Introduction
Wood frame walls typically need a vapour barrier at the warm side to avoid interstitial condensation due to vapour diffusion and air leakages from the interior. A vapour barrier such as a polyethylene foil do, however, not allow drying of moisture to the interior. A more vapour open material, here called vapour retarder , could allow condensed moisture, built-in-moisture or moisture from minor leakages to dry out to the interior in addition to the outward drying.
The term “vapour retarder” is somewhat undefined. The broadest definition could be that a vapour retarder is less vapour tight than the minimum recommendation for vapour barriers and more vapour tight than the maximum recommendation for wind barriers. According to Norwegian recommendations this would give the following range in vapour resistance for vapour retarders: 0.5 m<Sd, vapour retarder <10 m (Sd =equivalent air layer thickness). For North-American climate Listiburek (2002) defines vapour retarders to have the following range: 0.34 m<Sd, vapour retarder <3.4 m, i.e., vapour barriers are defined to have a vapour resistance Sd >3.4 m.
For many applications these definitions are probably too broad. With a vapour resistance close to a wind barrier the risk for condensation and mould growth may be high. And with a vapour resistance close to a vapour barrier the inward directed drying potential is probably too small for the product to meet its intended function.
Vapour retarders that are said to allow drying to the interior are now sold on the European market. These vapour retarders vary quite a lot in regard to their level of vapour resistance, typically Sd =2–10 m.
While a vapour retarder has a given constant vapour resistance, there are some vapour barriers sold on the European and North American market with adaptable vapour resistance in regard to what is actually needed. A popular term for these products are “smart” or “intelligent” vapour barriers. The physical behaviour of these products varies, but the main principle is that the vapour barrier should function as an ordinary vapour tight vapour barrier most of the time, preventing vapour diffusion into the construction from the indoor air. If, on the other hand, the construction is wet, for example due to built-in-moisture or leakages, so that the relative humidity (RH) on the exterior side of the vapour retarder gets high, the vapour resistance will be reduced so that there may be possibilities for drying inwards. One such product is for example claimed to have an Sd -value at approximately 4–5 m when the RH is below about 40% and Sd =0.1–0.2 when the RH is above 80% (Künzel, 1996 ).
The application of permeable vapour retarders in wood frame walls have been investigated in this study by the use of hygrothermal simulation tools. A traditional wood frame wall usually has good drying possibilities to the exterior. If a vapour retarder should have an effect on the total drying, it must not be too vapour tight. The purpose of this study was to find some threshold value for the maximum vapour resistance of a vapour retarder—when a requirement is that it should have a relatively large effect of the total drying of the wall. Only vapour retarders with constant vapour resistance have been part of this study, i.e., “smart” vapour barriers have not been included.
It is important to note that in this analysis we have only considered what the maximum vapour resistance of the vapour retarder should be, given that a relatively large proportion of the total drying should be directed inwards. We have not considered here whether the relatively low vapour resistance of the vapour retarder (Sd below 10 m, and possibly even below 2 m) has negative consequences for condensation and risk of mould growth, due to outward vapour transport from indoor air. The subject of the minimum acceptable vapour resistance on the warm side to avoid moisture problems has however been investigated in numerous other publications, and a review is given in Vinha (2007) .
2. Method
2.1. Hygrothermal simulations
The simulations were primarily carried out using WUFI 1D Pro 4 (WUFI, 2009 ). WUFI 1D Pro 4 is a simulation programme for coupled non-stationary, one-dimensional heat and moisture transport. The programme includes the moisture transport by vapour diffusion and capillary transport, and takes into account the moisture capacity of the materials.
In addition, some additional calculations were made with WUFI 2D-3, which in principle is the same model as WUFI 1D Pro 4, but which is two-dimensional.
All simulation cases applied to structures with high initial moisture content. Case A (Chapter 2.3) had the moisture content equivalent of an accidental water leak into the mineral wool, while Case B (Chapter 2.4) had a high level of built-in-moisture in the wooden members.
2.2. Basic input parameters
The so called Moisture Design Reference Year (MDRY) for Oslo in Norway was utilised as climate data. MDRYs are climate data on an hourly basis chosen to represent a moisture load that are more critical than the average climate. The annual mean temperature of the MDRY for Oslo is 6.4 °C, with lowest and highest monthly means of respectively—4.1 °C (February) and 18.2 °C (July). A northern orientation of the wall structures was selected. MDRY provides probably less drying inwards than the average climate, as an MDRY is generally a somewhat colder year than the average year. Correspondingly a northern orientation is likely to give less drying inwards than the other orientations, since a northern wall on an average is colder at the exterior than a wall that receives more solar radiation. However, a few extra simulations were also carried out for a south-facing wall with greater potential for inward drying.
The indoor temperature was set equal to 20 °C. The internal moisture excess was used as the measure of the level of indoor air humidity. Moisture excess is defined as the difference in water vapour content between indoor and outdoor air in g/m⊃3;. It is determined by the indoor moisture production and the ventilation level. By default, values of 2.5 g/m3 and 0.5 g/m3 were chosen for winter (outdoor temperatures below +5 °C) and summer conditions (outdoor temperatures above +15 °C) respectively, with linear interpolation for temperatures between 5 and 15 °C. This represents a level of humidity that is close to average levels in living rooms in Norwegian homes (Geving and Holme, 2012 ). It is also relatively beneficial in regard to inward drying—compared to a more humid indoor environment.
Simulation period went over 1 year, with the start time being 1 July. One year simulation period was chosen because pre-simulations revealed that the initial moisture content dried within one year. In general, the greatest inward drying occurs in the summer season. So these simulation cases start with a period of relatively high proportion of inward drying. Special attention is given to the first six months of the simulation, and the monthly average outdoor temperatures are given as follows: July (18.2 °C), Aug (16.5 °C), Sept (11.2 °C), Oct (6.3 °C), Nov (2.3 °C) and Dec (0 °C).
The air gap behind the wooden cladding was modelled with a ventilation source giving an air exchange rate of 20 1/h.
The most important material parameters used in the calculations were partially retrieved from WUFIs own database.
2.3. Case A
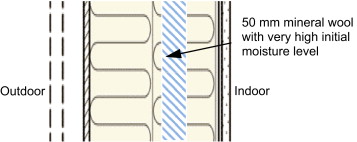
One-dimensional simulations were performed for a wood-frame wall with the following standard structure from the inside (see Figure 1 ):
- 12 mm gypsum board
- Vapour retarder (Sd ranges between 0.5 and 10 m)
- 250 mm mineral wool
- Wind barrier, roll product (Sd =0.1 m)
- Ventilated cladding (wooden cladding)
|
|
|
Figure 1. Wood frame wall (Case A)—vertical section. |
The simulations were carried out with high initial moisture content in parts of the mineral wool. Moisture equivalent to 10 mm water layer (i.e., 10 liters per m2 ) was distributed in 50 mm of the insulation layer located 50–100 mm from the vapour retarder (moisture content=200 kg/m3 , RH =100%). This should illustrate a random leak in the user phase. The closer the moisture is to the interior, the larger its percentage that will be able to dry to the interior. The chosen location was relatively beneficial in regard to inward drying, but an even more beneficial location would have been in contact with the vapour retarder. The rest of the insulation had an initial moisture level of 80% RH (relative humidity). An extra simulation was carried out with moisture located 50–100 mm from the wind barrier instead, which gives a lower percentage of inward drying.
The vapour resistance of the wind barrier naturally has great impact on the proportion of moisture that dry inwards. If the wind barier is relatively vapour tight a greater proportion of the moisture will naturally dry to the interior. It was therefore chosen to vary the vapour resistance within the range that is reccommended for wind barriers in Norway; i.e., Sd =0.01–0.5 m.
2.4. Case B
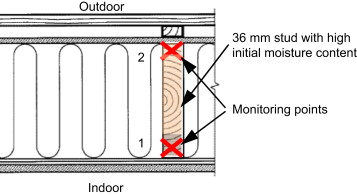
Two-dimensional simulations were performed for a wood-frame wall with the following standard structure (see Figure 2 ):
- 12 mm gypsum board
- Vapour retarder (Sd ranges between 0.5 and 10 m)
- 250 mm mineral wool+36 mm wooden studs cc 600 mm
- Wind barrier, roll product (Sd =0.1 m)
- Ventilated cladding (wooden cladding)
|
|
|
Figure 2. Wood frame wall (Case B)—horizontal section. |
The simulations were carried out with a high initial moisture content in the wooden studs starting at 25 wt%. The insulation had an initial moisture level of 80% RH.
The vapour resistance of the wind barrier was chosen to Sd =0.1 m, i.e., not the most vapour open or vapour tight product. In addition, two additional simulations wind barriers with Sd =0.5 m and Sd =0.01 m were carried out.
3. Results and discussion
3.1. General
The purpose of the simulations was to see if it was possible to find a maximum vapour resistance on the interior side of the construction, given that the inward drying shall be of such magnitude that it increases the speed of drying substantially. To assess this, we have chosen to look at the change in total moisture content of the construction (Case A) or change in moisture content of the wooden studs (Case B). In addition, we look at the relationship between the moisture flow (moisture flux) through the wind barrier and the vapour retarder. The moisture flux was monitored at the indoor surface and at the outer part of the wind barrier. Although the main drying would normally be outwards through the wind barrier, we must assume a relatively large percentage of the total drying (for example minimum 25%) to be inward directed for the vapour retarder to have a function.
The driving potential for the inward drying depends on the difference in water vapour pressure at the wetted insulation layer and the indoor air. If we for instance check the average conditions the first month (July) of the simulation, the hygrothermal conditions of the 50 mm wetted insulation layer and indoor air are respectively T ≈19.5 °C, RH =100%, pv ≈2265 Pa and T =20 °C, RH ≈65%, pv ≈1518 Pa. This gives a water vapour pressure gradient to the interior of approximately 747 Pa.
3.2. Case A
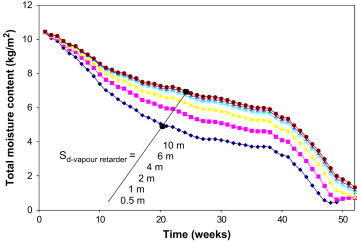
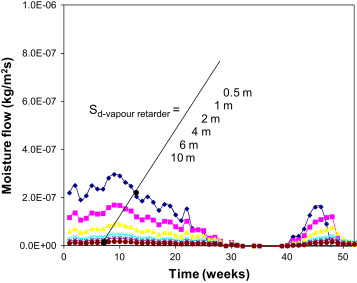
Some of the simulation results are shown in Figure 3 , Figure 4 ; Figure 5 . Figure 3 shows the total moisture content in the wood frame wall for different Sd -values of the vapour retarder (Sd-wind barrier =0.1 m). As expected we see that the lower the Sd -value of vapour retarder, the faster the drying of the construction. We see however that with Sd -values equal to 4, 6 and 10 m the drying speed differs very little from each other. This means that one has little effect on the drying by reducing the Sd -value from let us say 10 m (recommended minimum vapour resistance for vapour barriers in Norway) down to for example 4 m. For this simulation case it appears that the Sd -value must be below 2 m to get significant inward drying―and possibly all the way down to 1 m.
|
|
|
Figure 3. Total moisture content in wood frame wall for varying vapour resistances on warm side (Sd from 0.5 to 10 m). Sd -value of the wind barrier is 0.1 m. |
|
|
|
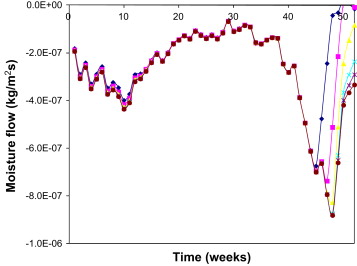
Figure 4. Outward moisture flow (negative flow is outwards) through the wind barrier for varying vapour resistances on warm side (Sd from 0.5 to 10 m). Sd -value of the wind barrier is 0.1 m (same coding of graphs as in Figure 3 ). |
|
|
|
Figure 5. Inward moisture flow (positive flow is inwards) through the vapour retarder for varying vapour resistances on warm side (Sd from 0.5 to 10 m). Sd -value of the wind barrier is 0.1 m. |
Figure 4 ; Figure 5 show the moisture flow through respectively the wind barrier (outward flow) and the vapour retarder (inward flow) for varying Sd -values of the vapour retarder. We see that outward moisture flow through the wind barrier is little affected by the Sd -value of the vapour retarder, and that it is substantially larger than the inward directed moisture flow—at least for higher Sd -values of the vapour retarder. We see from Figure 5 that the moisture flow directed to the interior air is very small for Sd -values on 4, 6 and 10 m. Similar to what we found from Figure 3 , it looks like one must have an Sd -value under 2 m to get noticeable drying to the interior, and probably down to 1 m.
Similar simulations were performed for a more vapour open (Sd =0.01 m) and a less vapour open (Sd =0.5 m) wind barrier. We find that the difference in drying speed by varying the Sd -value of the vapour retarder is small when the vapour resistance of the wind barrier is low and larger when the vapour resistance of the wind barrier is relatively high. This is as expected since the drying outwards will be less when the vapour resistance of the wind barrier increases, and thus the relative importance of drying inwards will increase.
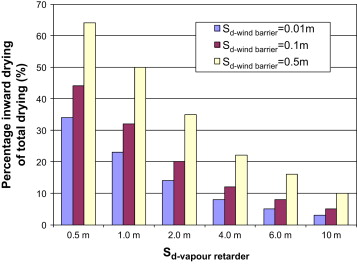
Figure 6 shows the relative proportion of inward drying by the total drying (inward+outward drying) of the construction by varying the vapour resistance of both the vapour retarder and the wind barrier. We see also here that the relative importance of inward drying increases when the vapour resistance of the wind barrier increases. We may for instance require of the vapour retarder function that a certain percentage of the total drying, for example 25%, should be inwards for the vapour retarder to have a proper function. With that assumption we see that with an Sd -value of the wind barrier of 0.01 m, 0.1 m and 0.5 m, the Sd -value of the vapour retarder should be lower than approximately 0.75 m, 1.5 m and 3.0 m respectively.
|
|
|
Figure 6. Relative proportion of inward drying by the total drying (inward+outward drying) of the construction by varying the vapour resistance of both the vapour retarder and the wind barrier. Calculated for average moisture flow during the first 6 months of the simulation period (1 July–31 December). |
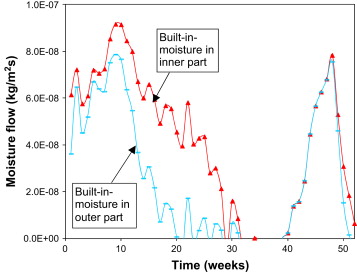
One of the other parameters that we know may have an effect is the location of the moisture. If the built-in-moisture/water leak is in the outer part of the thermal insulation a smaller percentage of the moisture will dry to the indoor air, compared with our previous simulations where we have assumed that the moisture is located in the inner part of the insulation. Figure 7 shows this effect clearly, where two cases with the moisture placed 50–100 mm from the vapour retarder (as shown in Figure 1 ) and the wind barrier are compared. Percentage inward drying of the total drying is halved (from 20% to 10% when we only take the first 6 months into consideration). This means, for example, that in order to maintain 25% share of the total drying the Sd -value of the vapour retarder must be reduced further compared to the values given above. Using Figure 6 as an example, to get doubling of the inward drying, we have to reduce the Sd -value of the vapour retarder from, for example, 2 m to 0.5 m.
|
|
|
Figure 7. Inward moisture flow through the vapour retarder for various locations of built-in-moisture in the construction. Sd, vapour retarder =2 m and Sd, wind barrier =0.1 m. |
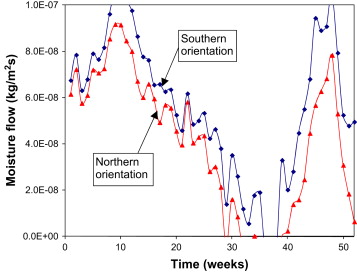
As we can observe from Figure 5 the main part of the drying to the interior air happens during the summer season. If the façade is exposed to solar radiation the outer part of the structure will have a higher average temperature, and thus the inward drying will probably increase. The simulations shown previously were carried out for a northern oriented façade, while Figure 8 shows comparative results for both a northern and a southern oriented façade. The southern oriented façade in this case has a very low air change rate behind the wooden cladding so as to maximise the effect of solar heating. We see that there is a certain effect, but it is not particularly large. Percentage inward drying of the total drying increases from 20% (northern orientation) to maximum 30% (southern orientation and reduced ventilation rate behind the wooden cladding) when we only take the first 6 months of the simulations into consideration.
|
|
|
Figure 8. Inward moisture flow through the vapour retarder for northern and southern orientations of the facade. Sd, vapour retarder =2 m and Sd, wind barrier =0.1 m. |
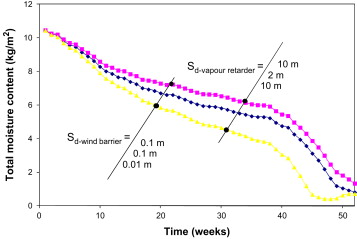
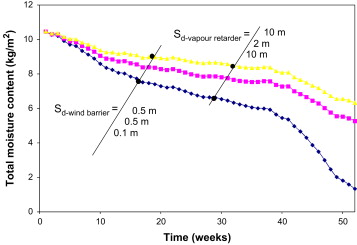
Regarding the efficiency of using a vapour retarder to dry out larger amounts of built-in-moisture, it must be assessed against the possiblity of using a more vapour open wind barrier. Figure 9 ; Figure 10 show the effect of either using a vapour retarder (reducing Sd -value on warm side from 10 m to 2 m) or using a more vapour open wind barrier (reducing Sd -value on cold side from 0.1 m to 0.01 m, or from 0.5 m to 0.1 m). We can see that using a more vapour open wind barrier is a substantially more effective measure, at least if we do not reduce the Sd -value of the vapour retarder significantly below 2 m.
|
|
|
Figure 9. Effect of using a vapour retarder versus a more vapour open wind barrier (Sd -value of wind barrier reduced from 0.1 m to 0.01 m) on the drying speed. |
|
|
|
Figure 10. Effect of using a vapour retarder versus a more vapour open wind barrier (Sd -value of wind barrier reduced from 0.5 m to 0.1 m) on the drying speed. |
3.3. Case B
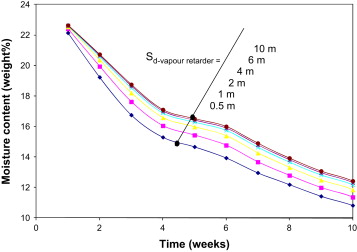
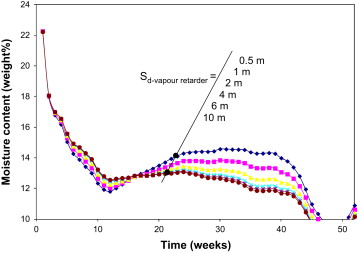
Some of the simulation results are shown in Figure 11 ; Figure 16 . Figure 11 shows the average moisture content in the innermost 50 mm of the wooden stud (monitoring point 1 in Figure 2 ) for a range of Sd -values of the vapour retarder. As expected we see that with lower Sd -value of the vapour retarder, the drying of the construction goes faster. We see however that with Sd -values equal to 2, 4, 6 and 10 m the drying speeds differ very little from each other. This means that one has little effect on the drying by reducing the Sd -value from let us say 10 m (reccommended minimum vapour resistance for vapour barriers in Norway) down to for example 2–4 m. For this simulation case it appears that the Sd -value must be below 1 m to get significant inward drying—and possibly all the way down to 0.5 m. It is worth noting that one still achieves relatively modest effect in regard to speed of drying. For example, it is only about 25% faster to dry down to less than 18 wt% (used as limit for mould growth) when a vapour retarder with Sd =0.5 m is utilised instead of a vapour barrier with Sd =10 m. When a vapour retarder with Sd =2 m is used instead of a vapour barrier with Sd =10 m the drying is only about 10% faster, or about 2 days faster, to get from 25 wt% to 18 wt%.
|
|
|
Figure 11. Average moisture content in the innermost 50 mm of the wooden stud (monitoring point 1 in Figure 2 ) for varying vapour resistances on warm side (Sd from 0.5 to 10 m). Sd, wind barrier =0.1 m. Here only the first 10 weeks of the simulation are shown; see Figure 12 for the full simulation period. |
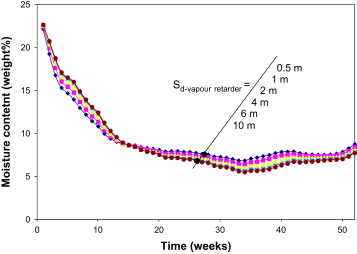
During the drying of the built-in-moisture the moisture content of the wooden parts are lowest for the most vapour open vapour retarders, as shown in Figure 11 . However, it is worth noticing that when the built-in-moisture has dried out, and the wood is returning to the natural moisture balance controlled by the indoor and outdoor environments, the moisture content will change to be higher, the lower the vapour resistance of the vapour retarder, as shown in Figure 12 . This is caused by the vapour pressure (and thus RH) within the wall which is increasing when the vapour resistance on the warm side decreases. When the built in moisture has dried, the net moisture flow through the vapour retarder will go from being directed to the interior to be outward directed.
|
|
|
Figure 12. Average moisture content in the innermost 50 mm of the wooden stud (monitoring point 1 in Figure 2 ) for varying vapour resistances on warm side (Sd from 0.5 to 10 m). Sd, wind barrier =0.1 m (similar figure as Figure 11 , but here the whole simulation period is shown). |
The drying of the outermost 50 mm of the wooden stud is shown in Figure 13 . Here we can see that the Sd -value of the vapour retarder has no effect in regard to drying speed down to 18 wt%. Only when the moisture content drops below 18 wt% there is an effect. Similarly for the inner part of the stud (Figure 12 ) we see that when the built-in-moisture has dried out and the wooden parts are tuning in on the natural moisture balance controlled by the indoor and outdoor environments, the moisture content will change to be higher, the lower the vapour resistance of the vapour retarder.
|
|
|
Figure 13. Average moisture content in the outermost 50 mm of the wooden stud (monitoring point 2 in Figure 2 ) for varying vapour resistances on warm side (Sd from 0.5 to 10 m). Sd, wind barrier =0.1 m. |
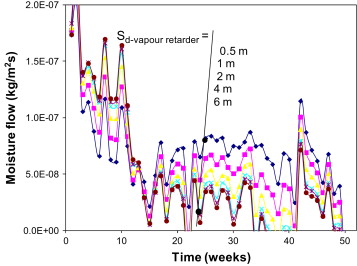
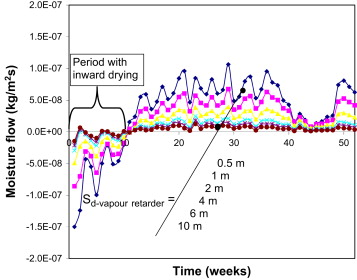
Figure 14 ; Figure 15 show the moisture flow through respectively the wind barrier (outward flow) and the vapour retarder (inward flow) for varying Sd -values of the vapour retarder. We see that outward moisture flow through the wind barrier is substantially larger than the inward directed moisture flow—at least for higher Sd -values of the vapour retarder. We also see that the outward directed moisture flow during the first 10 weeks (when the built-in-moisture is drying) is lower, the lower the vapour resistance of the vapour retarder. This is probably due to the fact that a larger portion of the moisture will dry to the interior. We see from Figure 15 that the moisture flow directed to the interior air is very small for Sd -values of 2, 4, 6 and 10 m. Similar to what we found when we analysed the moisture content in the inner part of the wooden stud in Figure 11 , it looks like one must have an Sd -value below 2 m to get noticeable drying to the interior, and probably down to 1 m. Figure 15 also shows that for the year as a whole more moisture will go from the indoor air out to the wall than from the wall to the indoor air.
|
|
|
Figure 14. Outward directed moisture flow (note: positive flow is outwards—opposite definition of case A) through the wind barrier for varying vapour resistances on warm side (Sd from 0.5 til 10 m). Sd -value of the wind barrier is 0.1 m. |
|
|
|
Figure 15. Inward moisture flow (note: negative flow is inwards—opposite of case A) through the vapour retarder for varying vapour resistances on warm side (Sd from 0.5 til 10 m). Sd -value of the wind barrier is 0.1 m. |
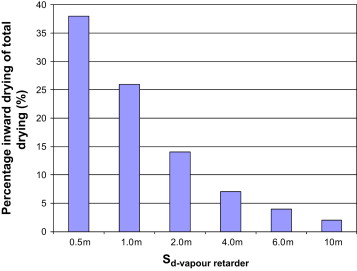
Figure 16 shows the relative proportion of inward drying by the total drying (inward+outward drying) of the construction for varying vapour resistances of the vapour retarder, during the first 10 weeks when there is inward directed drying. We may for instance require of the vapour retarder function that a certain percentage, for example 25%, should be directed inwards for the vapour retarder to have a proper function. With that assumption we see that with an Sd -value of the wind barrier of 0.1 m, the Sd -value of the vapour retarder should be lower than approximately 1.0 m.
|
|
|
Figure 16. Relative proportion of inward drying by the total drying (inward+outward drying) of the construction for varying vapour resistances of the vapour retarder. Calculated for average moisture flow during the first 10 weeks of the simulation period (1 July–10 September). |
4. Conclusions
A parameter study on the function of so called vapour retarders allowing drying inwards has been performed based on climatic data from Oslo in Norway. The purpose of the study was to see if it was possible to find a maximum vapour resistance on the interior side of the construction, given that the drying inwards shall be of such magnitude that it increases the speed of drying substantially.
It must however be noted that a precondition for drying to the interior is that the water vapour content of the indoor air is less than inside the wall. This means in practice that such products are only appropriate in buildings and rooms with relatively dry indoor air.
Modern wood frame structures in Nordic countries have usually relatively vapour open wind barriers, often with an Sd -value around and below 0.1 m. The simulations show clearly that the inward directed drying is modest in such constructions, since most of the moisture will dry outwards. To get an inward drying of some significance (25% or more of the total drying) the vapour resistance on the warm side must be pretty low, typically with an Sd -value lower than 1–2 m.
If the wind barrier is very vapour open (for example Sd <0.02 m) an even smaller percentage of the total drying will be inward directed. In order to maintain about 25% inward directed drying, the vapour resistance on the warm side must be reduced further, for example lower than Sd =0.75 m. On the contrary, a more vapour tight wind barrier (for example Sd =0.5 m) will only require a vapour resistance on the warm side lower than approximately Sd =3 m in order to maintain minimum 25% inward directed drying.
However, the study shows clearly that it is more effective to reduce the vapour resistance on the cold side than on the warm side, in order to improve the overall drying of built-in-moisture, accidental leaks and the like. For example, it is much more efficient to reduce the vapour resistance of the wind barrier from Sd =0.1 m to 0.01 m (or from Sd =0.5 m to 0.1 m), than to reduce the vapour resistance on the warm side from Sd =10 m to 2 m.
The main conclusion is that vapour retarders with constant vapour resistance have relatively minor usefulness in regard to increasing the drying speed in wood frame walls with modern wind barriers. However, if the wind barrier is more vapour tight than normal, for example by using an OSB-board, there could be a more useful value of such products. Either way, the Sd -value on the warm side has to be relatively low to achieve a certain proportion of inward drying, and this of course makes the construction more vulnerable to condensation and mould growth. The so called “intelligent” vapour barriers with adaptable vapour resistance may however be more useful in this context. In summer houses and cabins that are only heated for a smaller part of the year, the use of vapour retarders may on the other hand be more useful―since the percentage of inward drying will be higher if the indoor temperature is closer to the outdoor temperature.
It is important to note that in this analysis we have only considered what the maximum vapour resistance of the vapour retarder should be, given that a relatively large proportion of the total drying should be directed inwards. Low vapour resistance of the vapour retarder (Sd below 10 m, and possibly even below 2 m) may however have negative consequences for condensation and risk of mould growth, due to outward vapour transport from indoor air.
Acknowledgements
This study has been performed within the SINTEF strategic institute project “Climate Adapted Buildings”. The authors gratefully acknowledge the Research Council of Norway for funding of the project.
References
- Geving and Holme, 2012 S. Geving, J. Holme; Mean and diurnal indoor air humidity loads in residental buildings; Journal of Building Physics, 35 (4) (2012), pp. 392–421
- Künzel, 1996 Künzel, H.M., 1996. Humidity controlled vapour retarders reduce risk of moisture damages, in: Proceedings of the 4th Symposium on Building Physics in the Nordic Countries, Espoo, Finland, Sept 9–10, pp. 447–454.
- Listiburek, 2002 Listiburek, J., 2002. Moisture control for buildings. ASHRAE Journal, February 2002.
- Vinha, 2007 Vinha, J., 2007. Hygrothermal performance of timber framed external walls in Finnish climate conditions. A method for determining the sufficient water vapour resistance of the interior lining of a wall assembly. Ph.D.-Thesis. Publication 658, Tampere University of Technology, Finland.
- WUFI, 2009 WUFI, 2009. 〈http://www.wufi-pro.com〉.
Document information
Published on 12/05/17
Submitted on 12/05/17
Licence: Other
Share this document
Keywords
claim authorship
Are you one of the authors of this document?
