Abstract
Change related to climate in Macao was studied on the basis of daily temperature observations over the period 1901–2007. The result shows that annual mean surface air temperature in Macao as a whole rose with a warming rate of about 0.066 °C per 10 years in the recent 107 years. The most evident warming occurred in spring and winter. The interdecadal variations of the seasonal mean temperature in summer and winter appeared as a series of waves with a time scale of about 30 years and 60 years, respectively. The annual mean minimum temperature increased about twice as fast as the annual mean maximum temperature, resulting in a broad decline in the annual mean diurnal range. The interdecadal variations of annual mean maximum temperature are obviously different from those of annual mean minimum temperature. It appears that the increase in the annual mean maximum temperature in the recent 20 years may be part of slow climate fluctuations with a periodicity of about 60 years, whereas that in the annual mean minimum temperature appears to be the continuation of a long-term warming trend.
Keywords
surface air temperature change ; climate warming ; maximum temperature ; minimum temperature ; Macao
1. Introduction
Global climate change has become a subject of major concern for the international community. Many studies have been undertaken to examine the various facets of climate change, and some significant results were obtained. Recently, the Intergovernmental Panel on Climate Change (IPCC) concluded in its Fourth Assessment Report that in the recent 100 years (1906–2005), the global mean surface temperature (the mean of all near surface land and sea temperatures) rose by about 0.74 °C; the linear rate of increase in the recent 50 years was 0.3 °C per 10 years, approximately twice that in the past 100 years [ Qin et al., 2007 ]. In China, the trend in surface temperatures in the recent hundred years was found to be similar to that for the global/ Northern Hemisphere [ Ding and Dai, 1994 , Wang et al., 1998 , Lin et al., 1995 and Qian and Zhu, 2001 ], but the increase rates range from 0.2 to 0.8 °C per 100 years [ Zhao et al., 2005 ]. The scarcity of data in China in the first 50 years of the 20th century, and the different methods used by the various investigators to interpolate or reconstruct the missing data have been suggested to be some of the causes of these inconsistencies [ Zhao et al., 2005 ].
The causes of global warming are very complex. Solar, volcanic and anthropogenic activities had been proposed as some of the possible reasons for the warming experienced in China. Among the many anthropogenic factors, urbanization and the heat island effect are likely to be the most important [ Ren et al., 2005 ]. It has been pointed out that if the effects of urbanization were excluded, the rise in China’s mean surface temperature in the recent 54 years would be far less, about 0.15 °C per 10 years [ Ren et al., 2005 ]. It is very difficult to completely isolate the effect of urbanization from all the other factors influencing temperature rise. The traditional way to assess the contributions of urbanization is to compare temperature trends between urban and rural stations (i.e., “village” stations) using observations during the same period. However, because of the rapid urbanization in eastern China, it may be difficult for some studies already underway to have selected stations truly representative of the “village” conditions [ Ren et al., 2005 ].
Macao has a continuous meteorological record over a hundred years; this is very rare in south China and perhaps even in the whole China. Because of the unique geographical locations of Macao and its observing station, Macao’s observations are relatively unaffected by urbanization. This paper analyses the basic characteristics of Macao’s near surface temperatures recorded in the recent hundred years.
2. Data and Methodology
From the beginning of the 20th century to the 1920s, temperature observations in Macao were made 5 times a day (at 04:00, 10:00, 13:00, 16:00, 20:00 o’clock). Between the 1920s and the early 1950s, observations were made 3 times a day (at 09:00, 15:00 and 21:00 o’clock). From 1952 until today, observations were made every hour. The daily mean temperatures from 1952 onwards were calculated from the average of these hourly observations. The daily mean temperatures before 1952 were derived by linear regression in the following way. Using data between 1952 and 2000, a linear regression equation was constructed with the daily mean temperature as predictand, and the 3 times (at 09:00, 15:00 and 21:00 o’clock) or 5 times daily observations (at 04:00, 10:00, 13:00, 16:00, 20:00 o’clock) as well as the daily maximum and minimum temperatures as predictors. A linear regression equation was constructed for each month. The regression coefficients were tested with the F -test and found suitable to satisfy statistical significance requirements. The daily mean temperatures for the pre-1952 period were then inferred from the corresponding linear regression equations with the pre-1952 3 times or 5 times daily temperature observations as predictors. Using the 2001–2002 observations as a test case, it was found that with the daily maximum and minimum temperatures included as predictors, there was an improvement of some 0.3–0.4 °C in the daily mean temperatures estimated by linear regression when compared with those computed directly from the 3 times daily or 5 times daily observations. In addition, missing or erroneous observations in Macao’s records were filled or calibrated through linear regression with the observations from the Hong Kong Observatory.
Since its establishment, the site of Macao’s observing station has changed three times. Initially, between 1901 and 1903, this station was situated at Colina de Penha (Penha Hill, 22°11’20”N, 113°31’56”E, a.s.l. 55 m). In 1904, it was moved to Colina de Guia (Guia Hill, 22°11’45”N, 113°32’39”E, a.s.l. 65 m) where it remained till May 1966. The station was then relocated to Mount Fortress (22°12’57”N, 113°32’32”E, a.s.l. 57 m) where it stood till July 1996. Finally, in August 1996, the location of this observing station was moved to Taipa Grande (22°09’33”N, 113°34’08”E, a.s.l. 110 m) where it is now. The analysis of variations in the time series of the difference (DT) in annual mean temperature between Macao and Hong Kong revealed that there were no noticeable discontinuities before and after the first change in site in 1904 [the average DT before the relocation was 0.19 °C (1901–1903) and 0.15 °C (1904–1906)]. There were also no noticeable discontinuities of DT before and after the second and third relocations (Figure not shown). It would thus seem that temperature series has retained its homogeneity despite the three relocations.
3. Results
3.1. Variations in annual mean temperature
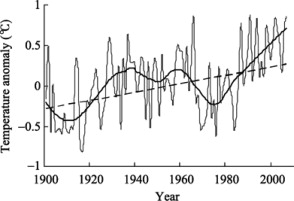
Figure 1 shows the annual mean temperature anomalies (difference between the annual mean temperature for each year and the 1961–1990 normal) for the period 1901–2007. It can be seen that in the recent 107 years, on the interdecadal scale these anomalies (the thick solid line) display a distinct pattern of 3 cooling and warming phases. The most noticeable cooling phases are in the first 10 years of the 20th century and in the 1970s. The third phase is in the 1950s albeit the cooling is less pronounced. The three warming phases are respectively in the 1930s–1940s, from the end of the 1950s to the mid-1960s and from the mid-1980s until 2007. However, the second warming phase (i.e., the period of obvious warming from the late 1950s to the mid-1960s) does not seem to be evident in the annual mean time series of surface temperature averaged over the whole world or over China [ Qin et al., 2007 and Zhao et al., 2005 ]. From the perspective of the positive anomalies, the start of the rise in temperature in the mid-1980s is broadly compatible with the historical warming trend, which is patently different from the global mean [ Qin et al., 2007 ].
|
|
|
Figure 1. Annual mean surface air temperature anomalies of Macao during 1901–2007 (relative to 1961–1990) (thin solid curve: temperature anomaly series; thick solid line: 41-point locally-weighted smoothing curve [ Cleveland, 1979 ]; dash line: linear trend) |
In the recent 107 years, Macao’s annual mean temperature has increased 0.71 °C, that is, a linear trend of 0.066 °C per 10 years. This is slightly lower than the trend in the global annual mean temperature (0.074 °C per 10 years) given in IPCC’s Fourth Assessment Report, but is only about half of that found for Hong Kong, which is 0.12 °C per 10 years [ HKO, 2008 ].
3.2. Variations in seasonal mean temperature
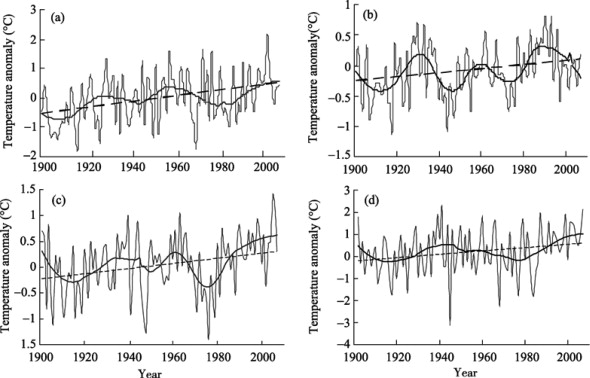
On the interdecadal time scale, the variations in the seasonal mean temperatures are quite different (Fig. 2 ). The linear trends for spring (March to May), summer (June to August), autumn (September to November) and winter (December and January to February) are respectively 0.097, 0.038, 0.050 and 0.075 °C per 10 years. It can be seen that the largest warming trend is found in spring. This is followed by winter and autumn, with summer as the smallest. In terms of interdecadal oscillations, for summer there is a distinct periodicity of 30 years, with 3 warming peaks near the years 1930, 1960, and 1990 (Fig. 2 b). From 1990s onwards, summer temperatures show a cooling trend. Winter temperatures exhibit a longer periodicity (about 60 years) with two warming peaks (Fig. 2 d). Thus, it seems that winter’s temperature rise in the recent 20 years may be a part of the slow and long-period (60 years) climate fluctuations. Similar to summer, on the interdecadal scale the warming in spring and autumn also features 3 warming peaks. However, for these two seasons the pattern in the recent 20 years is akin to that for winter, that is, a warming trend is apparent (Fig. 2 a, c). In addition, it can be seen that in the recent 20 years, the amounts of warming in all seasons are broadly consistent with historical trends. Qian and Zhu [2001] have pointed out that China’s annual mean temperatures recorded in the recent 100 years (1880–1998) contain periodicities of 20–30 years and 60–70 years. For Macao, these periodicities are the most marked in summer and winter, respectively.
|
|
|
Figure 2. Same as in Figure 1 , but for seasonal mean temperature of (a) spring, (b) summer, (c) autumn, and (d) winter |
3.3. Variations in the annual mean maximum, annual mean minimum temperature and diurnal range
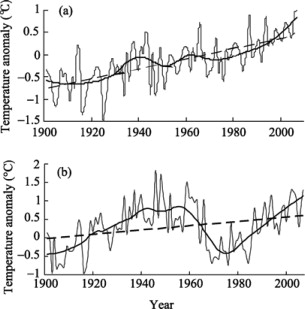
The annual mean minimum temperature anomalies are shown in Figure 3 a. It can be seen that the anomalies are mostly negative before the mid-1980s, and mostly positive after. By filtering with a 41-point locally-weighted smoothing, these anomalies are found to fluctuate narrowly about the trend line. The annual mean minimum temperature recorded in the recent 107 years is characterized by an undulating upward trend. The linear trend is approximately 0.11 °C per 10 years, almost twice that for the annual mean temperature (0.066 °C per 10 years).
|
|
|
Figure 3. Same as in Figure 1 , but for annual mean minimum (a) and maximum (b) temperature anomalies |
Figure 3 b shows the annual mean maximum temperature anomalies. Between 1920s and 1960s, these anomalies are mainly positive. Afterwards they turn negative, attaining a minimum in the mid-1970s before changing to positive again in the mid-1980s and continuing so till 2007. The annual mean maximum temperature has a linear trend of only 0.06 °C per 10 years, about half of that for the annual mean minimum temperature. From the point of view of magnitude and time span, the increase of temperature in the annual mean maximum temperature in the recent 20 years is broadly similar to that experienced in the last hundred years or so. For China, the interdecadal behaviour in its annual mean maximum temperature from 1951 to 2002 is much the same as in its annual mean minimum temperature [ Tang et al., 2005 ]. That is, the anomalies are basically negative before the mid-1980s, and positive (i.e., warming) after that. Obviously, distinct differences exist between the interdecadal variations of annual mean maximum temperature in Macao’s and whole China’s regional means.
From the above analysis, we can see that the interdecadal variations in Macao’s annual maximum temperatures (thick solid line of Fig. 3 b) are different from those in the annual mean minimum temperature (thick solid line of Fig. 3 a). The increase in the annual mean maximum temperatures in the recent 20 years appears to be part of the rising of slow climate fluctuations with a periodicity of about 60 years, while that in the annual mean minimum temperature appears to be the continuation of a long-term warming (nearly linear) trend. Similar conclusions have been reached by Klein et al. [2006] in their investigation of extreme temperature changes in Central Asia and South Asia.
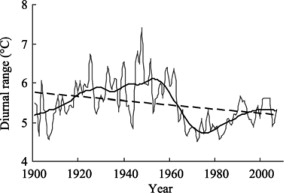
It is found that the interdecadal variations of diurnal temperature range in Macao are similar to those of annual mean maximum temperature. That is, there is a periodicity of about 60 years in the variations. The annual mean diurnal temperature range rose between the early 20th century and the mid-1950s. It began to fall from the late mid-1950s, reaching a minimum in the mid-1970s. Then it resumed an upward trend, but this trend appears to have levelled off in the recent 10 years (Fig. 4 ). Overall, Macao’s annual mean diurnal range is falling, at a rate of about 0.05 °C per 10 years. It has also been suggested that the global annual mean diurnal range is decreasing, but a recent study [Qin , 2007] has indicated that a little trend (i.e., a trend close to zero) can be detected in the data recorded during 1979–2004. Thus, it can be concluded that the pattern of Macao’s annual mean diurnal temperature range is noticeably different from the global mean and also from the mean for China as a whole.
|
|
|
Figure 4. Same as in Figure 1 , but for annual mean diurnal temperature range |
4. Discussion
Located on the western side of the Pearl River Estuary, Macao is comprised of the Macao Peninsula and the offshore islands in the south (Taipa and Coloane). As mentioned previously in this paper, between 1901 and May 1966 Macao’s observing station was first located on the southwest and then on the southeast side of two hills of Macao Peninsula. The station was moved to Mount Fortress in May 1966 where it remained till July 1996. At that time, there were very few tall buildings in Macao, and Mount Fortress towered above all other hills and structures all around. Thus, the observing station is able to receive unobstructed winds blowing onshore to Macao Peninsula from the sea. In August 1996, the observing station was moved to Taipa Grande on an offshore island (Taipa) in the south of Macao Peninsula. Taipa Grande is the highest hill on Taipa (a.s.l. 158.7 m). Sited half-way up the gentle eastern slope of Taipa Grand, the observing station overlooks approximately 500 m to its east mouth of the Pearl River Estuary where the Pearl River flows into the vast expanse of the South China Sea. With the observing station well exposed to the easterly winds blowing off the sea, Macao’s temperatures are modulated directly by sea breezes (the term is used here in the broad sense to mean all winds blowing from the sea). This may explain why Macao’s temperatures and temperature trends are lower than those found for the neighbouring Hong Kong (using the records at the Hong Kong Observatory headquarters) on the eastern side of the Pearl River Estuary.
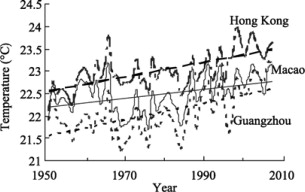
In the recent 20 or 30 years, the Pearl River Delta is an area in China which has undergone relatively rapid urbanization. Some primary observing stations in China, originally rural in nature, have become surrounded by concrete buildings and an urban environment. This is not the case for Macao. The heat island effect induced by urbanization has a considerable impact on the temperatures recorded at some of the primary observing stations in China. For example, it is estimated that approximately 32% of the total warming experienced in Guangzhou between 1973 and 2003 is attributable to the heat island effect [ Fan et al., 2005 ]. Figure 5 shows the series of the annual mean temperature in Hong Kong, Guangzhou and Macao in the recent 57 years (1951–2007). It can be seen that the variations in the temperature series for the three cities are generally in phase. However, the linear trends for the first two cities (0.19 °C and 0.17 °C per 10 years respectively) are much higher, by approximately 70%, than Macao’s (0.10 °C per 10 years). If one takes Macao as a reference station, then the rate of warming due to urbanization for Hong Kong and Guangzhou (in the last 57 years) are respectively 0.09 °C per 10 years and 0.07 °C per 10 years. This is in agreement with the trend (0.08 °C per 10 years) found by Leung et al. [2008] , with regard to the rate of warming for the effect of urbanization in Hong Kong. Thus, the above results show that in the study of the warming in cities in the Pearl River Delta region, Macao can be considered as a “rural” station. The patterns elicited from Macao’s temperature observations can thus be regarded as more truly representing the interdecadal evolving behaviour of large-scale climate change over the Pearl River Delta region in the last hundred years.
|
|
|
Figure 5. Annual mean surface air temperatures and their trends for 1951–2007 in Hong Kong (pecked line) and Guangzhou (dotted line) as well as Macao (solid line) |
Furthermore, it is worth noting that as Macao is located to the south of Guangzhou, generally Macao’s annual mean temperatures should be higher than Guangzhou’s. However, it seems Guangzhou’s annual mean temperatures have exceeded Macao’s since 2004 (Fig. 5 ). This signifies that heating due to the rapid urbanization in Guangzhou has overtaken latitude as the main factor in determining temperature difference in these two cities. This is a phenomenon deserving attention.
5. Conclusions
(1) From 1901 to 2007, Macao’s annual mean temperature has increased by 0.71 °C. The linear trend is 0.066 °C per 10 years, far lower than that of Hong Kong. The extent of the increase from the mid-1980s is broadly comparable to the historical increase. This is patently different from the global mean.
(2) There are also distinct differences among the patterns in the Macao’s annual mean seasonal temperatures. Spring was found to have the largest warming trend, followed by winter. Summer’s trend is the smallest. On the interdecadal time scale, summer’s annual mean temperature shows a series of three warming peaks, with an interdecadal periodicity of about 30 years. Moreover, summer’s annual mean temperature seems to be decreasing since the 1990s, while the warming experienced by winters in the recent 20 years or so appears to be part of slow climate fluctuations on a longer time scale (about 60 years).
(3) The linear trend for the annual mean maximum temperature is approximately half of that for the annual mean minimum temperature. The interdecadal variations in these two temperature series also show manifest differences. The annual mean maximum temperature is more in the nature of slow climate fluctuations, and the amount of warming from the mid-1980s onwards is generally compatible with the magnitude of historical warming. The temperature increase in the annual mean minimum temperature in the recent 20 years can be regarded as an extension of the long-term (warming) trend.
(4) The interdecadal variation in the annual mean diurnal range is akin to that found for the annual mean maximum temperature. On the whole, the trend is falling, but the recent 30 years appears to have seen an increase.
(5) The patterns elicited from Macao’s temperature observations may be regarded as more truly representing the interdecadal evolving behaviour of large-scale climate change over the Pearl River Delta region in the last hundred years.
Acknowledgements
The Hong Kong temperatures used in the study were provided by the Hong Kong Observatory. Data compilation for this paper was done in part by SMG colleagues Mr. Cheong Chin Chio, Mis. Chang Sau Wa, and Mr. Tang Iu Man. Their assistance is gratefully acknowledged.
References
- Cleveland, 1979 W.S. Cleveland; Robust locally weighted regression and smoothing scatter plots; J. Am. Stat. Assoc., 74 (1979), pp. 829–836
- Ding and Dai, 1994 Y. Ding, X. Dai; Temperature variation in China during the last 100 years; Journal of Meteorology (in Chinese), 20 (12) (1994), pp. 19–26
- Fan et al., 2005 S. Fan, J. Dong, L. Guo, et al.; A study on the urbanization effect on the temperature of Guangzhou city; Journal of Tropical Meteorology (in Chinese), 21 (6) (2005), pp. 623–627
- HKO, 2008 Hong Kong Oservatory (HKO); Climate change in Hong Kong (2008) Accessed http://www.weather.gov.hk/climate_change/climate_change_hk_c.htm#urban
- Klein Tank et al., 2006 A.M.G. Klein Tank, T.C. Peterson, D.A. Quadir, et al.; Changes in daily temperature and precipitation extremes in central and south Asia; J. Geophys. Res., 111 (2006) http://dx.doi.org/10.1029/2005JD006316 D16105
- Leung et al., 2008 Y.K. Leung, M.C. Wu, K.K. Yeung, et al.; Temperature projections for Hong Kong in the 21st century; Twenty-second session of meteorological science and technology seminars of Guangdong (in Chinese) (2008)
- Lin et al., 1995 X. Lin, S. Yu, G. Tang; Series of average air temperature for the last 100-year period; Chinese Journal of Atmospheric Sciences (in Chinese), 19 (5) (1995), pp. 525–534
- Qian and Zhu, 2001 W. Qian, Y. Zhu; Climate change in China from 1880–1998 and its impact on the environmental condition; Climatic Change, 50 (4) (2001), pp. 419–444
- Qin et al., 2007 D. Qin, Z. Chen, Y. Luo, et al.; Updated understanding of climate change sciences; Adv. Clim. Change Res. (in Chinese), 3 (2) (2007), pp. 63–73
- Ren et al., 2005 G. Ren, Z. Chu, Y. Zhou, et al.; Recent progresses in studies of regional temperature changes in China; Climatic and Environmental Research (in Chinese), 10 (4) (2005), pp. 701–716
- Tang et al., 2005 H. Tang, P. Zhai, Z. Wang; On change in mean maximum temperature, minimum temperature and diurnal range in China during 1951–2002; Climatic and Environmental Research (in Chinese), 10 (4) (2005), pp. 728–735
- Wang et al., 1998 S. Wang, J. Ye, D. Gong, et al.; Construction of mean annual temperature series for the last one hundred years in China; Quarterly Journal of Applied Meteorology (in Chinese), 9 (4) (1998), pp. 392–401
- Zhao et al., 2005 Z. Zhao, S. Wang, Y. Xu, et al.; Attribution of the 20th century climate warming in China; Climatic and Environmental Research (in Chinese), 10 (4) (2005), pp. 808–817
Document information
Published on 15/05/17
Submitted on 15/05/17
Licence: Other
Share this document
Keywords
claim authorship
Are you one of the authors of this document?
