Numerical Analysis of Axisymmetric Solids by the Finite Element Method: Use in Concrete, Steel and Mixed Steel-Concrete Elements
1 INTRODUCTION
According to Vicente and Oliveira (3) the term Finite Elements was used for the first time in literature in 1960 by Clough, in an Engineering paper on the application of plane elasticity, although the basic idea of the method was already being used by mathematicians, physicists and engineers for some years. Because of its simplicity, efficiency and good accuracy, the method became one of the main tools of structural analysis for obtaining displacements, stresses and strains in the domain and contour of structures in the last years.
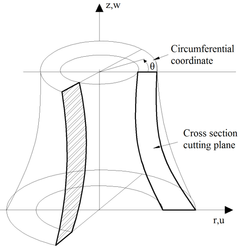
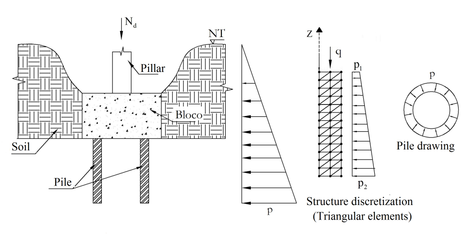
The objective of this paper is to present the numerical results of the implementation of a mathematical formulation based on the Finite Element Method for the analysis of axisymmetric structures characterized by a cross section with an axis of revolution (see Figure 1), under axisymmetric loading and with materials in linear elastic regime. Fortran 90/95 (1) programming language was used to implement this formulation which allows obtaining stress, strain and displacement values along the axisymmetric structure. Finite triangular elements with three nodes called CST (Constant Strain Triangle) were used to discretize the structure and as the FEM formulation adopted allows assessing stresses, strains and displacements only at the centroid of the element, a Lagrange polynomial interpolation was used to determine those magnitudes at the nodes of the elements or at any other point of the structure. It is worth to note that the implemented computer program was called Prograxisymmetric.
2 FORMULATION
Problems involving three-dimensional axisymmetric solids or solids of revolution under axisymmetric loading, can be reduced to simple two-dimensional problems. Due to the symmetry of the structure’s geometry and load around the z axis, all strains and stresses are independent from the rotation angle, θ. Therefore, the problem can be seen as two-dimensional in the plane rz, defined by the rotation area of the cross section as illustrated in Figure 1.
The axisymmetric solid under axisymmetric loading is subjected to radial (u) and axial (w) displacement and, due to axial symmetry, has circumferential displacement equal to zero. Thus, the displacement vector is given by:
|
|
(1) |
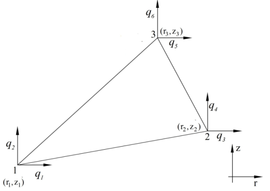
Therefore, a two-dimensional region defined by the rotation area of the axisymmetric solid is divided into triangular elements. These triangles, which altogether form the region under analysis are called elements and have 3 nodes and 2 degrees of freedom per node, one in the r direction and another in the z direction, as shown in Figure 2.
In turn, the nodal displacement vector at the nodes of the element is given by:
|
|
(2) |
where the components of the nodal displacement q1, q3and q5are in the r direction and q2, q4and q6in the z direction, as indicated in Figure 2.
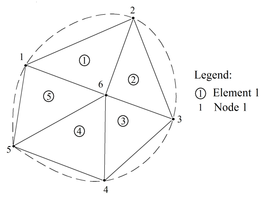
To exemplify, Figure 3 represents a discretized structure with 5 triangular elements and 6 nodes..
The connectivity or incidence indicates the nodes that represent each element of the discretized structure. To this end, we adopted the counterclockwise direction. Table 1 illustrates the connectivity of the elements of the discretized structure shown in Figure 3.
| Element connectivity | |||
| Element | Three nodes | ||
| 1 | 6 | 2 | 1 |
| 2 | 6 | 1 | 5 |
| 3 | 6 | 5 | 4 |
| 3 | 6 | 4 | 3 |
| 5 | 6 | 3 | 2 |
2.1 Discretization of Displacement Field
Displacements at the elements’ centroid can be calculated through the nodal displacements of the elements themselves and, to this end, in FEM, the shape functions are used, which in the case of CST elements are linear. The shape functions N1, N2and N3 correspond to nodes 1, 2 and 3 of the element. As an example, N1function assumes the unit value at node 1, and decreases linearly to the null value at nodes 2 and 3, defining a flat surface as indicated in Figure 4. Thus, as function of the natural coordinates ξ and η, the shape functions can be written as N1= ξ, N2= η and N3=1- ξ- η (5).
Using the shape functions N1, N2 and N3, the displacement vector (u) is defined from the nodal displacements of triangular element (q) as:
|
|
(3) |
where q is the nodal displacement vector (shown in Equation (2)), and N is a matrix of shape functions given by:
|
|
(4) |
Therefore, organizing Equations (2), (3) and (4) in matrix form, results:
|
|
(5) |
Coordinates r and z can also be represented in terms of natural coordinates using the same shape functions. This is the so-called isoparametric representation. Isoparametric representations relate Cartesian coordinates r and z with natural coordinates η and ξ. The isoparametric representations allow verifying that u, w, r and z are functions of η and ξ. Thus, they may be represented by:
|
|
(6) |
|
|
(7) |
Using the chain rule for derivatives of u and w, we obtain:
|
|
(8) |
|
|
(9) |
the square matrix (2x2)known as Jacobian of the transformation, thus:
|
|
(10) |
where the simplified indicial notation, represented by:
|
|
(11) |
|
(12) |
2.2 Discretization of Strain and Stress Fields
The stress vector can be represented by:
|
|
(13) |
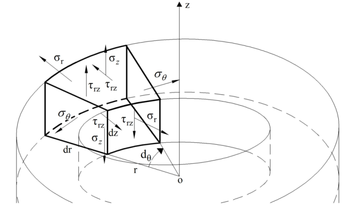
where , , and are, respectively, the radial, axial, tangential and circumferential stresses acting on an elemental volume as indicated in Figure 5.
Stress values must be calculated for each element, using the specific strain-element displacement relations, given in the usual form, as Bathe (4).
|
|
(14) |
where D, is the matrix that relates stress with strains represented by:
|
|
(15) |
Strains can be written as:
|
|
(16) |
where , , and are respectively, the radial, axial, tangential and circumferential strains.
Through mathematical manipulations of Equation (5) and calculating the partial derivatives of displacements u and w in relation to r and z, the strains can be written in the matrix form following Chandrupatla and Belegundu (5):
|
(17) |
or in compact form
|
|
(18) |
where the specific strain- displacement matrix of element (B), with 4x6 dimension, is given by
|
|
(19) |
and detJ is the determinant of the Jacobian matrix (J), shown in Equation (10).
2.3 Method of Potential Energy
The potential energy, , of an elastic body is defined as the sum of the internal strain energy (U) and the potential energy of the external forces (V), that is,
|
|
(20) |
where
|
|
(21) |
|
|
(22) |
|
|
(23) |
are, respectively, the body force, surface force and concentrated load vectors.
The strain energy of the element (Ue) can be obtained by substituting Equation (18) in the first parcel of Equation (20), and is given by:
|
|
(24) |
where the term within brackets is the stiffness matrix of element , that is,
|
|
(25) |
As a simple approximation, and r can be assessed at the centroid of the triangle and used as representative values for the triangle.
At the centroid of the triangle, we have that:
|
|
(26) |
|
|
(27) |
where is the distance from the centroid of the element to the z axis. Indicating as the specific strain- displacement matrix of the element assessed at the centroid, we have:
|
|
(28) |
or
|
|
(29) |
With the stiffness matrix and the nodal force vector F obtained according to equations previously shown, the vector of nodal displacements of structure is calculated by equation:
|
|
(30) |
Substituting Equation (18) in Equation (14), we obtain that the stress in each element is given by:
|
|
(31) |
2.4 Method for obtaining the stresses at the nodes of the elements
In this paper, according to the formulation previously presented, the stresses are calculated at the centroid of each triangular finite element. Aiming at determining the stresses at the nodes of the elements or at any other point of the structure, a Lagrange polynomial interpolation was used. Therefore, the polynomial function is represented as:
|
|
(32) |
By analogy, the stress at the nodes of each element may be calculated from:
|
|
(33) |
3 RESULTS AND DISCUSSIONS
In this section, the applications of the present study are shown. Four examples were analyzed, namely: a hollow sphere subjected to uniformly distributed radial load; a tube subjected to internal radial pressure; a concrete pile subjected to thrust along its shank and to nodal loading transferred from the foundation block to its top; and finally, a mixed steel-concrete pillar without steel armor subjected to surface load. The results obtained are compared to literature results and also with those determined using the ANSYS 17 (2) software.
3.1 Hollow sphere subjected to Uniformly Distributed Radial Load
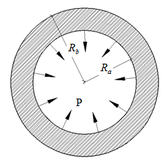
The hollow sphere considered in this application had an internal radius of 1m and an external radius of 2m, and was subjected to a negative unit pressure P inside, as shown in Figure 6.
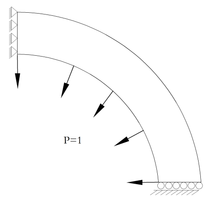
A sector of a sphere can represent a complete sphere when the displacement is restricted to the vertical axis. In this manner, the model used for the numerical analysis, as well as the contour conditions used are indicated in Figure 7.
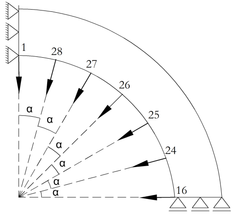
Figure 8 presents the nodal loadings acting inside the hollow sphere. These loads were decomposed as a function of the angles formed with the horizontal.
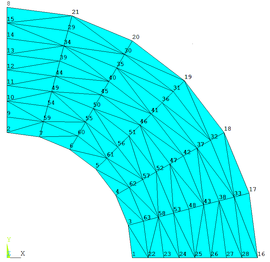
In this example, the domain was discretized with triangular finite elements with three nodes (CST) resulting in a mesh with 96 elements and 63 nodes as shown in Figures 9 and 10.
Aiming at checking the efficiency of the numerical implementations performed, the example was also modeled in the ANSYS 17 (2) program adopting the same mesh used in the analysis by Progaxisymmetric. Thus, a two-dimensional finite element with 3 nodes and 2 degrees of freedom per axisymmetric node called PLANE 182 was used to perform the analyses.
Table 2 and 3 present comparisons between the numerical solutions obtained from the computer program developed in this study and those obtained from ANSYS 17 (2) software.
| Displacement | ||||
| Node | Radius(m) | This study | ANSYS | This study/ANSYS |
| 22 | 1.125 | -0.559 | -0.564 | 0.990 |
| 24 | 1.375 | -0.454 | -0.460 | -0.988 |
| 26 | 1.625 | -0.407 | -0.413 | 0.985 |
| 28 | 1.875 | -0.391 | -0.937 | 0.980 |
| Tangential stress | |||
| Element | This study | ANSYS | This study/ANSYS |
| 96 | -0.610 | -0.616 | 0.990 |
| 93 | -0.434 | -0.439 | 0.987 |
| 92 | -0.378 | -0.383 | 0.986 |
| 90 | -0.317 | -0.322 | 0.985 |
| 87 | -0.265 | -0.270 | 0.982 |
| 85 | -0.239 | -0.244 | 0.981 |
| 84 | -0.225 | -0.229 | 0.981 |
| 82 | -0.208 | -0.212 | 0.981 |
It is noteworthy that the accuracy obtained by the numerical simulation is quite satisfactory.
In this example, the greatest percent differences obtained between the implemented code and the ANSYS 17 (2) software were 1.5% and 1.89%. Those responses correspond to the radial displacements obtained at the nodes and the tangential stresses analyzed in the elements.
It should be noted that the hollow sphere stresses were analyzed at the centroids of the discretized elements.
3.2 Hollow Cylinder Subjected to Internal Radial Pressure
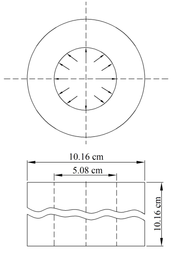
This example presents the results corresponding to an empty cylinder, previously analyzed by Timoshenko and Goodier (6), with E=20.77x10³kN/cm², ð=0.3, internal diameter 5.08cm and external diameter 10.16cm, length equal to 10.16cm and subjected to an internal pressure p=0.616kN/cm², as shown in Figure 11. In this application, the values of the maximum displacements in the piece were assessed and the values of the radial and the tangential stresses at the nodes of the finite elements at the points of maximum displacement were also calculated.
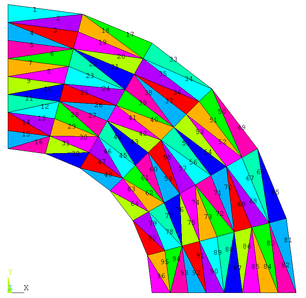
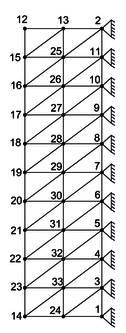
Figure 12 presents the structured mesh, composed by 40 finite elements and 33 nodes, as well as the contour conditions adopted to obtain the responses by Progaxisymmetric. It must be emphasized that this is the same finite element mesh presented in the literature.

|
|
Figure 12: Finite element mesh (element enumeration) and contour conditions (node enumeration) –
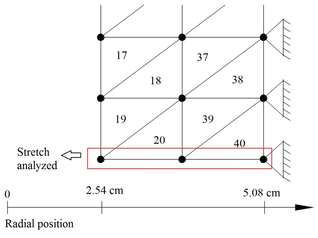
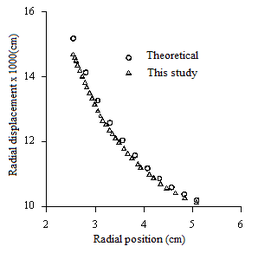
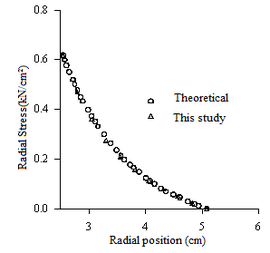
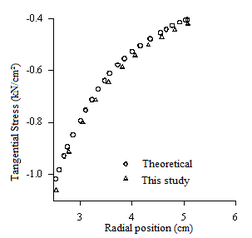
The results of displacements and stresses indicated in Figures 14 and 15 were assessed in radial points of the discretized structure as indicated in Figure 13.
|
|
The numerical responses shown in Figures 14 and 15 were compared with the theoretical results obtained by Timoshenko and Goodier (6) corresponding to nodal points in the piece. Radial and tangential stresses were calculated in the global coordinate system and assessed at the centroid of each triangular finite element. To obtain the stress values in some point out of the centroid, the polynomial interpolation technique was used with the aid of Lagrange interpolation polynomial.
In this application, the graphs of displacements and stresses at the nodes of the elements show an excellent approximation between the numerical results obtained in this study and the theoretical values found in literature.
3.3 Concrete pile
This example shows the results of the modeling of a concrete pile as shown in Figure 16.
The concrete pile had , Poisson coefficient and the concrete elasticity modulus was calculated with the equation .
The soil considered in this example had specific weight , friction angle and the coefficient of active soil thrust , that is, .
The block had a height of 2m and the pile had 10m length, that is, the height of the soil massif was h=12m. Pile diameter was 2m and the axial load to which it was subjected was q=3000kN. Acting pressures on the edges of the pile were calculated by equation .
The structure was discretized with 126 nodes and 200 elements, as shown in Figure 17. It is worth emphasizing that the same finite element mesh was used in the analyses by Progaxisymmetric and ANSYS (2).

a) Nodes |

b) Elements |
Tables 4, 5, 6 and 7 present the results of radial, axial, tangential and circumferential stresses at the centroid of elements 192 and 200, see Figure 17, compared with those obtained from ANSYS 17(2) software. This example also used the two-dimension finite element with 3 nodes and 2 degrees of freedom per node called PLANE 182 to perform the analyses by ANSYS 17(2).
| Radial stresses | |||
| Element | This study | ANSYS | This study/ANSYS |
| 192 | 34.860 | 34.842 | 1.0005 |
| 193 | 26.660 | 26.642 | 1.0007 |
| 194 | 125.300 | 125.210 | 1.0007 |
| 195 | 58.070 | 58.036 | 1.0006 |
| 196 | 614.100 | 613.790 | 1.0005 |
| 197 | 573.400 | 573.090 | 1.0005 |
| 198 | -166.100 | -166.020 | 1.0005 |
| 199 | -741.700 | -741.370 | 1.0004 |
| 200 | -3196.000 | -3194.800 | 1.0004 |
| Axial stresses | |||
| Element | This study | ANSYS | This study/ANSYS |
| 192 | -3039.000 | -3037.600 | 1.0005 |
| 193 | -3126.000 | -3124.800 | 1.0004 |
| 194 | -3101.000 | -3099.400 | 1.0005 |
| 195 | -3412.000 | -3410.200 | 1.0005 |
| 196 | -3392.000 | -3390.200 | 1.0005 |
| 197 | -4016.000 | -3390.200 | 1.0005 |
| 198 | -4695.000 | -4692.400 | 1.0006 |
| 199 | -5388.000 | -5385.200 | 1.0005 |
| 200 | -10700.000 | -10694.000 | 1.0006 |
| Tangential stresses | |||
| Element | This study | ANSYS | This study/ANSYS |
| 192 | -7.764 | -7.760 | 1.0005 |
| 193 | 16.250 | 16.242 | 1.0005 |
| 194 | 21.680 | 21.672 | 1.0004 |
| 195 | 47.350 | 47.330 | 1.0004 |
| 196 | 39.020 | 39.002 | 1.0005 |
| 197 | 241.100 | 240.940 | 1.0007 |
| 198 | 1198.000 | 1197.700 | 1.0003 |
| 199 | 601.900 | 601.590 | 1.0005 |
| 200 | 4835.000 | 4832.200 | 1.0006 |
| Circumferential stresses | |||
| Element | This study | ANSYS | This study/ANSYS |
| 192 | -27.130 | -27.115 | 1.0006 |
| 193 | 27.350 | 37.335 | 1.0005 |
| 194 | 99.730 | 99.679 | 1.0005 |
| 195 | 141.900 | 141.800 | 1.0007 |
| 196 | 6.742 | 6.739 | 1.0005 |
| 197 | 467.700 | 467.450 | 1.0005 |
| 198 | 1750.000 | 1749.200 | 1.0005 |
| 199 | 140.800 | 140.690 | 1.0008 |
| 200 | -2086.000 | -2084.900 | 1.0005 |
In this application, when the stresses at the centroid of the element determined by the implemented code were compared with the results obtained through ANSYS 17 (2) software a maximum percent difference of 0.08% was obtained.
3.4 Mixed Steel-Concrete Pillar
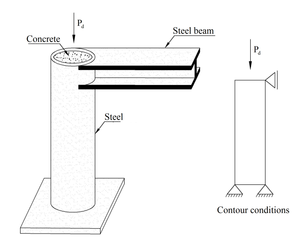
This example presents the numerical results of the analysis of a mixed steel-concrete pillar subjected to a designed axial load . The length of the pillar was 2m and the dimensions of the steel tube were 35.56cmx33.06cmx1.25mm. The tube was filled with concrete whose characteristic strength after 28 days was , the elasticity modulus of concrete was calculated with the equation , Poisson coefficient for the steel tube was considered and for the confined concrete Poison coefficient was equal to .
The objective of the analysis was to calculate lateral displacements and radial, axial, tangential and circumferential stresses at different points of the structure and, aiming to validate the results obtained by the computer program developed in the present research, the structure was also modeled through ANSYS 17 (2) software.
Figure 18 presents a loading scheme acting at the top of the mixed steel-concrete pillar and Figure 19 shows the finite element mesh adopted to solve this example.
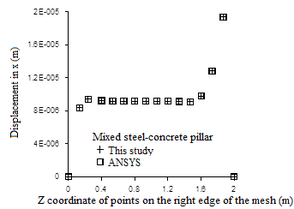
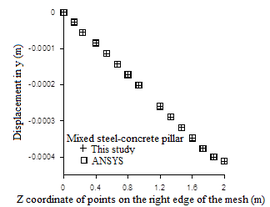
Figure 20 presents the results of the displacements in the x and y directions at several nodes of the structure located along its length on the mesh right edge compared to those obtained with the aid of ANSYS 17 (2) software.

a) Elements |
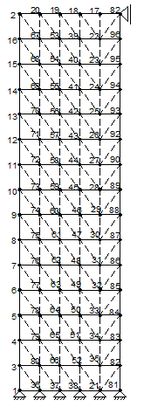
b) Nodes |
|
|
Tables 8, 9, 10 and 11 present the results of the radial, axial, tangential and circumferential stresses of the elements located at the top of the mixed pillar.
| Radial stresses | |||
| Element | This study | ANSYS | This study/ANSYS |
| 149 | 3665.000 | 3663.000 | 1.0005 |
| 150 | -7096.000 | -7092.000 | 1.0006 |
| 1 | -461.000 | -460.770 | 1.0005 |
| 2 | -1689.000 | -1687.700 | 1.0008 |
| 3 | -1022.000 | -1021.900 | 1.0001 |
| 4 | -2875.000 | -2873.200 | 1.0006 |
| 5 | -2293.000 | -2291.800 | 1.0005 |
| 6 | -4616.000 | -4613.200 | 1.0006 |
| 7 | -5524.000 | -5521.400 | 1.0005 |
| 8 | -8313.000 | -8308.900 | 1.0005 |
| Axial stresses | |||
| Element | This study | ANSYS | This studyANSYS |
| 149 | -13360.000 | -13354.000 | 1.0004 |
| 150 | -22640.000 | -22626.000 | 1.0006 |
| 1 | -2920.000 | -2918.500 | 1.0005 |
| 2 | -5608.000 | -5605.000 | 1.0005 |
| 3 | -5659.000 | -5655.800 | 1.0006 |
| 4 | -11710.000 | -11702.000 | 1.0007 |
| 5 | -11820.000 | -11815.000 | 1.0004 |
| 6 | -28130.000 | -28118.000 | 1.0004 |
| 7 | -28400.000 | -28385.000 | 1.0005 |
| 8 | -92310.000 | -92263.000 | 1.0005 |
| Tangential stresses | |||
| Element | This study | ANSYS | This study/ANSYS |
| 149 | 12610.000 | 12608.000 | 1.0002 |
| 150 | -1015.000 | -1014.000 | 1.0010 |
| 1 | 614.900 | 614.620 | 1.0005 |
| 2 | 1467.000 | 1466.500 | 1.0003 |
| 3 | 546.600 | 546.360 | 1.0004 |
| 4 | 1506.000 | 1505.600 | 1.0003 |
| 5 | 353.600 | 356.420 | 1.0005 |
| 6 | 1207.000 | 1206.000 | 1.0008 |
| 7 | 779.000 | 778.600 | 1.0005 |
| 8 | -22.720 | -22.710 | 1.0004 |
| Circumferential stresses | |||
| Element | This study | ANSYS | This study/ANSYS |
| 149 | 6897.000 | -6893.000 | 1.0006 |
| 150 | 1283.000 | 1283.000 | 1.0000 |
| 1 | 4714.000 | 4711.400 | 1.0006 |
| 2 | 1090.000 | 1089.600 | 1.0004 |
| 3 | 10410.000 | 10403.000 | 1.0007 |
| 4 | 2408.000 | 2406.900 | 1.0005 |
| 5 | 25400.000 | 25384.000 | 1.0006 |
| 6 | 3964.000 | 3961.800 | 1.0006 |
| 7 | 89730.000 | 89687.000 | 1.0005 |
| 8 | 6092.000 | 6088.700 | 1.0005 |
In this application the comparison of the stresses at the centroid of the elements obtained by Progaxisymmetric with the results of ANSYS 17 (2)software resulted in a maximum difference of 0.10%. it is worth emphasizing that in this example, a mesh composed by two elements (steel and concrete) was generated.
4 CONCLUSIONS
One of the main contributions of this study is the implementation of a sub-routine based on Lagrange polynomial that allows obtaining stress values at any point located along the triangular finite element.
Another significant contribution is that structures composed by more than one material could be analyzed in the present research. As an example, the fourth application, corresponding to a mixed steel-concrete tubular pillar with circular cross section can be mentioned.
In addition, different types of loadings such as body forces, nodal loads or uniformly distributed surface loads, distributed in triangular or trapezoidal form applied on the edges of the elements can be introduced in this computational package. We must also mention that mathematical manipulations were made capable of transforming them into equivalent nodal loads and it is worth remembering that the surface loads can be applied on horizontal, vertical or inclined edges.
Finally, it is important to cite that the examples presented were compared with results from the literature and with numerical modelings performed with ANSYS 17(2) software aiming at validating the success of the numerical implementations carried out.
Therefore, based on the numerical comparisons conducted, we conclude that the implementation developed was successful; contributing with accurate stress, strain and displacement values in axisymmetric structures subjected to axisymmetric forces.
References
[1] Chapman, S. J. Fortran 90/95 for Scientists and Engineers. McGraw–Hill, 2003, 2nd ed.
[2] ANSYS. Inc. theory reference, 2012, (version 12.1).
[3] Vicente, W. M. and Oliveira, W.C., Análise de Tensões em Placas Circulares Utilizando Elementos Finitos Axissimétricos. Trabalho Final de Graduação de Engenharia Mecânica, 2009, Universidade Federal de Itajubá, Itajubá, MG, Brasil.
[4] Bathe, K. J., Finite Element Procedures. Prentice Hall, 1996, Englewood Cliffs, New Jersey, 1051 p.
[5] Chandrupatla, T.R. and Belegundu, A.D., Elementos Finitos. São Paulo: Pearson Education do Brasil, 2014.
[6] Timosh, S. P. and. Goodier, J. N., Theory of Elasticity. Third Edition, 1951, New York, McGraw–Hill Co.
Document information
Published on 01/07/19
Licence: CC BY-NC-SA license


