Abstract
This research was based on a finite-element model (FEM) of large foundations such as induced draft (ID) fans. Three-dimensional (3D) linear analyses were performed under arbitrary static and dynamic loads for various modulus of elasticity of concrete (Ec) (20, 25, 28 and 30 GPa) and reinforcement (Es) (200, 250, 300 GPa). FEM results were compared with the existing ID fan foundations (laboratory-based evidence) to assess the accuracy of simulations made by the FEM. This study validated what constitutes a major departure from current thinking regarding material properties modeling of concrete under various loads to increase foundation for lifetime.
Keywords
Concrete foundation; Centrifugal ID fan; Modulus of elasticity; Finite element model (FEM); Lifetime
1. Introduction
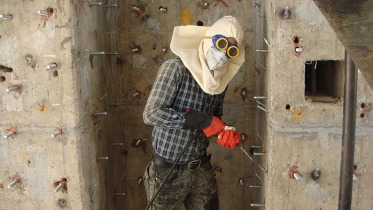
Fan vibrations may lead to operational problems, shutdowns, and curtailed operations. Therefore, the analysis of large structural concrete foundations for induced draft (ID) fans presents a challenge to a wide variety of industrial plants [1]. Concrete foundation cracks result not only from mechanical defects which cannot be completely resolved by plant personnel (e.g. imbalance and misalignment), but also from type of loading, speed of rotors, and cyclic and dynamic loading (Fig. 1). Fan vibration, caused by the mentioned reasons as well as the frequency resonance of the dynamic load, can reduce the safety factor of an ID fan foundation [2] and [3]. Simply checking the validity of the foundation design for the stationary situation (as it often happens in practice) might not be enough to produce a proper foundation design [4].
|
|
|
Figure 1. Typical concrete foundation of induced draft fan systems in which cracks occur. |
Many researchers have attempted to increase the life span of ID fan foundations by identification of the reasons for their higher sensitivity. In the beginning of the 20th century, the analysis of large concrete foundations was limited to static calculations based on vertical loads comprising dead load plus machine weight multiplied by three-five. However, it is now obvious that such designs with the first order natural frequency alone are not sufficient to characterize the dynamic behavior of large concrete foundations. In other words, a better understanding of the involved processes requires a dynamic analysis [5]. Serious challenges posed by increasing heights of towers and foundations along with concerns about design concepts, life cycle, environmental impacts, and dynamic load necessitate the revision of the existing production and assembling solutions [6]. The finite element model (FEM) is a beneficial method to include all parameters without the construction of a full-scale foundation [7]. Research has shown that the first and second natural frequencies obtained from a stiffness matrix with coupled lateral behavior provided very good correspondence with the FEM of the foundation, especially when the effects of inertia on the foundation were negligible [8]. Operating deflection shape (ODS) models are also applied to identify the weaknesses of the foundation at a large ID fan. These models have indicated that adding mass and stiffness with more piles and concrete could be reliable except when resonance is involved. The reliability of such models can be obtained from Newton’s second law of motion (F = m × a) which implies that the acceleration levels (a) would generally be reduced by increasing the mass (m). Hooke’s law (F = k × x), on the other hand, suggests that increased stiffness (k) is generally associated with lower displacement levels (x) [9]. Therefore, isolation systems can be useful to reduce foundation vibration [10], [11] and [12]. Meanwhile, the resonant frequencies of the rotor and support system may cause very high amplitude vibrations [13]. The mass of the foundation block should also be adequate. The adequacy and dimensions of foundations, particularly the more complex ones, can be best evaluated by detailed analysis of the existing stresses and strains [14].
Various standards and approaches have used the types of loading (based on the coefficient of load), material properties, and safety factor to determine the appropriate design of ID fan foundations under static and dynamic loads [15], [16], [17], [18] and [19]. While several studies have assessed some parameters of ID fans subjected to static or dynamic load, the deformation and stress caused by fan vibration and mass have not been well evaluated. These factors are affected by the shape and size of the foundation and the strength of the materials. The characteristics of the duct of screws and bolts used to connect the machine to the foundation should also be accurately designed and specified. Precise design and implementation of fan foundations can diminish the stresses and strains they receive and hence increase their longevity.
As the prediction of foundation behavior under various conditions can improve its structural performance, the present work aimed to use the FEM to accurately estimate the behavior of the concrete foundation under static and dynamic loads with different frequencies. It is noteworthy that due to the possible imbalance of the fan, the load applied to the foundation is generally dynamic unless a damper or isolator is used. We, therefore, tried to evaluate the structural behavior of the fan foundation under various types of loads, i.e. static and dynamic loads with rotor speed of 400, 800, 1200, and 1800 rounds per minute (rpm). We also used different material strengths, e.g. compressive strength of concrete and reinforcement, to determine the critical points of foundation structures in terms of displacements and stresses imposed and to predict the actual behavior of the structure and the likelihood of further damage. We finally compared our predictions with the actual cement foundation of a plant.
2. Load cases
Foundation analysis requires the proper consideration of machine loads, categorized as static and dynamic loads and those exerted during operation, provided by the manufacturers. The main static load is generally caused by the dead load of the equipment. The magnitude of the moments produced by the driving mechanism, typically calculated as a vertical force couple, depends on both the rotational speed and power output.
Imbalance, created when the rotating part’s center of mass does not match the center of rotation, is responsible for major dynamic loads during operation. Although these loads are commonly presented by the machine manufacturer, they can also be computed based on the balance quality grade of the rotor.
The resultant imbalanced load F(t) (N) is calculated with the rotating mass m (kg) as follows:
|
|
(1) |
where e (mm) is permissible eccentricity and (rad/s) is rotor velocity.
Since such an imbalance increases over the course of operation, the F(t) obtained from Eq. (1) has to be multiplied by a factor which should typically, but not always, be greater than 2 [20].
Dynamic analysis is performed based on the vibration modes of similar structures and the vibrations measured at various fan speeds (e.g. 400, 800, 1200, 1500, and 1800 rpm). According to Eq. (1), the total F(t) caused by fan rotation at all bolts would be respectively 10, 20, 30, 40, and 50 tons for the above-mentioned rotational frequencies. Based on the direction of fan rotation, the concentrated force should be considered tensile at one side and compressive at the other side. The static load exerted on the surface by the weight of the equipment was considered 60 tons.
3. Model explanation and parameters
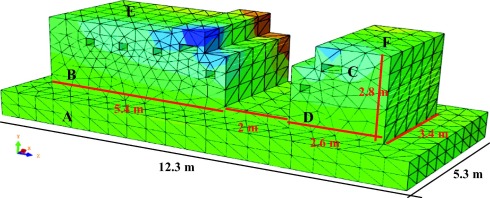
A three-dimensional (3D) numerical model was developed to investigate the behavior of the concrete foundations of ID fans under combined loading conditions. Finite element programming was performed with Abaqus Unified FEA 6.13 (Dassault Systèmes, France) [21]. The Poisson’s ratios of 0.2 and 0.3 and densities of 2400 and 7850 kg/m3 were entered into the software. Concrete components and steel bars were first generated by the software (based on actual practical details) and then assembled at their appropriate locations. The steel bars were attached and completely embedded in the concrete structure. Since proper meshing of the obtained structural components is critical to the accuracy of the results, a 10-node quadratic tetrahedron (C3D10) mesh and a 3-node quadratic beam in space (B32) mesh were considered for the concrete structure and the steel bars, respectively. In the next stage, extensive static and harmonic dynamic loading (caused respectively by the rotor weight and the rotation of fan blades) was conducted based on the relevant equations of the centrifugal force. Data about the fixed support joints, including all rotations and translations, in the buried concrete foundation area (A) were then provided. In the dynamic model, the step/set phases with various modes of structure were applied for simple and frequency analyses. The model was then analyzed based on the desired outputs (such as tension, displacements, and support reactions) and the exerted loads. During the modeling, we considered A to be rigid and displacements in X, Y, and Z directions as well as rotation to be zero. Since geophysical examination of the study area would clearly determine the soil-structure interactions and tensions applied to the structure, modeling based on such assessments would lead to more accurate results. Fig. 2 presents the dimensions of the modeled foundation and highlights different foundation parts including the buried area (A), the pedestal under the main fan motor (B), holes symmetrically created on both sides of the foundation to fasten the bolts on the underling plate of the machine (C), the pedestal under the fan (D), and the foundation’s loading surfaces (E and F).
|
|
|
Figure 2. Foundation dimensions, finite element model, and specified area. |
Four different concrete modulus of elasticity (20, 25, 28, and 30 GPa) and three modulus of reinforcement (200, 250, and 300 GPa) were chosen to study the effects of foundation characteristics. A major issue in numerical modeling of foundations is the simulation of loading type applied to the surface of the concrete foundation.
4. Natural and load frequency
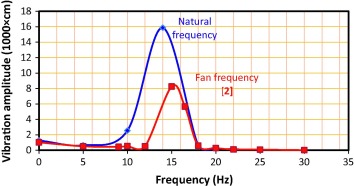
During the initial setup of centrifugal ID fans at a large power plant, the vibrations of the rotor-bearing-foundation usually exceed 0.05 mm at 1200 rpm. Fig. 3 compares the natural frequency of the foundation obtained from the FEM with the findings of Smith and Simmons [2]. As seen, the frequency at a running speed of 1200 rpm was 14 Hz. Under such conditions, the natural displacement of the structure and the displacement caused by the ID fan vibration were 0.08 and 0.16 mm, respectively.
|
|
|
Figure 3. Vibration amplitude (1000× cm) vs. natural frequency of foundation and fan frequency. |
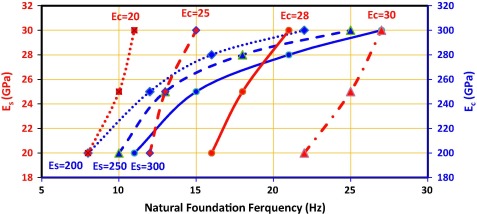
Therefore, a comparison between the running speed of the fan and the natural frequency at the running speed can determine the satisfactory speed. Smith and Simmons [2] suggested the least natural frequency as 70% of the running speed of the fan. Further conservatism is included in the FEM by using a lower limit value of Young’s modulus (Ec) of 20–30 GPa for the concrete foundation. Fig. 4 shows the effects of Ec (equal to 20, 25, 28, and 30 GPa) and modulus of elasticity of reinforcement (Es), equal to 200, 250, and 300 GPa, on the natural frequencies of the foundation. Foundation modifications to reduce vibration amplitudes were analyzed using the FEM. In this model, the natural frequency was temporarily placed against the right side modulus of the concrete and the left side modulus of the reinforcement. This showed how frequency depended on changes in the modulus of materials (e.g. concrete and reinforcement). However, most investigated modifications were impractical due to cost or space limitations. Meanwhile, FEM can define the optimal combination of concrete and reinforcement modulus to yield optimal natural frequency and increase the safety factor. Moreover, the frequency was increased by a factor of two and three subsequent to increments in the modulus of elasticity of concrete and reinforcement, respectively.
|
|
|
Figure 4. Effect of modulus of elasticity of concrete (Ec) and reinforcement (Es) vs. natural foundation frequency. |
In contrast to the resonance phenomenon, the natural frequency of a foundation should have at least a 20% difference with the running speed. Following such a relation, the intersection of the two graphs can determine the best combination of materials and thus maximum safety.
4.1. Fatigue analysis
The repetitive nature of dynamic stress can cause fatigue. In order to calculate fatigue, dynamic stress should be multiplied by a fatigue factor. Since fatigue can damage the foundation of ID fans, the fatigue limit of the foundations needs to be accurately examined. The load combination associated with this condition is determined based on S–N curves which plot stress amplitude (S) against the number of cycles to failure (N). These curves are built on a yearly basis considering all possible load situations that may occur during operation and the results are extrapolated for the lifetime of the foundation (usually 20 years). Fatigue life is defined as the number of cycles before failure. The fatigue life of concrete subjected to cyclic stresses may be calculated from Eq. (2):
|
|
(2) |
where is the compression strength for the type of failure in question, is the numerically largest compressive stress calculated as the average value within each stress block, is the numerically least compressive stress calculated as the average value within each stress block, and is the fatigue strength parameter. should be considered equal to 1 for concrete and equal to 12 for structures in air [22].
5. Results and discussion
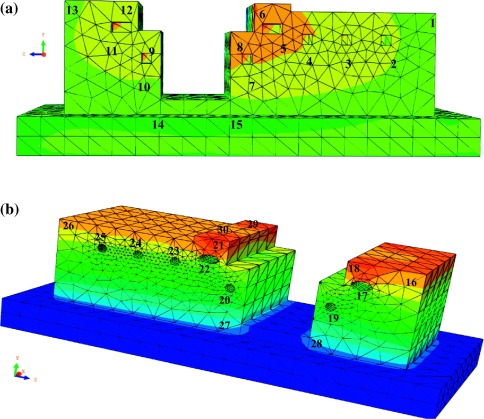
The initial analysis of the FEM of the foundation revealed that the critical points of the model needed to be further evaluated due to their position. Moreover, concrete foundation cracks generally appeared near the ducts (Fig. 5). Therefore, the overall number of selected points was about 28, i.e. 1–15 points for rectangular ducts and 16–28 points for circular ducts (Fig. 6).
|
|
|
Figure 5. Representation of critical points in the actual foundation. |
|
|
|
Figure 6. Representation of critical points of the induced draft (ID) fan foundation in deflection state under static load for (a) rectangular and (b) circular duct shapes at X and Y axis, respectively. |
5.1. Effect of various materials and duct shapes
The model was designed under a uniform load of 60 tons for the top surface along with a 20-ton point load which acted on all pins as a tensile force on the one side and as a compressive force on the other side. The model was defined for a combination of rectangular and circular ducts at various moduli of concrete (20–30 GPa) and reinforcement (250–350 GPa). The stress and deflection data selected for the study were obtained from these 28 points in the Y direction ( Table 1 and Table 2). The quantities of deflection and stress of these points under static compressive load are shown as U and S, respectively. The corresponding quantities under static tensile load are presented as Ut and St.
| Ec (GPa) | 20 | 25 | 28 | 30 | ||||||||||||
|---|---|---|---|---|---|---|---|---|---|---|---|---|---|---|---|---|
| Parameter | U | S | Ut | St | U | S | Ut | St | U | S | Ut | St | U | S | Ut | St |
| Point number | Rectangular duct | |||||||||||||||
| 1 | 5.25 | 7.43 | 5.62 | 8.25 | 4.23 | 6.82 | 6.35 | 8.04 | 3.79 | 5.70 | 5.43 | 7.86 | 3.55 | 6.36 | 6.01 | 7.49 |
| 2 | 4.75 | 7.53 | 5.23 | 8.54 | 3.82 | 6.95 | 6.19 | 8.12 | 3.42 | 5.95 | 5.85 | 7.85 | 3.19 | 6.25 | 5.65 | 7.52 |
| 3 | 4.68 | 6.99 | 6.89 | 7.32 | 3.76 | 6.98 | 5.94 | 7.53 | 3.37 | 7.07 | 6.25 | 7.94 | 3.15 | 6.87 | 5.13 | 7.38 |
| 4 | 4.74 | 7.74 | 4.59 | 7.94 | 3.81 | 6.88 | 5.76 | 7.99 | 3.41 | 6.81 | 5.38 | 7.81 | 3.17 | 6.61 | 4.44 | 7.64 |
| 5 | 5.98 | 7.89 | 7.18 | 8.59 | 4.80 | 6.53 | 6.20 | 8.13 | 4.30 | 6.40 | 5.40 | 7.90 | 4.11 | 6.13 | 4.91 | 7.53 |
| 6 | 5.55 | 7.61 | 5.63 | 8.32 | 4.77 | 5.60 | 6.15 | 8.05 | 3.97 | 6.19 | 5.85 | 7.95 | 3.99 | 6.20 | 5.15 | 7.35 |
| 7 | 3.90 | 7.13 | 8.46 | 7.94 | 3.13 | 6.38 | 7.61 | 8.10 | 3.22 | 6.24 | 7.39 | 7.74 | 2.91 | 7.05 | 6.54 | 7.54 |
| 8 | 4.48 | 7.36 | 4.78 | 7.84 | 3.48 | 6.74 | 4.97 | 8.18 | 3.10 | 6.95 | 4.54 | 7.93 | 3.02 | 6.95 | 4.32 | 7.27 |
| 9 | 4.33 | 7.62 | 6.16 | 8.26 | 2.87 | 5.93 | 5.23 | 7.99 | 2.66 | 6.36 | 5.53 | 7.85 | 3.33 | 6.02 | 5.95 | 7.50 |
| 10 | 4.40 | 7.58 | 6.80 | 8.38 | 4.05 | 7.20 | 6.15 | 8.10 | 3.33 | 6.83 | 5.33 | 7.83 | 2.48 | 6.22 | 4.48 | 7.72 |
| 11 | 5.79 | 6.82 | 8.41 | 7.16 | 4.77 | 7.11 | 6.53 | 8.04 | 4.26 | 7.82 | 6.62 | 7.95 | 3.89 | 6.37 | 6.13 | 7.37 |
| 12 | 5.94 | 7.31 | 7.33 | 8.02 | 4.40 | 6.35 | 6.35 | 7.95 | 3.94 | 6.91 | 6.18 | 7.83 | 3.73 | 6.60 | 6.02 | 7.33 |
| 13 | 5.45 | 7.55 | 6.84 | 8.30 | 0.86 | 6.46 | 5.84 | 7.85 | 0.75 | 6.91 | 5.97 | 7.95 | 3.78 | 6.82 | 5.40 | 7.51 |
| 14 | 1.12 | 7.70 | 7.26 | 7.95 | 0.90 | 6.01 | 6.68 | 7.94 | 0.81 | 6.81 | 6.82 | 7.87 | 0.72 | 6.26 | 6.14 | 7.42 |
| 15 | 5.13 | 6.38 | 7.95 | 7.84 | 4.39 | 6.45 | 7.15 | 7.85 | 3.94 | 6.36 | 6.55 | 7.35 | 0.76 | 7.03 | 6.58 | 7.18 |
| Circular duct | ||||||||||||||||
| 16 | 5.45 | 7.31 | 4.96 | 6.32 | 2.82 | 6.74 | 5.24 | 5.68 | 2.49 | 5.75 | 5.61 | 5.62 | 3.68 | 5.79 | 4.15 | 4.48 |
| 17 | 5.52 | 7.54 | 5.22 | 6.15 | 4.68 | 6.76 | 5.36 | 5.67 | 4.18 | 6.78 | 5.39 | 5.48 | 3.91 | 6.14 | 5.86 | 4.83 |
| 18 | 5.45 | 6.61 | 6.32 | 5.87 | 2.91 | 7.34 | 5.84 | 5.53 | 2.05 | 6.14 | 6.08 | 5.38 | 4.04 | 5.61 | 5.04 | 4.68 |
| 19 | 3.88 | 6.83 | 3.25 | 5.81 | 2.14 | 6.43 | 6.15 | 5.46 | 2.18 | 6.22 | 5.85 | 5.29 | 1.91 | 5.59 | 5.42 | 4.75 |
| 20 | 5.89 | 6.96 | 5.38 | 6.28 | 4.73 | 6.10 | 5.75 | 5.68 | 4.32 | 6.09 | 5.61 | 5.27 | 2.03 | 6.60 | 6.12 | 4.47 |
| 21 | 3.61 | 6.63 | 5.99 | 6.03 | 4.69 | 5.58 | 5.64 | 5.05 | 2.62 | 6.58 | 5.29 | 5.07 | 4.03 | 5.96 | 4.83 | 4.51 |
| 22 | 4.61 | 7.17 | 4.94 | 6.09 | 3.55 | 5.82 | 5.97 | 4.95 | 2.82 | 5.63 | 6.13 | 4.78 | 2.45 | 5.35 | 6.57 | 4.55 |
| 23 | 4.62 | 6.51 | 3.22 | 6.25 | 3.47 | 6.34 | 4.83 | 5.19 | 2.96 | 5.75 | 4.81 | 4.92 | 2.84 | 5.50 | 4.14 | 4.33 |
| 24 | 4.25 | 6.50 | 3.94 | 6.26 | 3.51 | 7.05 | 4.24 | 4.83 | 2.94 | 6.06 | 4.95 | 5.24 | 2.90 | 5.61 | 4.86 | 5.08 |
| 25 | 5.26 | 6.73 | 4.39 | 6.33 | 4.24 | 6.57 | 4.89 | 5.05 | 3.80 | 6.89 | 4.84 | 5.17 | 2.83 | 5.61 | 5.50 | 4.70 |
| 26 | 1.20 | 6.92 | 4.93 | 6.48 | 4.24 | 6.87 | 4.77 | 5.19 | 0.86 | 6.23 | 5.58 | 5.07 | 3.55 | 5.81 | 5.33 | 4.86 |
| 27 | 1.02 | 7.41 | 5.84 | 5.62 | 0.96 | 7.23 | 5.63 | 4.83 | 1.22 | 5.42 | 5.33 | 5.24 | 0.80 | 5.90 | 5.47 | 4.58 |
| 28 | 1.02 | 6.60 | 5.53 | 6.13 | 0.82 | 6.41 | 5.95 | 5.17 | 1.22 | 6.42 | 5.17 | 4.84 | 0.68 | 5.42 | 4.96 | 4.49 |
Table 2.
Deflection (mm) and stress (GPa) values at critical points for modulus of elasticity of concrete (Ec) = 30 GPa and various moduli of elasticity of reinforcement (Es).
| Es (GPa) | 250 | 200 | 300 | |||||||||
|---|---|---|---|---|---|---|---|---|---|---|---|---|
| Parameter | U | S | Ut | St | U | S | Ut | St | U | S | Ut | St |
| Point number | Rectangular duct | |||||||||||
| 1 | 3.55 | 6.36 | 6.01 | 7.49 | 3.47 | 6.80 | 5.29 | 7.05 | 3.01 | 5.72 | 6.23 | 6.38 |
| 2 | 3.19 | 6.25 | 5.65 | 7.52 | 3.40 | 6.96 | 5.06 | 7.10 | 2.98 | 5.95 | 5.56 | 6.48 |
| 3 | 3.15 | 6.87 | 5.13 | 7.38 | 3.26 | 6.88 | 6.24 | 6.92 | 3.04 | 5.76 | 6.11 | 6.33 |
| 4 | 3.17 | 6.61 | 4.44 | 7.64 | 3.38 | 6.71 | 5.36 | 7.19 | 2.98 | 5.81 | 5.87 | 6.54 |
| 5 | 4.11 | 6.13 | 4.91 | 7.53 | 4.23 | 7.33 | 5.83 | 6.93 | 3.80 | 6.03 | 4.10 | 6.43 |
| 6 | 3.99 | 6.20 | 5.15 | 7.35 | 3.54 | 7.21 | 5.89 | 7.04 | 3.78 | 6.18 | 6.14 | 6.54 |
| 7 | 2.91 | 7.05 | 6.54 | 7.54 | 2.82 | 7.06 | 6.31 | 7.02 | 2.61 | 6.04 | 6.62 | 6.32 |
| 8 | 3.02 | 6.95 | 4.32 | 7.27 | 2.95 | 6.97 | 5.31 | 7.58 | 3.10 | 5.93 | 5.18 | 6.59 |
| 9 | 3.33 | 6.02 | 5.95 | 7.50 | 3.10 | 6.96 | 5.83 | 7.76 | 2.99 | 6.01 | 5.21 | 6.92 |
| 10 | 2.48 | 6.22 | 4.48 | 7.72 | 2.60 | 6.85 | 6.20 | 7.95 | 2.28 | 6.11 | 5.18 | 7.08 |
| 11 | 3.89 | 6.37 | 6.13 | 7.37 | 4.10 | 7.48 | 6.18 | 7.65 | 3.68 | 6.16 | 6.28 | 6.92 |
| 12 | 3.73 | 6.60 | 6.02 | 7.33 | 3.99 | 7.05 | 6.51 | 7.84 | 3.57 | 6.18 | 6.52 | 6.63 |
| 13 | 3.78 | 6.82 | 5.40 | 7.51 | 3.70 | 6.85 | 5.13 | 7.92 | 3.36 | 5.79 | 5.42 | 7.09 |
| 14 | 0.72 | 6.26 | 6.14 | 7.42 | 0.83 | 7.46 | 6.23 | 7.75 | 0.61 | 6.45 | 5.83 | 7.15 |
| 15 | 0.76 | 7.03 | 6.58 | 7.18 | 0.92 | 6.75 | 5.93 | 7.89 | 0.65 | 5.74 | 6.23 | 6.92 |
| Circular duct | ||||||||||||
| 16 | 3.68 | 5.79 | 4.15 | 4.48 | 3.70 | 6.83 | 5.95 | 5.37 | 3.66 | 5.76 | 5.15 | 4.93 |
| 17 | 3.91 | 6.14 | 5.86 | 4.83 | 3.96 | 6.48 | 5.20 | 5.32 | 2.35 | 6.34 | 5.84 | 4.72 |
| 18 | 4.04 | 5.61 | 5.04 | 4.68 | 3.91 | 6.30 | 6.01 | 5.17 | 3.90 | 6.26 | 5.37 | 4.72 |
| 4.57 | 19 | 1.91 | 5.59 | 5.42 | 4.75 | 2.23 | 6.22 | 6.19 | 5.28 | 1.91 | 5.68 | 6.82 |
| 20 | 2.03 | 6.60 | 6.12 | 4.47 | 2.03 | 6.64 | 5.14 | 5.78 | 2.03 | 5.58 | 6.28 | 4.53 |
| 21 | 4.03 | 5.96 | 4.83 | 4.51 | 3.64 | 6.01 | 6.13 | 5.27 | 3.94 | 6.00 | 6.06 | 4.56 |
| 22 | 2.45 | 5.35 | 6.57 | 4.55 | 2.45 | 6.64 | 6.35 | 5.64 | 2.41 | 5.84 | 5.48 | 4.34 |
| 23 | 2.84 | 5.50 | 4.14 | 4.33 | 2.64 | 6.72 | 5.15 | 5.30 | 2.96 | 6.80 | 5.92 | 4.42 |
| 24 | 2.90 | 5.61 | 4.86 | 5.08 | 2.91 | 6.47 | 4.99 | 5.65 | 2.89 | 6.54 | 4.89 | 4.57 |
| 25 | 2.83 | 5.61 | 5.50 | 4.70 | 2.85 | 6.36 | 5.24 | 5.52 | 2.84 | 6.87 | 5.15 | 4.68 |
| 26 | 3.55 | 5.81 | 5.33 | 4.86 | 3.57 | 6.84 | 5.20 | 5.63 | 3.53 | 6.78 | 5.51 | 4.53 |
| 27 | 0.80 | 5.90 | 5.47 | 4.58 | 0.80 | 6.74 | 6.13 | 5.55 | 0.80 | 6.23 | 6.28 | 4.42 |
| 28 | 0.68 | 5.42 | 4.96 | 4.49 | 0.68 | 6.42 | 6.08 | 5.35 | 1.15 | 6.03 | 6.32 | 4.59 |
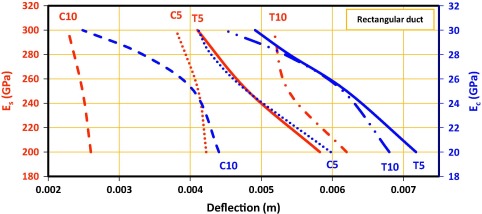
Relationships of Es and Ec with deflection and stress values at specified points for rectangular and circular ducts are shown in Figure 7, Figure 8 and Figure 9. As Fig. 7 shows, by increasing Ec at the right side and Es at the left side, deflection will be reduced at points 5 and 10. Moreover, increasing Ec from 20 to 30 GPa reduced deflection by 40% at the compressive point (shown in blue) and by 30% at the tensile point (at the opposite side of the foundation). In the view of modulus of elasticity of reinforcement (Es), it can be concluded that increases in Es, will lead to decreases in deflection around 10%. Apparently, lower deflection was detected at the compressive point compared to the tensile point. At point 5, i.e. where both concrete and reinforcement have high modulus of elasticity, deflection at compressive and tensile points did not vary as much as it did in low modulus. Table 2 and Table 3 suggest similar results about all other points.
|
|
|
Figure 7. Effects of modulus of elasticity of concrete (Ec) and reinforcement (Es) on deflection for compressive (C) points 5 and 10 and their corresponding points on the other side of the foundation, i.e. tensile points (T). |
|
|
|
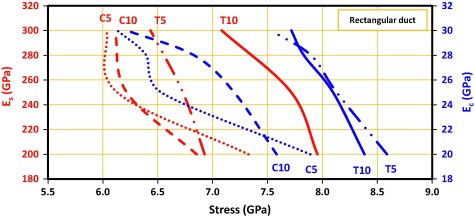
Figure 8. Effects of modulus of elasticity of concrete (Ec) and reinforcement (Es) on stress for compressive (C) points 5 and 10 and their corresponding points on the other side of the foundation, i.e. tensile points (T). |
|
|
|
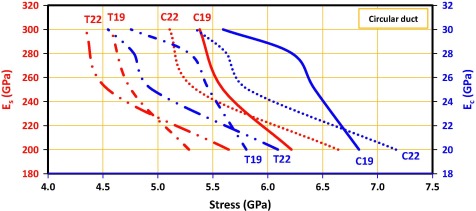
Figure 9. Effects of modulus of elasticity of concrete (Ec) and reinforcement (Es) on stress for compressive (C) points 19 and 22 and their corresponding points on the other side of the foundation, i.e. tensile points (T). |
| Speed (rpm) | 400 | 800 | 1200 | 1500 | 1800 | |||||
|---|---|---|---|---|---|---|---|---|---|---|
| Parameter | U | S | U | S | U | S | U | S | U | S |
| Point number | Rectangular duct | |||||||||
| 1 | 13.28 | 8.16 | 17.25 | 9.78 | 28.14 | 13.16 | 43.18 | 16.08 | 31.81 | 16.23 |
| 2 | 13.94 | 8.10 | 19.67 | 9.74 | 29.57 | 13.94 | 41.57 | 16.01 | 41.12 | 16.48 |
| 3 | 14.01 | 8.07 | 16.82 | 9.62 | 28.83 | 14.10 | 41.62 | 15.97 | 42.17 | 15.97 |
| 4 | 13.11 | 8.22 | 18.87 | 9.61 | 28.43 | 13.85 | 46.55 | 15.53 | 47.59 | 15.78 |
| 5 | 14.36 | 8.26 | 23.69 | 9.74 | 31.22 | 14.60 | 49.03 | 15.63 | 58.15 | 16.57 |
| 6 | 13.84 | 8.17 | 19.37 | 9.54 | 27.45 | 13.99 | 42.81 | 16.20 | 48.96 | 16.24 |
| 7 | 14.52 | 8.20 | 18.95 | 9.53 | 29.68 | 14.02 | 48.16 | 15.18 | 35.68 | 16.00 |
| 8 | 14.67 | 8.37 | 19.91 | 9.45 | 31.87 | 13.23 | 46.75 | 16.28 | 48.76 | 15.99 |
| 9 | 14.09 | 8.33 | 21.58 | 9.48 | 30.15 | 15.65 | 37.46 | 16.00 | 51.47 | 16.11 |
| 10 | 13.61 | 8.49 | 22.45 | 9.36 | 29.59 | 14.03 | 46.47 | 16.36 | 55.11 | 16.90 |
| 11 | 13.52 | 8.24 | 19.83 | 9.24 | 29.93 | 14.18 | 43.81 | 15.90 | 39.27 | 15.78 |
| 12 | 12.08 | 8.14 | 20.19 | 9.35 | 19.75 | 13.88 | 35.15 | 15.92 | 39.86 | 16.42 |
| 13 | 13.64 | 8.03 | 18.32 | 9.35 | 27.24 | 13.98 | 47.86 | 16.19 | 45.16 | 15.95 |
| 14 | 13.83 | 8.31 | 22.68 | 9.31 | 28.51 | 14.67 | 44.56 | 15.47 | 44.81 | 15.54 |
| 15 | 14.19 | 8.23 | 21.45 | 9.34 | 31.03 | 13.75 | 42.57 | 15.99 | 46.95 | 16.52 |
| Circular duct | ||||||||||
| 16 | 13.84 | 6.58 | 19.32 | 7.15 | 29.73 | 10.31 | 39.54 | 10.84 | 37.55 | 14.00 |
| 17 | 14.34 | 6.49 | 19.08 | 7.12 | 25.61 | 10.96 | 41.89 | 10.35 | 39.14 | 13.36 |
| 18 | 14.05 | 6.23 | 19.75 | 7.10 | 28.46 | 10.25 | 40.12 | 11.84 | 45.84 | 13.27 |
| 19 | 11.95 | 6.48 | 18.53 | 7.02 | 25.16 | 10.99 | 34.82 | 11.90 | 47.71 | 13.04 |
| 20 | 13.14 | 6.34 | 19.64 | 7.19 | 27.54 | 11.00 | 39.19 | 10.47 | 40.19 | 14.82 |
| 21 | 12.08 | 6.12 | 18.95 | 7.05 | 26.55 | 11.03 | 35.08 | 10.68 | 41.07 | 13.95 |
| 22 | 8.85 | 6.52 | 13.65 | 7.21 | 18.53 | 11.01 | 25.65 | 12.85 | 35.14 | 14.61 |
| 23 | 10.32 | 6.41 | 18.47 | 7.16 | 31.18 | 11.25 | 34.75 | 11.80 | 38.84 | 14.83 |
| 24 | 9.87 | 6.39 | 16.68 | 7.15 | 29.48 | 10.90 | 42.68 | 11.07 | 40.73 | 14.00 |
| 25 | 14.02 | 6.37 | 17.42 | 7.01 | 27.35 | 10.98 | 38.57 | 11.29 | 48.27 | 13.99 |
| 26 | 11.21 | 6.37 | 15.28 | 7.14 | 24.66 | 11.21 | 39.50 | 11.31 | 45.36 | 14.75 |
| 27 | 8.84 | 6.43 | 11.64 | 7.33 | 28.21 | 11.21 | 40.27 | 11.03 | 39.51 | 14.00 |
| 28 | 11.84 | 6.20 | 17.32 | 7.05 | 27.42 | 10.78 | 33.15 | 10.75 | 40.78 | 13.97 |
According to Fig. 8, increasing Ec at the right side and Es at the left side reduced the stress at points 5 and 10, respectively. Under compressive load, increasing Ec from 20 to 30 GPa decreased stress by 25% (shown in blue). Under tensile load, however, the reduction was limited to 10%. On the other hand, elevated Es cut the stress by around 10%. Obviously, compressive load caused lower stress compared to tensile load in both Es and Ec. Nevertheless, with high values of Es and Ec, the stresses caused by compressive and tensile loads were not largely different. According to Fig. 9, circular ducts could only successfully reduce stress on critical points (compared to rectangular ducts). However, duct shape failed to affect the deflection. A comparison between the rectangular and circular duct shapes indicated the higher sensitivity of the circular duct to stress.
5.2. Foundation analysis under dynamic loading
As seen in the 28 critical points of the fan foundation under static load, differences in the levels of stress and displacement in each direction were not substantial, especially for different duct shapes. However, the stress and displacement values for the fan foundation were more sensitive under dynamic load. The dynamic FEM was under cyclic load and various fan speeds. The model was analyzed for two types of duct shape as well as Es and Ec.
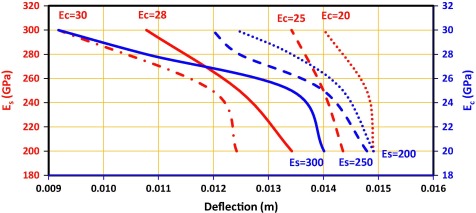
Fig. 10 shows the effects of material characteristics and fan speed on deflection. A total of 12 FEMs were obtained to analyze this figure. The results revealed the sensitivity of the evaluated points to not only Es and Ec, but also fan speed. Nevertheless, the figure only depicts one speed out of five speeds (400 rpm) and one point out of 28 points.
|
|
|
Figure 10. Deflection values for point 5 considering speed (rpm) = 400 and various levels of modulus of elasticity of concrete (Ec) and reinforcement (Es). |
At 400 rpm, the deflection at point of 5 considerably reduced as Ec increased. Hence, using high-strength concrete would decrease deflection by 50%. Likewise, increasing Es from 200 to 300 GPa led to significant reductions in deflection. Apparently, the optimal combination of Ec and Es to minimize deflection would be the intersection of the plots, e.g. Es = 300 GPa and Ec = 28 GPa had better deflection compared to Es = 300 GPa and Ec = 30 GPa. These points can be useful in cutting construction costs and providing practical foundation designs.
Table 3 summarizes the FEM combinations for various fan speeds (400–1800 rpm) at Ec = 25 GPa and Es = 200 GPa. The table also presents the quantity of displacement (U) and stress (S) for rectangular and circular ducts. As seen, lower fan speeds (e.g. 400 rpm) were associated with low stress and deflection. However, increasing the speed from 400 to 1800 rpm, stress and deflection increased by about 100% and 600%, respectively.
Obviously, the sensitivity of deflection to fan speed was much higher than that of stress. On the other hand, the stress and displacement caused by the dynamic load were respectively 2.5 and 10 times greater than the values observed in the static analysis. This highlights the importance of dynamic analysis in the design of similar structures [23]. In addition, in both static and dynamic analyses, the stress values (9 and 18 GPa, respectively) were within the yield stress range. The approximate levels of deflection and stress in all 15 points of the model with rectangular ducts increased by respectively 5–8 times and 2.5 times following changes in loading and using dynamic analysis instead of static analysis. Sayer [11] reported that dynamic emergency loads could be caused by increased imbalance such as cases of blade damage or rotor bending. As a simplification, the emergency imbalance might be assumed to be six times the imbalance during normal operation. Some studies analyzed the dynamic response of foundations subjected to machine-type loadings. The results confirmed the necessity of such analytical works to improve the present knowledge and understanding of dynamic behavior of these structures [24] and [25].
Previous research has failed to specify the exact reason for cracks in ID fan foundations. Meanwhile, taking fatigue into account may facilitate the understanding of the involved mechanisms. As mentioned earlier, ID fan foundations seem to be prone to fatigue damage and must thus be checked for fatigue limit. Dynamic stress is repetitive and can cause fatigue. Fatigue can be computed based on the allowable static load and by multiplying the dynamic stress by a fatigue factor [26]. According to Eqs. (1) and (2) for various speeds, the exerted point load will be compressive on the one side of the pin and tensile on the other side (Table 4).
| Speed (rpm) | 400 | 800 | 1200 | 1500 | 1800 | |
| Frequency (Hz) | 6 | 10 | 14 | 16 | 19 | |
| Load (ton) | 10 | 20 | 30 | 40 | 50 | |
| Work in a day (h) | 12 | 12 | 12 | 12 | 12 | |
| Work in a year (day) | 300 | 300 | 300 | 300 | 300 | |
| Number of frequency in a year (million) | 77 | 130 | 185 | 210 | 250 | |
| Min–max stress (GPa) | Ec = 20 GPa | 3–8.25 | 3–12 | 3–16 | 3–18 | 3–18.5 |
| Ec = 25 GPa | 3–8 | 3–11.5 | 3–14 | 3–16 | 3–16.5 | |
| Ec = 28 GPa | 3–7.5 | 3–9 | 3–12.5 | 3–13.5 | 3–14 | |
| Ec = 30 GPa | 3–7 | 3-8 | 3–10 | 3–12 | 3–13 | |
| Log N | Ec = 20 GPa | 8 | 7 | 3.5 | 2 | 1.75 |
| Ec = 25 GPa | 8.25 | 7.5 | 6.25 | 4.5 | 3.5 | |
| Ec = 28 GPa | 9.5 | 8.5 | 7.3 | 6.25 | 5.75 | |
| Ec = 30 GPa | 9.9 | 9.25 | 9 | 7.5 | 7 | |
The calculations were performed based on the number of loading and unloading cycles in one year. In order to determine the effects of material characteristics on foundation lifetime, 24 FEMs were analyzed.
To simplify the analysis, the main points that would affect lifetime are given in Table 5. It can be seen that increased speed would be associated with decreased lifetime. Moreover, considering various combinations including speed, Ec, and Es, we can determine the optimal material characteristics and speed to obtain greater performance, minimal construction costs, and maximum lifetime for foundations under dynamic load [27].
| Es (GPa) | 200 | 250 | 300 | ||||||||||
|---|---|---|---|---|---|---|---|---|---|---|---|---|---|
| Ec (GPa) | 20 | 25 | 28 | 30 | 20 | 25 | 28 | 30 | 20 | 25 | 28 | 30 | |
| Speed (rpm) | 400 | 12 | 50 | >50 | >50 | 15 | >50 | >50 | >50 | 20 | >50 | >50 | >50 |
| 800 | 3 | 7.5 | >50 | >50 | 5 | 11 | >50 | >50 | 8.5 | 15 | >50 | >50 | |
| 1200 | 0.5 | 1.5 | 3 | 50 | 1 | 2.5 | 7 | >50 | 2 | 4 | 9.5 | >50 | |
| 1500 | 0.3 | 0.4 | 0.5 | 5 | 0.5 | 1.5 | 2.5 | 6 | 1 | 3.5 | 6 | 10 | |
| 1800 | 0.2 | 0.3 | 0.4 | 3.5 | 0.4 | 0.7 | 1 | 4.5 | 1 | 2.5 | 4 | 8 | |
Considering various rotor speeds, it is obvious that higher speeds will be associated with greater stress on foundation structure. The stress–strain curve would thus shift from the linear phase to a nonlinear phase. Numerous load and unload cycles would increase fatigue damage and shorten the period required for the system to reach the nonlinear phase [28] and [29]. Therefore, compressive stress block is reduced faster and the effects of steel mechanical properties (such as Es) on foundation lifetime will be multiplied.
According to the above-mentioned facts, it can be concluded that number of load–unload cycles as well as Es and Ec may play a major role in determining the lifetime of the structure under dynamic loads. For cycles with low frequency, the stresses are in the elastic and elastic–plastic ranges where the foundations’ lifetime is more dependent on Ec variations. Afterward, by increasing the number of cycles, which in turn add to the existing stress, lifetime will gradually become sensitive to variations in Es.
Apparently, the lifetime of concrete structures can be affected by various factors [30], [31], [32], [33] and [34]. Considering significance of evaluating concrete foundations exposed to loading cycles [35], [36] and [37], the present study investigated various material characteristics and load types applied to ID fan foundations in cement plants. However, further research may be needed to verify our findings and to determine the effects of other factors.
6. Conclusion
The lifetime of ID fan foundations in cement plants is of utmost economic importance. The analysis, design, and implementation of this type of foundations should thus provide maximum confidence and operational safety. Developing FEMs for all parts, especially the foundation, of an ID fan can lead to better performance under static and dynamic loadings. Such models can also determine the effects of various material characteristics on the stresses and deflections in all directions.
In the analyses of static and dynamic loads, deflection and stress values in all directions, particularly in the Y axis, were lower than the yield stress of concrete and steel. However, due to the harmonic dynamic loading, especially for frequencies between 6 and 19 Hz, fatigue might reduce the lifetime of concrete foundations. Fatigue could also increase stress to exceed the tolerable level. As a result, cracks would be formed and damage would occur in critical points.
Moreover, increasing Ec from 20 to 30 GPa and Es from 200 to 300 GPa reduced stress and deflection in the Y axis by 35% and 8%, respectively. Furthermore, circular ducts were 15% more effective than rectangular ducts in both static and dynamic cases.
From the FEM, for a certain ID fan, the stress and deflection under dynamic loading are respectively 2.5 and 10 times greater than those under static loading. Maximum displacements and stresses used in modeling and static and dynamic analyses were close to reality. This emphasizes the importance of dynamic analysis of structures.
References
- [1] N. Leso, J. Puttonen, E. Porkka; The effect of foundation on fan vibration response; J. Struct. Mech., 44 (1) (2011), pp. 1–20
- [2] D.R. Smith, H.R. Simmons; Unique fan vibration problems: their causes and solutions; Proceedings of the 9th Turbomachinery Symposium Gas Turbine Laboratories (1980)
- [3] D. Smith, J. Wachel; Controlling fan vibration—case histories; EPRI Symposium on Power Plant Fans: The State of the Art (1981)
- [4] R. Galindo, M. Illueca, R. Jimenez; Permanent deformation estimates of dynamic equipment foundations: application to a gas turbine in granular soils; Soil Dyn. Earthq. Eng., 63 (2014), pp. 8–18
- [5] P. Nawrotzki, G. Hüffmann, T. Uzunoglu; Static and dynamic analysis of concrete turbine foundations; Struct. Eng. Int., 18 (3) (2008), pp. 265–270
- [6] C. Rebelo, et al.; Comparative life cycle assessment of tubular wind towers and foundations–Part 1: Structural design; Eng. Struct., 74 (2014), pp. 283–291
- [7] M. Dias Jr., K.L. Cavalca; Experimental analysis of the dynamic behaviour of a turbomachine foundation structure; rn, 8 (1) (1999), p. 9
- [8] M. Zaaijer; Foundation modelling to assess dynamic behaviour of offshore wind turbines; Appl. Ocean Res., 28 (1) (2006), pp. 45–57
- [9] B.T. Cease; Using vibration analysis to identify & help correct an ID fan foundation problem; Vib. Inst. Annu. Train. Conf. (2014)
- [10] R. Thompson, D. Wong; Boiler induced draft fan optimisation; Int. Sugar J., 113 (1350) (2011), pp. 425–431
- [11] R.J. Sayer; Structural dynamics of centrifugal fans; Proceedings of the National Technical Training Symposium and 34th Annual Meeting of the Vibration Institute, Oak Brook, IL (2010)
- [12] R.J. Sayer; Finite element analysis–a numerical tool for machinery vibration analysis; Sound Vib., 38 (5) (2004), pp. 18–21
- [13] Singleton, K., 2014. Case Study Analysis of Centrifugal Fan High Amplitude Vibration.
- [14] M. Novak; Foundations for shock-producing machines; Can. Geotech. J., 20 (1) (1983), pp. 141–158
- [15] S. Prakash, V.K. Puri; Foundations for vibrating machines; J. Struct. Eng., 33 (1) (2006), pp. 13–29
- [16] COMITTE, A. 351.3 R-04, 2004. Foundations for Dynamic Equipment. In American Concrete Institute.
- [17] G. Beim, G. Likins; Worldwide dynamic foundation testing codes and standards; Proceedings of the Eighth International Conference on the Application of Stress Wave Theory to Piles (2008)
- [18] EN, B., 1-1 (2004). Design of Concrete Structures. Part 1.1: General Rules 5 and Rules for Buildings. British Standards Institution. London; 1992.
- [19] Eurocode, C., 1993. 3: Design of Steel Structures. DRAFT prEN.
- [20] Deolalkar, S., 2009. Handbook for Designing Cement Plants.
- [21] Hibbitt, Karlsson, Sorensen; ABAQUS/Standard User’s Manual, vol. 1, Hibbitt, Karlsson & Sorensen (2001)
- [22] Bognøy, E., Vee, V., Mo, T.M.S., 2014. Fatigue Capacity of Partially Loaded Areas in Concrete Structures Submerged in Water.
- [23] A. Cunha, E. Caetano; Experimental modal analysis of civil engineering structures; Sound Vib., 40 (6) (2006), pp. 12–20
- [24] G. Gazetas; Analysis of machine foundation vibrations: state of the art; Int. J. Soil Dyn. Earthq. Eng., 2 (1) (1983), pp. 2–42
- [25] G. Gazetas; Foundation vibrations; Foundation Engineering Handbook, Springer (1991), pp. 553–593
- [26] A. Ghali, R. Favre, M. Elbadry; Concrete Structures: Stresses and Deformations: Analysis and Design for Serviceability; CRC Press (2006)
- [27] S. Valliappan, A. Hakam; Finite element analysis for optimal design of foundations due to dynamic loading; Int. J. Numer. Meth. Eng., 52 (5–6) (2001), pp. 605–614
- [28] Y.-L. Lee; Fatigue Testing and Analysis: Theory and Practice, vol. 13, Butterworth-Heinemann (2005)
- [29] A. Fatemi, L. Yang; Cumulative fatigue damage and life prediction theories: a survey of the state of the art for homogeneous materials; Int. J. Fatigue, 20 (1) (1998), pp. 9–34
- [30] J. Seo, J.S. Jang, D. Bai; Lifetime and reliability estimation of repairable redundant system subject to periodic alternation; Reliab. Eng. Syst. Saf., 80 (2) (2003), pp. 197–204
- [31] F. Barpi, et al.; Lifetime of concrete dam models under constant loads; Mater. Struct., 32 (2) (1999), pp. 103–111
- [32] N. Jungbluth, et al.; Life cycle assessment for emerging technologies: case studies for photovoltaic and wind power (11 pp); Int. J. Life Cycle Assess., 10 (1) (2004), pp. 24–34
- [33] F. Akgül, D.M. Frangopol; Lifetime performance analysis of existing reinforced concrete bridges. II: Application; J. Infrastruct. Syst., 11 (2) (2005), pp. 129–141
- [34] F. Akgül, D.M. Frangopol; Lifetime performance analysis of existing prestressed concrete bridge superstructures; J. Struct. Eng., 130 (12) (2004), pp. 1889–1903
- [35] T.K. Hsieh; Foundation vibrations; ICE Proceedings, Thomas Telford (1962)
- [36] F. Richart; Foundation vibrations; Trans. Am. Soc. Civ. Eng., 127 (1) (1962), pp. 863–897
- [37] F. Richart Jr.; Foundation vibrations; J. Soil Mech. Found. Div., 86 (4) (1960), pp. 1–34
Document information
Published on 12/04/17
Licence: Other
Share this document
Keywords
claim authorship
Are you one of the authors of this document?

