Abstract
This article presents an innovative façade system designed to increase the thermal comfort inside an office room and to enhance the cooling capacity of the suspended cooling ceiling. A series of measurements is conducted in an existing office building with different façade systems (i.e., a combination of glazing and shading). An innovative façade system is developed based on this intensive set of measurements. The new system enhances the thermal comfort and cooling capacity of the suspended cooling ceiling. The main usage of the new system is the refurbishment and improvement of existing façade systems.
Keywords
Office building ; Innovative façade systems ; Cooled ceiling ; Increase in the cooling capacity of cooled ceiling ; Interaction of building envelope and cooled ceiling ; Effect on comfort
1. Introduction
In accordance with building standards, massive changes in the field of energy-efficient buildings have occurred in the last ten years. The goal of such changes is to develop plus-energy buildings (residential and non-residential) and the vision behind them is to build plus-energy districts and cities. Their primary focus is the energy efficiency of buildings.
Research and development in the field of sustainable design have led to the improvement of methods, design processes, and products. On the one hand, detailed studies have been conducted on the efficiency of façade systems and their influence on buildings, such as reviews of solar façades (Quesada et al., 2012 ) and the effect of multi-skin façades on energy demand (Radhi et al., 2013 ). Hamza (2008) investigated the effect of different façade systems on energy demand and compared double-skin façades with single-skin façades. Hien et al. (2005) and Shameri et al. (2011) discussed the details of double-skin façades. Mathematical models for the detailed calculation of façade systems have also been developed; for example, Ghadamian et al. (2012) described the analytical solution to the energy modeling of double-skin façades.
On the other hand, detailed studies have been conducted on the behavior and efficiency of cooling ceilings and their effect on rooms. Examples include the work of (Causone et al., 2009 ), which described the experimental evaluation of heat transfer coefficients between the radiant ceiling and room, and the experimental evaluation of cooling capacity by Andrés-Chitote et al. (2012) . Beck (2002) described the thermal behavior of cooling ceilings. Glu¨ck, 1999 ; Glück, B., 2003 elucidated the heat transfer coefficients of cooling ceilings. TABS Control provides a good summary and overview of the possible control strategies for the energy-efficient operation of thermal-activated building elements ( To¨dtli, 2009 ).
Schittich (2001) states that the façade should be treated not only as a decorative layer but also as a responsive skin. Lang (Schittich, 2001 ) extended this idea and suggested that the building skin by definition should be treated not as a skin but as a system that interacts with the entire building and building-service systems, given that it fulfills a huge range of functions and is one of the main influencing factors on energy demand.
The total system—the façade and its interaction with the cooling ceiling capacity—is the main topic of the present work. The effects of different façade systems on the performance of the cooling ceiling and cooling capacity of the ceiling are researched. Fonseca et al. (2010) described the effect of a radiant ceiling system coupled on its environment and found that the façade influences the cooling ceiling capacity.
The assumption of this research is that new concepts are accepted and deemed successful based on whether or not they significantly improve the comfort of users relative to the comfort provided by conventional systems. The cooling ceiling guarantees high comfort because of the high proportion of radiation. However, the limits of the cooling capacity of a cooling ceiling are often reached in a typical office building design, such as in Austria. Given the combination of high glass content and high internal heat gains, the cooling capacity insufficiently guarantees a room temperature of 26 °C.
Determining the resulting thermal comfort is an important issue in the design of façade systems. For highly glazed office spaces, the correct calculation of the local heat balance is an important factor but is not often well known. The provision of comfort using EN ISO 7730, (2005) can lead to an underestimation of the operative temperature if direct solar radiation is not considered. The measurement of the cooling capacity according to DIN EN 14240 (2004) is conducted independent of the external effects of radiation (i.e., the boundary conditions are defined by the temperatures of surrounding surfaces). The calculation of the cooling load according to VDI 2078 (1996) can lead to incorrect calculation results. The influence of cooled surfaces on the cooling load is discussed in VDI 2078 Sheet 1 (2003) . Given this regulation, a qualitative correction of the calculation is conducted based on the results of the main calculation method according to VDI 2078 (1996) . The present study measures the performance of a cooling ceiling in an existing office building under different façade types to determine the effects of different façade systems on operative temperatures, cooling capacity, and comfort; the results are presented below.
According to EN 15255 (2007) , calculating the dynamic cooling load requires that surface temperatures be calculated according to EN 15377-1 (2009) for surface cooling systems. The calculation is divided into four classes, and a class 4 calculation must be conducted for surface cooling systems. EN 15255 (2007) provides the basis for a simplified dynamic calculation of the cooling load.
The measurement results are intended to be the basis for developing a method of mathematical calculation of cooling capacity in relation to innovative/different façade systems.
2. Building/room setup
A series of measurements was conducted in an existing office building located in Vienna, Austria; this building had different façade systems. The 34th floor consists of four identical rooms with an area of approximately 10.8 m2 each. The façade is a west-orientated and totally glazed surface. Given that the rooms are situated on the 34th floor, they are not shaded by other buildings or geographical surroundings.
Figure 1 shows the floor plan of the test rooms. The rooms are adjacent to one another and are separated by a gypsum plasterboard wall. Rooms 01 and 04 are adjacent to an open-space office area, which was empty during the measurement period. The floor is a raised floor and is open throughout the entire story because of its air leading properties (i.e., the supply of air is realized over the raised floor). The floor cannot be closed; otherwise, the test rooms will not obtain fresh air. The suspended ceiling of the measurement rooms is separated by a foreclosure (mineral wool) around and between these rooms. The configuration of the test rooms is typical for a single-person office.
|
|
|
Figure 1. Floor plan of the test rooms. |
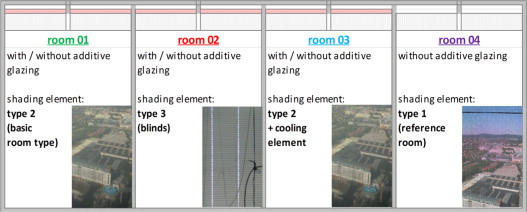
One of the rooms was used as a reference room (room 04). In this room, the boundary conditions (façade, shading, and cooling systems) were not changed. The other rooms served as the test rooms, where different setups were established by varying the façade, shading, and cooling systems.
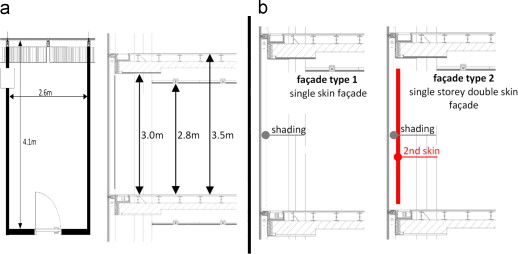
The dimensions of the room are visualized in Figure 2 (a). The left side shows the floor plan of one room, which has a room depth of 4.10 m and a width of 2.6 m. The right side shows the section view and marks the main heights. The room height of the occupied area of the room is 2.8 m, the height of the façade area is 3.0 m, and the floor height is 3.5 m.
|
|
|
Figure 2. (a) Room dimensions: floor plan of the measurement room (left side) and section view of the measurement room (right side) and (b) section view of the single-skin façade (left side) and the single-story double-skin façade (right side). |
2.1. Basic building information
Located in Vienna, Austria, the office building is a tower with a fully glazed façade. The U-values of the room envelope as obtained from the planning documents are as follows:
- glazing: U =1.10 W/m2 K
- frame (percentage 8%): U =2.95 W/m2 K
- ceiling/floor: U =1.47 W/m2 K
- interior wall (gypsum cardboard): U =0.65 W/m2 K
- interior door: U =1.80 W/m2 K
Different façade systems may be tested by changing the shading element and adding a second internal glazing element. The details of the façade system are given in Section 2.2 .
2.2. Façade system
Four rooms were used for the measurements. One of them was used as a reference room, which meant that the conditions in this room were not changed during the entire period of measurement. The basic setup was a single-skin façade and a fully closed screen (shading system 1). The optical properties of the different shading systems are summarized in Table 1 .
| Optical properties | Facade (single skin) | Shading system 1 | Shading system 2 | Shading system 3 |
|---|---|---|---|---|
| Solar transmittance τ | 0.33 | 0.19 | 0.11 | 0.08 |
| Reflectance ρ | 0.41 | 0.37 | 0.39 | 0.39 |
| Absorptance outside pane αc | 0.25 | |||
| Absorptance inside pane αi | 0.01 | |||
| Absorptance α | 0.44 | 0.50 | 0.54 | |
| Light transmittance τL | 0.19 | 0.10 | 0.07 | |
| Total energy transmittance g -value | 0.36 |
The following four façade systems were tested. Schematic overviews of the single-skin façade and the single-story double-skin façade are shown in Figure 2 (b).
- Façade system 1: single-skin façade with shading system 2
- Façade system 2: single-story double-skin façade with shading system 2
- Façade system 3: single-skin façade with shading system 3
- Façade system 4: single-story double-skin façade with shading system 3
The single-skin façade consists of an outside pane with 6 mm coated glass, an Argon-filled gap of 16 mm, and a second glass layer of 10 mm laminated safety glass. The heat transfer coefficient of the construction is U =1.29 W/m2 K. The single-story double-skin façade consists of an additional glazing element (an insulation glass pane) with a heat transfer coefficient of U =1.10 W/m2 K.
One of the key points of the measurement was the variation in the total energy transmittance as a result of the change in the façade system. The total solar energy transmittance g-value of the glazing was g =0.36 according to the technical data sheet. The total g-value (glazing+shading) was measured by an accredited laboratory. The g-value was determined according to the draft standard prEN 13363-1 (2007) and DIN EN 410, (2011) . The results show that the entire system had a g-value of 0.22 (glazing and shading) according to DIN EN 410 (2011) and a g-value of 0.29 according to prEN 13363-1 (2007) . The ventilation of the façade was one of the important points because of the second internal glazing. The basic idea of increasing the cooling capacity is similar to the effect described in EN 13363-2 (2005) .
2.3. Cooling
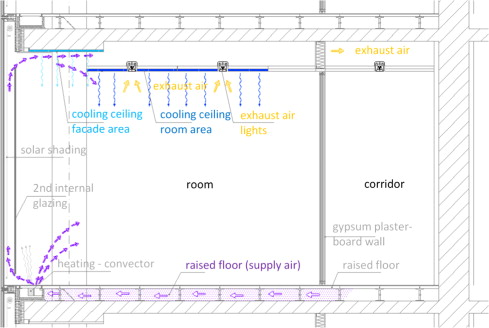
The energy supply is a conventional system. Two chillers (2900 kW each) are available for the cooling of the building; the re-cooling units are situated on the top of the building. The cooling of the rooms is achieved through a suspended cooled ceiling with capillary pipe mats, which are placed in the suspended ceiling panels. The cooling area is split into a façade and room area. The cooling medium temperature varies between 14 °C and 19 °C depending on the ambient temperature. A schematic overview of the cooling area is shown in Figure 3 . The parts related to the cooling ceiling are highlighted in blue: the cooling ceiling of the façade area is highlighted in light blue, and that of the room area in dark blue.
|
|
|
Figure 3. Schematic overview of the cooling and ventilation systems of the measurement rooms. |
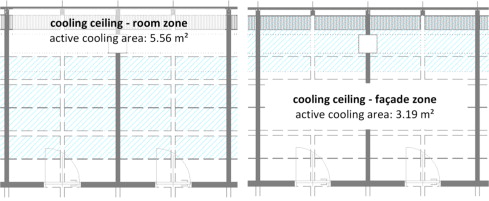
According to DIN EN 14240 (2004) , the cooling capacity is referenced to the active cooling area and not to the room area. Figure 4 highlights the different areas and shows that the cooling area related to the room zone overlaps with the cooling area related to the façade zone. Thus, a high capacity exists next to the façade.
|
|
|
Figure 4. Active cooling area: room area (left side) and façade area (right side). |
The left side of Figure 4 shows the active cooling area of the cooling ceiling of the room area; four rows of ceiling panels are activated. However, the first row next to the corridor is not activated. The columns cause no reduction in the cooling area of the room area. The active area of the cooling ceiling in the room area for the two-axis measurement rooms is 5.56 m2 .
The right side of Figure 4 shows that three ceiling panels are occupied by the façade toward the corridor with capillary pipe mats. This area describes the cooling ceiling of the façade area. In every fourth window axis, the cooling area is reduced by a column. The active area of the cooling ceiling in the façade area for the two-axis measurement rooms is 3.19 m2 .
Each of the two-axis measurement rooms generally has an active cooling area of 8.75 m2 . Based on the room area, the rate of cooling area is approximately 80%.
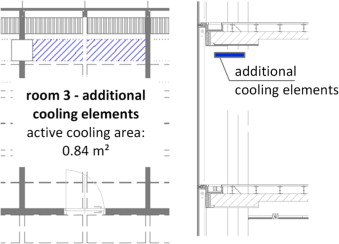
One room was tested with additional cooling elements, which were placed in the area next to the façade. Given the additional cooling elements, the cooling area increased by 0.84 m2 ; Figure 5 highlights the additional area.
|
|
|
Figure 5. Schematic overview of the positioning of the additional cooling elements: floor plan (left side) and section view (right side). |
2.4. Ventilation
Fresh air is supplied by a mechanical ventilation system, which consists of full air conditioning–heating, cooling/dehumidification, and humidification. Given the height of the building and the single-skin façade, natural ventilation by windows is not possible. A schematic overview of the ventilation system of the test rooms is shown in Figure 3 .
The air supply of the rooms is realized through the raised floor; the entire floor is air leading. The air outlet is over the “slot diffusors” next to the façade. Each room has a flow rate of approximately 50 m3 /h and a supply air temperature of approximately 21 °C.
The exhaust air is realized by the exhaust air lights. Flexible ducts exist between the lights and the suspended ceiling in the corridor. The suspended ceiling in the corridor is also air leading.
3. Measurement setup
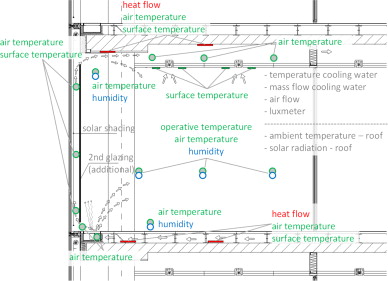
A schematic overview of the measurement equipment for the rooms is shown in Figure 6 . The measurement interval is 1 min, and the measurement parameters are as follows:
- operative temperature
- air temperature
- surface temperature
- humidity
- heat flow
- flow and return temperature of the cooling medium
|
|
|
Figure 6. Measurement equipment of the test rooms. |
The mass flow of the cooling medium and the air flow are periodically measured. The main measurement points for the operative temperature and the cooling capacity are also described below because they are essential to the presented work.
The flow and return temperatures of the cooling medium are measured by temperature sensors. The mass flow is measured by a differential pressure meter that is compatible with the mounted valves. Control measurements are conducted by an ultrasonic flow measuring meter. The measurement points for the flow and return temperature of the cooling medium and the mass flow are shown in Figure 7 (blue points). The operative temperature is measured by a globe thermometer at different depths of the room by PT1000 temperature sensors in a black ball with a diameter of 100 mm, each at a height of 1.20 m. A schematic overview of the measurement points is shown in Figure 7 (red points).
|
|
|
Figure 7. Measurement flow/return temperature (blue points), where TC is the temperature sensors/measurement operative temperature (red points) and PT is the temperature sensors (PT1000) of the air temperature. |
The ambient temperature, humidity, and radiation on the west façade are measured every minute at the roof of the building. The effect of the internal loads is realized by a heat mat with a load of approximately 45 W/m2 and is activated by a timer. The operating time is from 8 A.M. to 12 P.M. and from 1 P.M. to 5 P.M.
4. Results
4.1. Adjustment of the rooms
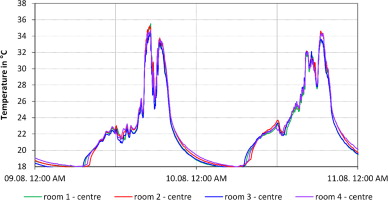
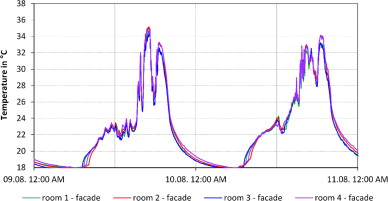
The rooms were adjusted before testing the different room setups. The comparison of the operative temperatures is shown in Figure 8 (middle of the room) and Figure 9 (1 m from the façade). The temperatures (approximately 36 °C) were high because the room temperatures were measured without the shading elements. For this measurement, all rooms were measured with the single-skin façade. Figure 8 and Figure 9 indicate that the temperature difference between the rooms was acceptable for further measurements. The maximum temperature difference was 0.8 K, and the average temperature difference was 0.2 K for both measurement locations (i.e., center of the room and next to the façade).
|
|
|
Figure 8. Comparison of the operative temperature in the test and reference room: center of the room. |
|
|
|
Figure 9. Comparison of the operative temperature in the test and reference room: façade. |
4.2. Measurement variation: description of room types
The aim of the measurements was to determine the influence of a cooled ceiling on the operative temperature and cooling capacity by changing the following elements of the room setup:
- change in shading system
- additional internal glazing
- additional cooling elements
A total of seven different room configurations were tested. The different room setups are summarized in Table 2 . The room setup with façade system 1 (single-skin façade), screen type 2, and without additional glazing element was the room with basic conditions (Variation 1) and was used as the basis of comparison for the measurement of the other room types. The conditions of the reference room (façade system 1 – single-skin façade, and shading system 1–screen type 1) were not changed during the entire measurement period to ensure that the measurements of the different room configurations were comparable with one another.
| Name | Room | Façade | Screen | Additional cooling element | Short description |
|---|---|---|---|---|---|
| Reference | 4 | System 1 | Type 1 | – | |
| Variation 1 | 1 | System 1 | Type 2 | – | |
| Variation 2 | 1 | System 2 | Type 2 | – | |
| Variation 3 | 2 | System 1 | Type 3 | – | Variation 1 – different shading |
| Variation 4 | 2 | System 2 | Type 3 | – | Variation 2 – different shading |
| Variation 5 | 3 | System 1 | Type 2 | Yes | Variation 1 +cooling element |
| Variation 6 | 3 | System 2 | Type 2 | yes | Variation 2 +cooling element |
In the following diagrams, the purple line shows the results for the reference room (type 0), the green lines the results for Variations 1 and 2, the red lines for Variations 3 and 4, and the blue lines for Variations 5 and 6.
4.3. Operative temperature
According to EN ISO 7730 (2005) , the operative temperature is determined as the average air temperature and radiant temperature. This temperature is to be measured with a globe thermometer according to EN ISO 7726, (1998) . The standard ball has a diameter of dk =150 mm and an emissivity of ε =0.95. Regarding the shape and the diameter of the ball, discussions and various statements have been conducted on what shape, size, and color best represent the human being. For the measurements of the operative temperatures in this case, black balls with a diameter of dK =100 mm were used.
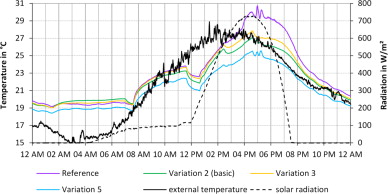
Figure 10 shows the different operative temperatures of four different room configurations on a warm sunny day. The diagram shows the comparison of the reference room and Variations 2, 3, and 5. The results show a temperature difference of approximately 4 K because of the different room setups (i.e., façade+shading system, additional cooling element). The average temperature difference during working hours (i.e., the occupancy schedule is from 8 A.M. to 5 P.M.) is 1.2 K. The average temperature difference for a 24 h period is 1 K. The black line represents the ambient temperature, and the dotted gray lines represent the solar radiation (global; beam+diffuse) on the west façade.
|
|
|
Figure 10. Operative temperature: center of the room. |
The operative temperature is one of the factors that influence comfort. EN ISO 7730 (2005) indicates three categories (A, B, and C) with different acceptance of predicted percentage of dissatisfied people (PPD). The maximum operative temperature in summer should be lower than 26 °C to reach category B, that is, a PPD of less than 10%.
The measurement results of the operative temperatures of the different room types can be compared using the conditions of the reference room. Each room configuration was measured twice: the first measurement with the shading elements fully closed, and the second with the shading elements only half-closed. In the first measurement period, the shading element was mostly used to avoid blinding, but it was only half-closed to maintain the view.
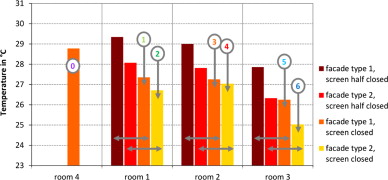
The summary of the measured maximum operative temperatures and temperature differences relative to those of the reference room is shown in Table 3 and Figure 11 . The measurement results show a decrease of 1.4 K because of the change in the screen type (from type 1 to type 2). For the single-skin façade, the change from screen type 2 to screen type 3 caused an increase of 0.1 K (comparison of Variations 1 and 3). The results for the double-skin façade show an increase of 0.3 K (comparison of Variations 2 and 4). These two shading systems are equal in terms of the operative temperature in the room center. The comparison of the results for the operative temperature with and without second internal glazing shows a temperature difference of 0.7 K (both measurements with screen type 2, comparison of Variations 1 and 2). With the additional cooling elements, the operative temperature decreased by 1.2 K (comparison of Variations 1 and 5). The results for the single-story double-skin façade show a decrease in operative temperature of 1.7 K because of the additional cooling element (comparison of Variations 2 and 6). The results for the half-closed screen have the same tendency, but the temperature differences were higher than those of the fully closed screen, as shown in Table 3 and Figure 11 . Figure 12
| Ref | Var1 | Var2 | Var3 | Var4 | Var5 | Var6 | |
|---|---|---|---|---|---|---|---|
| Temperature – totally closed | 28.8 °C | 27.4 °C | 26.7 °C | 27.3 °C | 27.0 °C | 26.2 °C | 25.0 °C |
| Temperature difference | – | −1.4 K | −2.1 K | −1.5 K | −1.7 K | −2.5 K | −3.8 K |
| Temperature – half closed | – | 29.3 °C | 28.1 °C | 29.0 °C | 27.8 °C | 27.9 °C | 26.3 °C |
| Temperature difference | – | +2.0 K | +1.4 K | +1.7 K | +0.8 K | +1.6 K | +1.3 K |
|
|
|
Figure 11. Measurement results for the operative temperatures: room center. |
|
|
|
Figure 12. Measurement results for the operative temperatures: 1 m from the façade. |
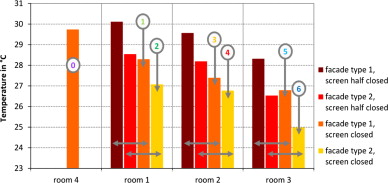
The measurement results next to the façade (distance of 1 m from the façade at the beginning of the working area) are shown in Figure 17. The summary of the measured temperatures and temperature difference relative to those of the reference room is shown in Table 4 . A change in the shading system from shading type 1 to shading type 2 (comparison of reference room and Variation 1) caused the same temperature reduction as in the room center (1.4 K). The tendency of temperature reduction at the measurement position next to the façade shows higher values than that at the position in the room center. The comparison of Variations 1 and 2 shows a temperature decrease of 1.2 K as a result of the change from single-skin to double-skin façade (i.e., from 28.3 °C (Variation 1) to 27.1 °C (Variation 2)). For the single-skin façade, the change from screen type 2 to screen type 3 caused a decrease of 0.9 K (comparison of Variations 1 and 3). The results for the double-skin façade show a decrease of 0.3 K (comparison of Variations 2 and 4). With the additional cooling element, the maximum operative temperature decreased by 2.9 K (comparison of reference room and Variation 5). The results for the single-story double-skin façade show a reduction in the operative temperature of 2.1 K because of the additional cooling element (comparison of Variations 2 and 6).
| Ref | Var1 | Var2 | Var3 | Var4 | Var5 | Var6 | |
|---|---|---|---|---|---|---|---|
| Temperature – totally closed | 29.7 °C | 28.3 °C | 27.1 °C | 27.4 °C | 26.8 °C | 26.8 °C | 25.0 °C |
| Temperature difference | – | −1.4 K | −2.7 K | −2.3 K | −3.0 K | −2.9 K | −4.8 K |
| Temperature – half closed | – | 30.1 °C | 28.5 °C | 29.6 °C | 28.2 °C | 28.3 °C | 26.5 °C |
| Temperature difference | – | +1.8 K | +1.5 K | +2.2 K | +1.4 K | +1.5 K | +1.5 K |
4.4. Cooling capacity of the cooled ceiling
The basis for the measurement of the cooling capacity of cooling ceilings is DIN EN 14240 (2004) . The measurements presented in this work were obtained from an existing office building and not from test plant conditions. The surrounding surfaces of the measured rooms constituted the system boundary.
The cooling capacity was based on the average temperature difference between the operative temperature in the room center and the mean medium temperature:
|
|
( 1) |
where ti is the reference temperature (i.e., operative temperature in the room center) in °C, tV is the flow temperature of the cooling water in °C, and tR is the return temperature of the cooling water in °C.
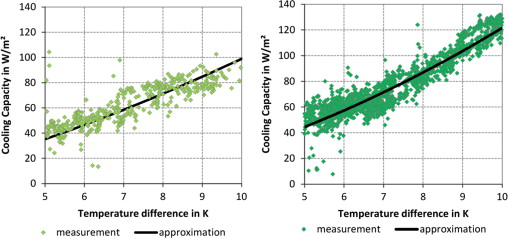
The calculation of the specific cooling capacity was based on the active cooling area. The procedure was based on the measurement results of the flow and return temperature and the mass flow rate of the cooling ceiling. Figure 13 shows the measurement results for the cooling capacity relative to the temperature difference between the operative temperature in the room center and the mean medium temperature for Variations 1 (left diagram) and 2 (right diagram). The dots represent the measurement results, and the black line the resulting approximation. The approximation was calculated as a polynomial because linear approximation is insufficient for the variations with additional cooling elements. The comparison of the diagrams shows that Variation 2 has a higher cooling capacity than Variation 1.
|
|
|
Figure 13. Measurement/approximation of the cooling capacity: Variation 1–single-skin façade (left side) and Variation 2–single-story double-skin façade (right side). |
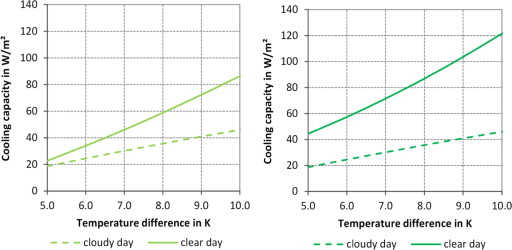
The cooling capacity of the different room setups (Variations 1–6) was measured on a clear sunny day and on a cloudy day. Sunny days are defined by the presence of incident solar radiation on the façade. In this case, the solar radiation was between 500 and 600 W/m2 on the west-oriented façade. The measurements were performed between 2 and 5 P.M. Cloudy days are defined by the absence of direct solar radiation. The difference between the cooling capacities of Variations 1 (left diagram) and 2 (right diagram) on these two days is shown in Figure 14 . The dotted line represents the cloudy day, where the main effect was due to the internal loads and another effect due to diffuse radiation. The line is rather flat, and only a small difference exists between the two variations. The green lines represent the approximation of the measurement results for the cooling capacity on a clear sunny day. The figure shows a significant increase caused by the solar effect and a difference between Variations 1 (single-skin façade) and 2 (single-story double-skin façade).
|
|
|
Figure 14. Measurement results for the cooling capacity: Variation 1–single-skin façade (left side) and Variation 2–single-story double-skin façade (right side). |
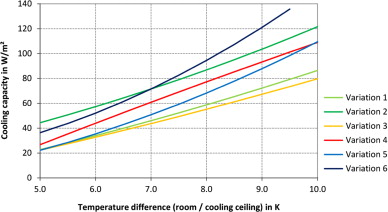
The measurement results show that different façade systems have an effect on the cooling capacity. The change from single-skin façade to single-story double-skin façade causes an increase of approximately 30 W/m2(cooling area) (comparison of Variations 1 and 2). The different shading systems (shading types 2 and 3) of Variations 1 and 3 show similar results for the cooling capacity (difference of 5 W/m2(cooling area) ). A comparison of Variations 2 and 4 (shading types 2 and 3 with the single-story double-skin façade) indicate a difference of approximately 10 W/m2(cooling area) . The effect of the additional cooling element is an increase of approximately 15 W/m2(cooling area) for the single-skin façade (Comparison of Variations 1 and 5) and 18 W/m2(cooling area) for the single-story double-skin façade (Comparison of Variations 2 and 6). The resulting cooling capacities of the different room systems are shown in Figure 15 .
|
|
|
Figure 15. Comparison of the resulting cooling capacity of the different room configurations (Variations 1 to 6). |
5. Summary and outlook
This study tested different room configurations using an intensive set of measurements to determine the effect of different façade systems on the operative temperature at the center of the room and close to the façade and the resulting cooling capacity of the cooling ceiling. The room conditions were tested by varying the following elements of the boundary conditions:
- change in the shading system
- additional internal glazing: change from single-skin façade to single-story double-skin façade
- additional cooling elements
The measurement results of the operative temperatures show an effect caused by the façade type. The temperature difference between the “worst case” and the “best case” scenario is 3.8 K in reference to the room center (4.7 K next to the façade). The results of the calculated effect on the cooling capacity show an increase of approximately 15 W/m2(cooling area) because of the additional cooling element. The change from single-skin façade to single-story double-skin façade leads to an increase of approximately 30 W/m2(cooling area) in the cooling capacity.
The measurement results show an increase in the cooling capacity because of the different room setups (façade systems). The assumption that the capacity increase is caused by a high air flow rate over the ceiling and therefore a high convection load can be verified using the mathematical model and is one of the topics that should be analyzed further.
An additional cooling element is needed to achieve the required cooling capacity, particularly a room temperature of 26 °C. In terms of comfort, further investigations concerning the cooling element must be conducted. The change from single-skin façade to single-story double-skin façade is a good method of increasing the cooling capacity. However, the room temperatures in the tested configurations remain above 26 °C. Aside from temperature reduction, another benefit is a significant change in comfort within the rooms because of the second glazing element. The research results also show the possibilities and limits of the cooling capacity of a cooling ceiling in retrofitting an existing building.
Acknowledgements
The doctoral program “Energy Systems 2030 (ENSYS 2030)” is an internal research project funded by the Technical University of Vienna . Its main goal is to provide doctoral students of the research area “Energy and Environment“ a remarkably structured and interdisciplinary education. Ten PhD positions are advertised and supported as part of the College of the Technical University of Vienna .
“Energy and Environment” is part of the development plan of the Vienna University of Technology 2010+ and is one of the five research priorities. The doctoral program ENSYS2030 has the following key themes: solar energy, energy storage, electro mobility, and energy active building.
References
- Andrés-Chicote et al., 2012 M. Andrés-Chicote, A. Tejero-González, E. Velasco-Gómez, F.J. Rey-Martínez; Experimental study on the cooling capacity of a radiant cooled ceiling system; Energy Build., 54 (2012), pp. 207–214
- Beck, 2002 C. Beck; Thermisches Verhalten von Ku¨hldecken; (Dissertation) IKE, Lehrstuhl fu¨r Heiz- und Raumlufttechnik, Stuttgart (2002)
- Causone et al., 2009 F. Causone, S.P. Corgnati, M. Filippi, B.W. Olesen; Experimental evaluation of heat transfer coefficients between radiant ceiling and room; Energy Build., 41 (2009), pp. 622–628
- DIN EN 410, 2011 DIN EN 410, 2011. Glass in building – Determination of luminous and solar characteristics of glazing.
- DIN EN 14240, 2004 DIN EN 14240, 2004. Ventilation for buildings – Chilled ceilings Testing and rating; German version EN 14240:2004.
- EN 13363-1, 2007 EN 13363-1, 2007. Solar protection devices combined with glazing – Calculation of solar and light transmittance – Part 1: Simplified method.
- EN 13363-2, 2005 EN 13363-2, 2005. Solar protection devices combined with glazing – Calculation of total solar energy transmittance and light transmittance – Part 2: Detailed calculation method.
- EN 15255, 2007 EN 15255, 2007. Energy performance of buildings – Sensible room cooling load calculation – General criteria and validation procedures.
- EN 15377-1, 2009 EN 15377-1, 2009. Heating systems in buildings – Design of embedded water based surface heating and cooling systems – Part 1: Determination of the design heating and cooling capacity.
- Fonseca et al., 2010 Fonseca, N., Cuevas, C., Lemort, V., 2010. Experimental analysis of radiant ceiling systems coupled to its environment. International High Performance Buildings Conference, Paper 3.
- Ghadamian et al., 2012 H. Ghadamian, M. Ghadimi, M. Shakouri, Meisam Moghadasi, Mohammad Moghadasi; Analytical solution for energy modeling of double skin façades building; Energy Build., 50 (2012), pp. 158–165
- Glu¨ck, 1999 B. Glu¨ck; Thermische Bauteilaktivierung: Nutzen von Umweltenergie und Kapillarrohren; C.F. Mu¨ller, Heidelberg (1999)
- Glück, B., 2003 Glück, B., 2003. Umweltsch onende Raumheizung und-kühlungmit Kunststoff-Kapillarrohrmatten, Research study. Fachinstitut Gebäude-Klimafunded research project: Förderung durch das Bundesministerium für Wirtschaft und Arbeit, Projektträger Jülich published: http://berndglueck.de
- Hamza, 2008 N. Hamza; Double versus single skin facades in hot arid areas; Energy Build., 40 (2008), pp. 240–248
- Hien et al., 2005 W.N. Hien, W. Liping, A.N. Chandra, A.R. Pandey, W. Xiaolin; Effects of double glazed facade on energy consumption, thermal comfort and condensation for a typical office building in Singapore; Energy Build., 37 (2005), pp. 563–572
- ISO 7726, 1998 ISO 7726, 1998. Ergonomics of the thermal environment – Instruments for measuring physical quantities.
- ISO 7730, 2005 ISO 7730, 2005. Ergonomics of the thermal environment – Analytical determination and interpretation of thermal comfort using calculation of the PMV and PPD indices and local thermal comfort criteria.
- Quesada et al., 2012 G. Quesada, D. Rousse, Y. Dutil, M. Badache, S. Hallé; A comprehensive review of solar facades. Transparent and translucent solar facades; Renew. Sustainable Energy Rev., 16 (2012), pp. 2643–2651
- Radhi et al., 2013 H. Radhi, S. Sharples, F. Fikiry; Will multi-facade systems reduce cooling energy in fully glazed buildings? A scoping study of UAE buildings; Energy Build., 56 (2013), pp. 179–188
- Schittich, 2001 C. Schittich (Ed.), Building Skins: Concepts, Layers, Materials, In detail (Edition Detail), Birkha¨user, Mu¨nchen, Basel (2001)
- Shameri et al., 2011 M.A. Shameri, M.A. Alghoul, K. Sopian, M.F.M. Zain, O. Elayeb; Perspectives of double skin façade systems in buildings and energy saving; Renew. Sustainable Energy Rev., 15 (2011), pp. 1468–1475
- To¨dtli, 2009 J. To¨dtli, Siemens-Aktiengesellschaft; TABS Control Steuerung und Regelung von thermoaktiven Bauteilsystemen; Handbuch fu¨r Planung, Auslegung und Betrieb; Faktor-Verl., Zu¨rich (2009)
- VDI 2078, 1996 VDI 2078, 1996. Calculation of cooling load and room temperatures of rooms and buildings (VDI Cooling Load Code of Practice).
- VDI 2078, 2003 VDI 2078 Blatt 1, 2003. Cooling load calculation of air-conditioned buildings with room-conditioning from cooled walls and ceilings
Document information
Published on 12/05/17
Submitted on 12/05/17
Licence: Other
Share this document
Keywords
claim authorship
Are you one of the authors of this document?
