Abstract
Compared with medium-sized cities, megacities play an increasingly important role in the rapid urbanization process in China. Owing to the expanding scale of large cities, urban sprawl leads to unsustainable practices that cause ecological, social, and environmental problems. Urban planning and land use planning are major driving forces of land use and land cover change in China. However, the goals of these two types of planning are different, and coordinating them is a challenge for local government decision makers. Thus, we use the SLEUTH model to simulate the implementation scenarios of future urban growth in Nanjing in the Jiangsu province of China. Using the scientific simulation data of the model, we contrasted the alternative futures of the two planning types for local government decision makers to achieve sustainable urban planning. The objective of our study is to explore the problems and possible solutions for urban management in the context of a megacity in China. The results of our study confirm the value of SLEUTH, which provides extensive exploratory knowledge in evaluating the effects of possible local government decisions.
Keywords
Urban growth ; Urban planning ; Land use planning ; SLEUTH ; Megacity ; Nanjing
1. Introduction
In the 21st century, large cities in China are confronted with great challenges related to environment and development. China has its own strategy for urban growth that is different from urban growth management in developed countries. The local government depends on urban planning and land use planning to manage urban growth. The urban and rural planning law is formulated to strengthen urban and rural planning administration; harmonize urban and rural spatial layout; improve people׳s living environment and promote the integrated, harmonious, and sustainable development of urban and rural society and economy. Most construction activities follow urban and rural planning. However, this situation leads to current development problems in large cities in terms of the following aspects. First, the urban planning is periodically affected by leadership changes. Second, the changing adjustment of administrative area influences the sequence of construction (Chen et al., 2009 ). Third, the management and control objectives of land use are not the same in different administrative sections. Fourth, the inflexible management system cannot adapt to the economic and social development of the expanded city (Qiu, 2006 ).
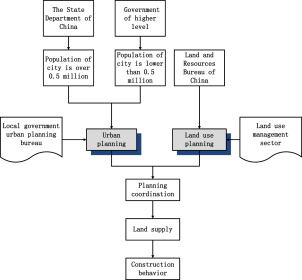
Two types of planning have a potential effect on the construction of cities: urban planning and land use planning. Urban planning, is laid down by the urban planning bureau of a particular city. If the population of a city is over 0.5 million, the urban planning, which is supervised by the local government, needs to be approved by the State Department of China (Figure 1 ). If the city population is less than 0.5 million, the plan needs to be approved by the government at a higher level. The land use planning of the city is laid down by the land use management sector of the local government and needs approval by the Land and Resources Bureau of China. Compared with land use planning, the city urban planning has the force of law while the other has not.
|
|
|
Figure 1.. Relationship of urban planning and land use planning in China (Author׳s illustration). |
The central planning practice in China is helpful for the compact urban form, but it presents a challenge to farmland protection and does not address unsustainable environmental practices (Xi et al., 2012 ). Scientifically setting the urban planning is critical for urban growth management in China׳s political system. The SLEUTH urban growth and land cover change model is an effective decision-support tool to analyze and provide rich exploratory knowledge for evaluating the effects of possible local government decisions (Clarke et al ., 1997 ; Clarke et al ., 2007 ; Dietzel and Clarke, 2007 ; Jantz et al ., 2010 ). Under the SLEUTH model, the simulation of Asian cities always obtains a lower correlation value because of the changing policies of urban development; this condition is different from that of North American or European cities, whose simulations provide a high correlation1 (Silva and Clarke, 2002 ), Still, the model can simulate most implementation scenarios in Northeast China and West China except the displacement, shrinkage, and disappearance of urban and rural construction land (Xi et al., 2012 ).
To explore the potential effects of implementing the urban planning and land use planning on urban space development and to provide decision support to local decision makers and land managers, the SLEUTH model was used to conduct simulation experiments with the objective of revealing the potential changes and problems in urban growth management. In this case study of Nanjing, we focus on exploring the management problems and solutions related to construction activities based on simulation data.
2. Materials and methods
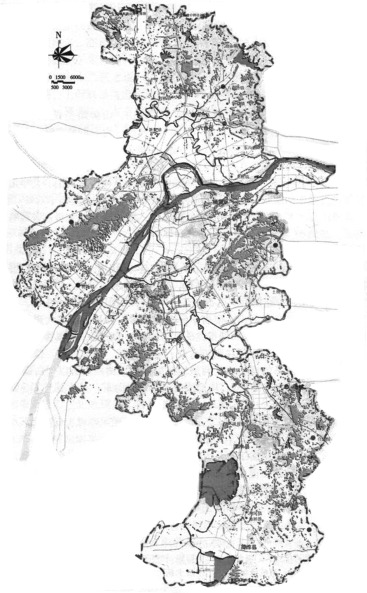
According to the urban scale grade in China, a large city is one with a population between 1 million and 5 million, and a megacity has a city population that exceeds 10 million. Nanjing, the capital city of Jiangsu province and the political, economic, and cultural center of the province, has a population of approximately 10 million. It is also one of the most important cities among the large cities of Southeast China (Figure 2 ). The characteristics of urban growth in large cities of Southeast China focus on the high speed of urban growth and its measure to control urban growth to achieve the goal of sustainable development. We believe that the urban growth process in Nanjing represents the characteristics of large cities in Southeast China. Thus, we simulate the urban growth of Nanjing in our case study.
|
|
|
Figure 2.. Topology of Nanjing (Su, 2008 ). |
2.1. Introduction to Nanjing
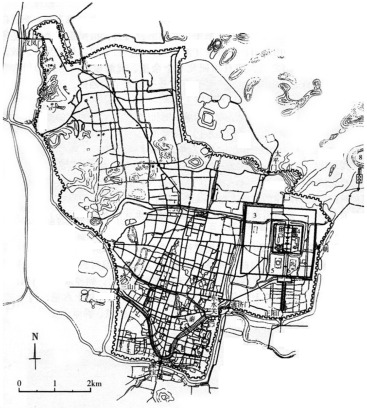
Nanjing, the capital city of Jiangsu province, is located in the lower reaches of Yangtze River Southeast of China. For almost 2000 years, Nanjing has witnessed some of the most significant events in Chinese history, including its position as national capital during the Six Dynasties (220–589 CE) and the Southern Song Dynasty (1127–1279 CE), the onset of the Ming Dynasty in 1368 by Zhu Yuanzhang who made Nanjing capital for almost two decades (Figure 3 ).
|
|
|
Figure 3.. Map of Nanjing during the Ming Dynasty, 1368–1393 CE (Nanjing Urban Planning Bureau; Su, 2008 ). |
Nanjing has jurisdiction over 11 districts, covering an area of 6582 sq. km. and having a population of about 82 million in 2013. Nanjing is an important industrial base that produces electronics, automobiles, chemicals, and a number of special products as the leading factors and having 36 industrial trades, over 200 industrial branches, and more than 2000 categories of products. The city is also a major international commercial port in the Yangtze delta region, second only to Shanghai. The total turnover of retail sales of social consumer goods in 1995 amounted to 24 billion yuan, placing Nanjing among 10 major cities in the country. The monetary market plays an important controlling role in the economic operations of the city.
2.2. SLEUTH urban growth modeling of Nanjing
2.2.1. SLEUTH urban growth model
SLEUTH is a cellular automaton (CA)-based urban growth model that uses historical geospatial data for calibration of parameters (Clarke et al ., 2007 ; Jantz et al ., 2010 ). The model has provided useful understanding of urban growth and its implications for planning policies, and it is one of the most widely used CA-based simulation models that focus on urban growth and development. The behavior of SLEUTH is controlled by five parameters, each with a possible integer value between 0 and 100. One set of five parameters is assumed to be the best set to mimic the behavior of an actual urban growth sequence. To select the best parameter set, model sequences are empirically compared against a series of control dates, that is, images of urban or land use sequences as they occurred in reality (Clarke et al ., 2007 ; O”Sullivan and Torrens, 2000 ). SLEUTH provides an effective framework for the study of land use change and urban growth. Urban growth can be understood as a complex system characterized by processes and behaviors based on self-organization, which lead to multiple non-linearities; thus, SLEUTH allows us to encapsulate these characteristics of urban systems (Batty, 2007 ).
2.2.1.1. Behavioral rules of SLEUTH model
The rules of SLEUTH are fixed, but they vary from complete to zero influence at each time step based on behavioral parameters. The five parameters (or coefficients) are critical to SLEUTH׳s application. Dispersion coefficient controls the number of times a pixel is randomly selected for possible urbanization. Breed coefficient determines the probability of a spontaneous growth pixel becoming a new spreading center. Spread coefficient determines the probability that any pixel that is part of a spreading center, that is, a cluster of urban pixels >2 in 3×3 neighborhood, will generate an additional urban pixel in its neighborhood. Slope coefficient controls the degree of resistance of urbanization to growing steep slopes, and road gravity coefficient controls the attraction of new development toward roads 〈http://www.ncgia. ucsb.edu/projects/gig/About/gwCoef.htm 〉.
2.2.1.2. Calibration and validation of SLEUTH model
The calibration process performs brute force Monte Carlo runs through the historical data by using every combination of the model parameters indicated. The process is developed based on sets of predefined growth rules applied in a set of nested loops. An outer loop executes each growth history and retains statistical data, while an inner loop executes the growth rules for a single year. The “seed year” that the model takes is generally the earliest year against which the model runs and compares the modeled data with the available real urban data (Clarke et al., 1997 ).
Besides these parameter rules, a second level of behavior rules is defined in this model (Silva and Clarke, 2002 ). In the case of rapid growth, the model multiplies the growth control parameters by a multiplier greater than one. Little or no growth causes the control parameters to be multiplied by values less than one. These “self-modification” rules are fundamental for the model to reflect more accurately the typical S-curve growth rate of urban expansion. Without self-modification, the model would produce only linear or exponential growth.
For statistical calibration of the model, at least four urban time periods must be used. Also, for calibration, the roads must be represented in two or more time periods.
2.2.2. Data preparation of Nanjing SLEUTH model
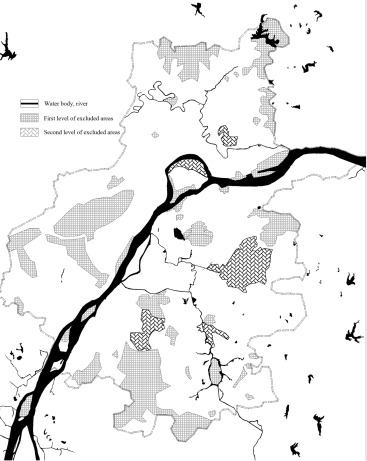
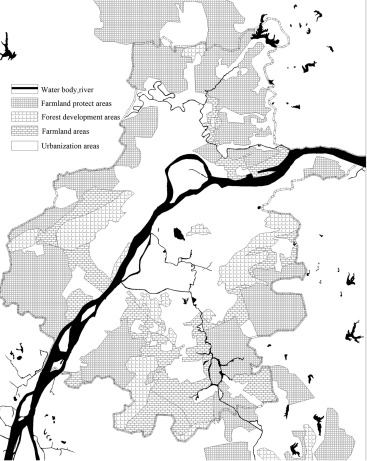
The collection of data involved various sources, including field operation, master plans of different years, aerial photographs, published books, historical maps, and reports. Urban extents and rural residential land data on the Nanjing metropolitan area for the years 2000, 2004, and 2007 were derived from surveying and mapping figures (1:5000) of urban boundary status in 2000, 2004, and 2007 (Nanjing Urban Planning Bureau, 2000, 2004, 2007). The urban extents and rural residential land data of 2013 were derived from Landsat TM images. The slope layers were derived from a topographical map dating back to 2000 (Nanjing Urban Planning Bureau, 2000). The road data were derived from surveying and mapping figures for their corresponding years. To implement the three planning scenarios, the excluded layer is defined from two aspects: first as large areas of water and open park areas that are resistant to urbanization, and second as prohibited and restricted construction areas under the urban overall planning of Nanjing for 2007 (2007–2030) (Figure 4 ) and land use planning of Nanjing for 2006 (2006–2030) (Figure 5 ). Maps with cells of 200 m×250 m for urbanization, roads, excluded areas, and topographic slopes were created in ArcGIS and converted to the 8-bit GIF format used by the SLEUTH Model. Data sources for historical urban and rural extents and other input layers are listed in Table 1 .
|
|
|
Figure 4.. Prohibited and restricted construction areas in urban planning of Nanjing in 2007 (2007–2030) (Author׳s illustration). |
|
|
|
Figure 5.. Prohibited and restricted construction areas in land use planning of Nanjing in 2006 (2006–2020) (Author׳s illustration). |
| Data Layer | Data |
|---|---|
| Urban extent data | Surveying and mapping figures of urban boundary in 2000, 2004, and 2007. 2013 data are classified from Landsat5 TM satellite images. |
| Road data | Surveying and mapping figures of land road status in 2000, 2004, and 2007. 2013 data are modified with Landsat5 TM satellite images. |
| Land use data | Surveying and mapping figures of land use status in 2000, 2004, and 2007. 2013 data are classified from Landsat5 TM satellite images. |
| Excluded data | Water body and open park areas that are resistant to urbanization. |
| Prohibited and restricted construction areas in urban overall planning of Nanjing 2007 ( 2007–2030) | |
| Prohibited and restricted construction areas in land use planning of Nanjing 2006 ( 2006–2020) | |
| Slope data | DEM |
Data sources: Derived from Nanjing Urban Planning Edit and Research Center, Nanjing Urban Planning Bureau.
2.2.2.1. Three scenarios
The three scenarios in implementing the strategy have the same input data on urban extent, road data, and land use data. The difference is observed in the excluded layer in the calibration and prediction stages.
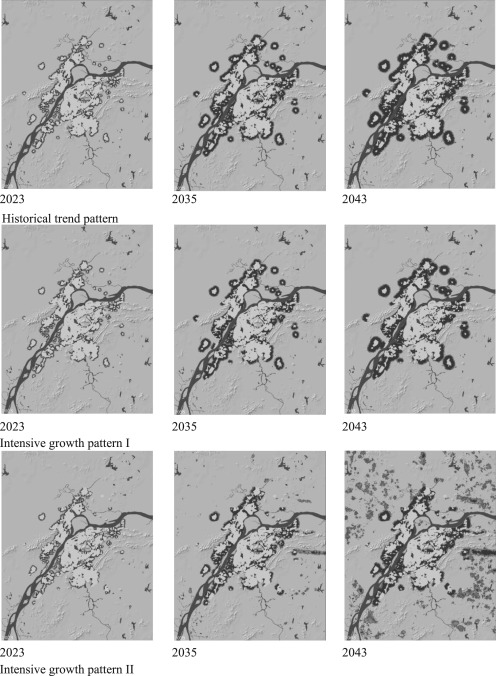
- Scenario 1: Historical trend pattern
The historical trend pattern uses the excluded layer with only the areas of the water body and open park areas that are resistant to urbanization.
- Scenario 2: Intensive growth pattern I
The intensive growth pattern I uses the excluded layers; not only the water body and open park areas that are resistant to urbanization but also the prohibited areas that are resistant to urbanization. This pattern shows the restricted construction areas in the urban overall planning in 2007 (2007–2030).
- Scenario 3: Intensive growth pattern II
The intensive growth pattern II uses the excluded layers; not only the water body and open park areas that are resistant to urbanization but also the prohibited areas and restricted construction areas in the land use planning in 2006 (2006–2020).
Running the SLEUTH model to predict future urban growth requires prior calibration of the model. The main purpose of the calibration is to determine the best fit value for the five growth coefficients, which are dispersion, breed, spread, slope, and road gravity. However, SLEUTH does not pick a best fit parameter automatically. It needs to run three phases of the calibration manually by comparing 13 metrics that can be used to evaluate the goodness of fit. The fit value of the five coefficients are listed in Table 2 , Table 3 ; Table 4 .
| Year | Built-up areas (km2 ) | Growth rate (%) | Coefficient parameters | ||||
|---|---|---|---|---|---|---|---|
| Diffusion | Breed | Spread | Slope | Road gravity | |||
| 2014 | 507.60 | 6.13 | 1.00 | 1.00 | 100.00 | 40.23 | 22.00 |
| 2019 | 651.72 | 4.10 | 1.12 | 1.15 | 100.00 | 32.21 | 22.53 |
| 2024 | 769.24 | 2.80 | 1.16 | 1.18 | 100.00 | 23.56 | 24.11 |
| 2029 | 871.35 | 2.35 | 1.21 | 1.16 | 100.00 | 12.54 | 25.76 |
| 2034 | 974.14 | 2.10 | 1.22 | 1.18 | 100.00 | 26.41 | 24.46 |
| 2039 | 1075.64 | 1.89 | 1.28 | 1.22 | 100.00 | 27.13 | 26.25 |
| 2043 | 1156.86 | 1.73 | 1.35 | 1.31 | 100.00 | 28.41 | 28.33 |
| Year | Built-up areas (km2 ) | Growth rate (%) | Coefficient parameters | ||||
|---|---|---|---|---|---|---|---|
| Diffusion | Breed | Spread | Slope | Road gravity | |||
| 2014 | 506.14 | 5.79 | 1.00 | 1.00 | 100.00 | 40.21 | 22.00 |
| 2019 | 641.24 | 3.80 | 1.05 | 1.04 | 100.00 | 31.47 | 23.28 |
| 2024 | 743.56 | 2.51 | 1.10 | 1.12 | 100.00 | 21.43 | 24.57 |
| 2029 | 830.61 | 2.02 | 1.16 | 1.18 | 100.00 | 10.54 | 25.46 |
| 2034 | 911.24 | 1.80 | 1.22 | 1.24 | 100.00 | 1.06 | 26.55 |
| 2039 | 994.57 | 1.60 | 1.28 | 1.28 | 100.00 | 1.01 | 27.31 |
| 2043 | 1057.46 | 1.50 | 1.35 | 1.35 | 100.00 | 1.00 | 28.14 |
| Year | Built-up areas (km2 ) | Growth rate (%) | Coefficient parameters | ||||
|---|---|---|---|---|---|---|---|
| Diffusion | Breed | Spread | Slope | Road gravity | |||
| 2014 | 504.46 | 5.66 | 1.00 | 1.00 | 100.00 | 40.21 | 22.00 |
| 2019 | 634.78 | 3.55 | 1.05 | 1.05 | 100.00 | 30.56 | 23.64 |
| 2024 | 724.12 | 2.14 | 1.10 | 1.10 | 100.00 | 19.23 | 24.79 |
| 2029 | 790.90 | 1.58 | 1.16 | 1.16 | 100.00 | 25.14 | 25.34 |
| 2034 | 846.28 | 1.24 | 1.21 | 1.21 | 100.00 | 26.17 | 27.49 |
| 2039 | 895.52 | 1.06 | 1.21 | 1.21 | 100.00 | 26.30 | 28.41 |
| 2043 | 929.38 | 0.84 | 1.07 | 1.07 | 100.00 | 26.91 | 29.64 |
2.2.3. Calibration results
2.2.3.1. Growth rate scenarios
The central planning practice in China is helpful for compact urban forms. Owing to the expanding scale of large cities, urban sprawl leads to ecological, social, and environment problems. In the case of Nanjing, the city has expanded quickly because of its policy on economic development zones. The central government encouraged local governments to expand cities in the way of economic development zones during the 1990s In the past two decades, all cities extended their boundaries quickly and encroached on rural farmland. Thus, the urban form of Nanjing has changed greatly because of the economic development zones Table 5 .
| Dataset: Intensive growth pattern I: 2000–2013 200×250 | |||||||||
|---|---|---|---|---|---|---|---|---|---|
| Metrics | Coefficient parameters | ||||||||
| Compare | Population | Edges | Clusters | Leesalee | Diffusion | Breed | Spread | Slope | Road gravity |
| 0.959 | 0.845 | 0.685 | 0.356 | 0.60 | 1 | 1 | 88 | 74 | 85 |
| 0.972 | 0.842 | 0.674 | 0.344 | 0.59 | 1 | 1 | 90 | 71 | 85 |
| 0.972 | 0.841 | 0.674 | 0.345 | 0.60 | 1 | 1 | 95 | 61 | 86 |
| 0.972 | 0.842 | 0.674 | 0.345 | 0.58 | 1 | 1 | 88 | 74 | 87 |
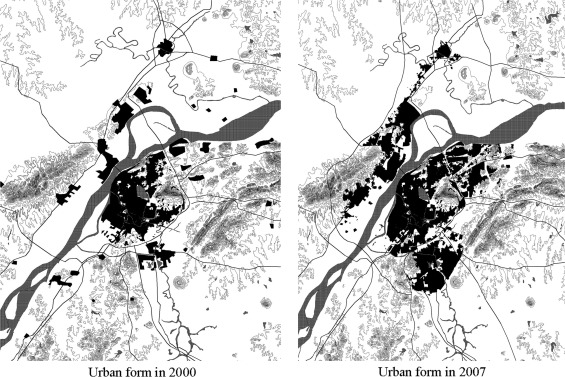
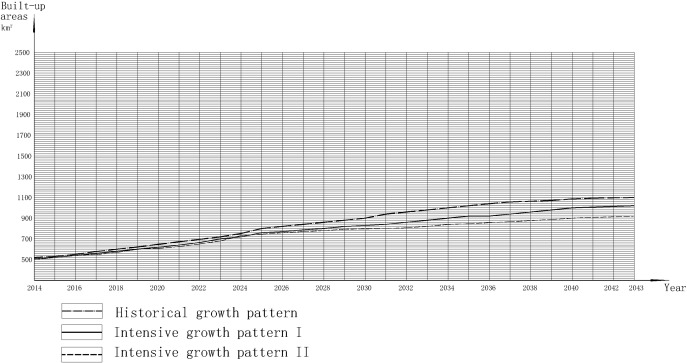
The construction of economic development zones has led to the fast southward expansion of Nanjing. Figure 6 shows the difference of the urban form in 2000 and 2007. According to the calibration results, the historical trend pattern shows the largest urban and rural residential land growth areas in the future. The areas of urban and rural residential land are 1156.86 sq. km. in 2043 with historical trend pattern, 1057.46 sq. km. in 2043 with intensive growth pattern I, and 929.38 sq. km. in 2043 with intensive growth pattern II. The historical trend pattern and intensive growth pattern I shows a similar increased growth rate, whereas the intensive growth pattern II shows the least increase. Figure 7. , Figure 8. , Figure 9. ; Figure 10. indicates the contrast data of growth rate in the three scenarios.
|
|
|
Figure 6.. Difference of urban form in 2000 and 2007 (Author׳s illustration). |
|
|
|
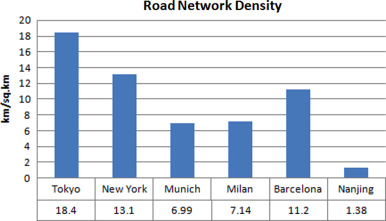
Figure 7.. Comparative data on road network density of Nanjing with several developed cities (Li et al., 2000 ). |
|
|
|
Figure 8.. Comparative data on growth rate in three scenarios. |
|
|
|
Figure 9.. Urban form of three scenarios in 2023, 2035, and 2043. |
|
|
|
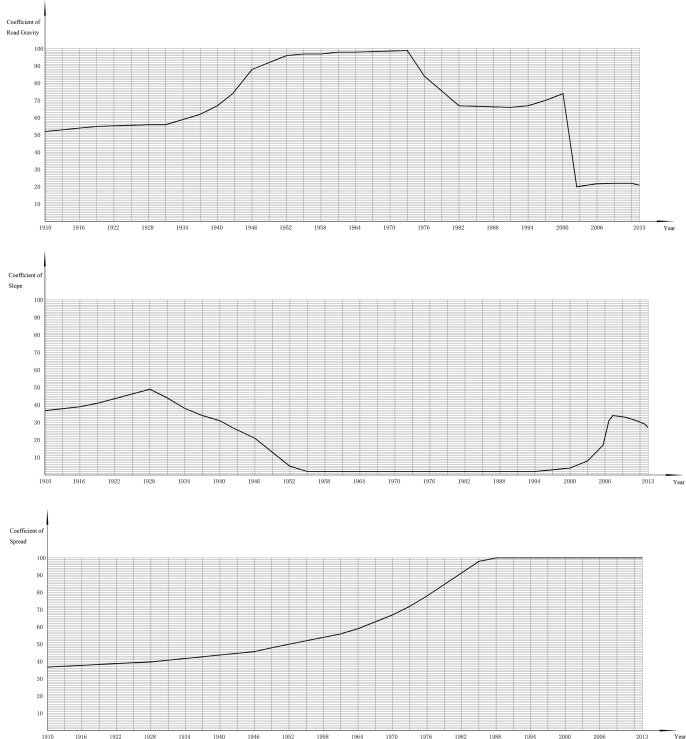
Figure 10.. Change curve of coefficients from 1910 to 2013 (Author׳s illustration). |
2.2.3.2. Growth modes of the city
Results from the three phases of calibration mode (coarse, fine, and final calibrations) show three types of growth modes that influence the growth of the city. The main growth mode of Nanjing is spread growth, which means that the city boundary is developed through the dynamics of new spreading centers. The new spreading centers are always located near the edge of the city.
The other two primary growth modes are road-influenced growth and slope-influenced growth. The slope-influenced growth is determined by the city terrain, while the road-influenced growth is determined by the existing transportation infrastructure. The data shows that the influence of terrain is significantly less with the development of the city because the slope of land that is suited for the construction is less than ever. The situation is better in intensive growth pattern II because of the definition of the restricted construction areas. Compared with intensive growth pattern I, intensive growth pattern II defines more restricted construction areas to avoid farmland loss.
The effect of road-influenced growth is obvious in the development of the city. The value of road network density is very low compared with that of the developed cities. The construction of the road and infrastructure is the main factor in the construction of city. In the model simulation, the city sprawled outward from the center because the construction of the new road and infrastructure is near the edge of the city. The coefficient value of road gravity is high throughout the entire process of simulation.
3. Findings and discussion
3.1. Management and problems in urban planning and construction
The simulation data of the model show certain problems in urban planning and construction.
First, the data present similar results in historical trend pattern and intensive growth pattern I. A contradiction appears between the two patterns because the goal of urban planning is to improve quality of life, including its economic and cultural components. However, the results indicate that the effects of urban planning on the urban form are limited. The simulation data show that land use planning is helpful for rural development. Although the debate on farmland loss caused by urban sprawl remains unresolved, the prohibited and restricted construction areas demarcated by land use planning have an effect on farmland protection. The data on growth rate shows the difference of the two types of planning in the simulation. The main problem is how to coordinate the two kinds of planning in the process of urban construction because their goals are different (one is for development and the other is for protection).
Second, different policies and measures take effect during different periods of city construction, which means that urban development lacks consistency. In the simulation, the metrics to evaluate the goodness of fit (especially the metric of leesalee2 ) are not high. The value of leesalee is 0.59, which shows that the characteristic of urban space development is leap development. Different local government leaders take different policies and measures in city construction at different time periods, thereby resulting in a significant change of urban form in a short period of time.
Third, the inflexible management system cannot adapt to economic and social development of the expanded city. The border of the city is a sensitive area for construction. It is a universal phenomenon that nonurban or non-rural areas appear diffused in rural residential land growth, farmland loss, insufficient utilization and management of land resources, and related environmental problems. This situation is called “village in the urban [area].” The mechanism should be reformed urgently because the traditional management mode of the village cannot adapt to city development.
Finally, the development of economic development zones has led to farmland encroachment and environmental pollution. These areas need to be revitalized and mixed-use centers of activity should be created (Jenks et al ., 1996 ; Ewing et al ., 2003 ).
3.2. Policy implications
Urban growth is widely regarded as an important driver of environmental and social problems. It causes the loss of informal open spaces and the fragmentation of wildlife habitats. Timely and accurate assessments of future urban growth scenarios and associated environmental impacts are crucial for urban planning, policy decision making, and natural resource management. The Chinese central government has adopted a “basic farmland protection area regulation” policy to protect farmland from being converted to developed land (Xi et al., 2012 ). Obviously, the land use planning is being used to carry out this policy. However, implementing the policy at the local level is difficult because the land use planning does not have a legal effect. Local government decision makers hope to construct a large number of projects to show their leadership. The urban planning agency always reflects the ideas of the local government decision maker. Urban planning for cities has a legal effect in China; as such, it can be executed smoothly. It pulls the construction of the city out of the central government policy from the view of farmland protection. Thus, a land law enforcement system with legal effect from the perspective of land use management must be established urgently. The system can coordinate urban planning and land use planning in the process of land supply.
However, whether the urban growth in China will indeed result in farmland loss or destroy natural resources remains a subject of debate. The adjustment of industrial structure of agriculture also causes farmland loss, and the arbitrary construction of villages leads to landscape fragmentation because of lack of scientific planning. Thus, we have to consider the scientific integration of urban planning, land use planning, and village planning from the perspective of land use management.
3.3. SLEUTH model in Chinese megacities
SLEUTH is a mature CA urban model that is applied to over 100 cities and regions (Clarke, 2007 ). Most of the regions are American and European cities. In the past 10 years, some scholars have applied the model in Chinese cities, including Shenyang, Fushun, and others (Wu, 2008 ; Xi et al ., 2009 ; Xi et al ., 2012 ). The SLEUTH urban growth and land cover change model is an effective decision-support tool to analyze and compare the impacts of classical urban and rural sprawl patterns on farmland in China. However, the simulation assumption is characterized by certain limitations. For example, the rural residential land of a town or village can be converted to urban land with the same development opportunity as a city. This situation is infeasible because different policies and measures take effect in different parts of the city, which means that the urban development lacks unified management (Qiu, 2006 ). Another limitation is that it cannot simulate the process of displacement, shrinkage, and disappearance of land (Xi et al., 2012 ), which are common features of urban growth of China.
In the case study of Nanjing, we have collected the dataset from 1910 to 2009. However, simulating the evolution of the city from 1910 is difficult because of the significant changes in the form of the city. Thus, we divided the long period into three short periods and ran the simulation. The first period is from 1910 to 1946, the second is from 1978 to 2000, and the last is from 2000 to 2013. This paper explores the management problems of the city in the third period, which is from 2000 to 2013. We compared the simulation results of the coefficients longitudinally based on three periods of time. The coefficient of spread shows that the value increased from 37 to nearly 100 in the entire process of city development, while the coefficient value of slope changed significantly in the different periods, thereby reflecting the characteristics of city construction on different periods of time in Nanjing.
4. Conclusions
The compact city concept is adopted in urban planning policies of many developed countries because it can promote efficient use of land, reduction in transport networks, a socially interactive environment with vibrant activities, economic viability, and so on. The central planning practice in China is helpful for the compact urban form. Owing to the expanding scale of the large city, urban sprawl has led to ecological, social, and environment problems. The centralized settle-down practice has made the city increasingly dense. In any case, urban planning and land use planning, which significantly influence urban growth, are helpful in addressing rural development and farmland loss. The goal of urban planning is space development, while the goal of land use planning is farmland protection. The prohibited and restricted construction areas, which are demarcated in the two planning types, are different in the future because of the difference of objectives. In the Nanjing model simulation, we can distinguish the difference in various scenarios. Coordinating the two types of planning is a challenge for local government decision makers. Possible policies include (1) how to combine the innovation of industrial structure of agriculture with land use planning to prevent farmland loss, and (2) how to conduct a new scientific plan that enables public engagement to coordinate the relation of development and protection. This measure can decrease the influence of leadership changes.
The SLEUTH model is an effective decision-support tool to analyze and compare the effects of classical urban and rural sprawl patterns in developed countries. Some scholars have used the SLEUTH model to simulate Chinese cities. Results showed that the model can analyze and forecast effectively although it is characterized by certain limitations. The scenarios, which are the representation of results, can be used for public decision making and experiments with alternative futures.
Acknowledgments
The author gratefully acknowledges the assistance of Xu Mingyao, director of the urban planning bureau of Nanjing, who provided relative historical maps and information on the city. This study is supported by the National Natural Science Young Foundation of China (No. 51308101 ) and the National Natural Science Foundation of China (No. 51378101 ).
References
- Batty, 2007 M. Batty; Cities and Complexity; The MIT Press (2007), p. 31
- Chen et al., 2009 S. Chen, S. Yao, J. Wu; Policy instrument of urban growth management and its effectiveness in Nanjing; J. Geogr. Sci., 64 (4) (2009)
- Clarke et al., 1997 K.C. Clarke, S. Hoppen, L. Gaydos; A self-modifying cellular automaton model of historical urbanization in the San Francisco Bay area; Environ. Plan. B, 24 (1997), pp. 247–261
- Clarke et al., 2007 K.C. Clarke, C. Dietzel, N.C. Goldstein; A decade of SLEUTHing: lessons learned from applications of a cellular automaton land use change model; P. Fisher (Ed.), Twenty Years of the International Journal of Geographical Information Systems and Science, CRC Press, Boca Raton (2007), pp. 413–425
- Dietzel and Clarke, 2007 C. Dietzel, K.C. Clarke; Toward optimal calibration of the SLEUTH land use change model; Trans. GIS, 11 (1) (2007), pp. 29–45
- Ewing et al., 2003 R. Ewing, R. Pendall, D. Chen; Measuring sprawl and its impact; Transp. Res. Rec. J. Transp. Res. Board, 1831 (1) (2003), pp. 175–183 http://dx.doi.org/10.3141/1831-20
- Jantz et al., 2010 C.A. Jantz, S.J. Goetz, D. Donato, P. Claggett; Designing and implementing a regional urban modeling ystem using the SLEUTH cellular urban model; Comput. Environ. Urban Syst., 34 (2010), pp. 1–16
- Jenks et al., 1996 M. Jenks, E. Burton, K. Williams; The compact city and sustainable; M. Jenks, E. Burton, K. Williams (Eds.), The Compact City: A Sustainable Urban Form?, E&FN SPON, London (1996), p. 3
- Li et al., 2000 Z. Li, et al.; The metrics research of road network planning in Nanjing; Urban Res., 2000 (2) (2000)
- O”Sullivan and Torrens, 2000 D. O׳Sullivan, P.M. Torrens; Cellular models of urban systems; S. Bandini, T. Worsch (Eds.), Theoretical and Practical Issues on Cellular Automata, Springer-Verlag, London (2000)
- Qiu, 2006 B. Qiu; Harmony and Innovation; China Architecture & Building Press, Beijing (2006)
- Silva and Clarke, 2002 E.A. Silva, K.C. Clarke; Calibration of the SLEUTH urban growth model for Lisbon and Porto, Portugal; Comput. Environ. Urban Syst., 26 (2002), pp. 525–552
- Su, 2008 Z. Su; The History of Nanjing Urban Planning; China Architecture & Building Press, Beijing (2008)
- Wu, 2008 X. Wu; Accuracy evaluation and its application of SLEUTH urban growth model; Geomat. Inf. Sci. Wuhan. Univ., 2008 (3) (2008), pp. 293–295
- Xi et al., 2009 F. Xi, et al.; Urban planning based on SLEUTH model in Shenyang-Fushun metropolitan area; J. Grad. Sch. Chin. Acad. Sci., 26 (6) (2009), pp. 765–774
- Xi et al., 2012 F. Xi, et al.; The potential impacts of sprawl on farmland in Northeast China – evaluating a new strategy for rural development; Landsc. Urban Plan., 104 (1) (2012), pp. 34–46
Notes
1. The high correlation (comparative score) means that the prediction of the model based on the initial seed year of the present urban pattern using refined values is highly similar to actual conditions.
2. Leesalee is a shape index that measures the spatial fit between the model׳s growth and the known urban extent for the control years.
Document information
Published on 12/05/17
Submitted on 12/05/17
Licence: Other
Share this document
Keywords
claim authorship
Are you one of the authors of this document?
