Abstract
Background
Due to the absence of a sub-pulmonary ventricle, the Fontan circulation is sensitive to respiration-induced changes in intrathoracic pressure. However, the importance of a ‘respiratory pump’ in creating forward flow remains controversial. We aimed at evaluating the effect of respiration on ventricular filling during exercise using clinical data and computational modeling predictions.
Methods
Ten Fontan patients (6 male, 20 ± 4 years) underwent ungated cardiac magnetic resonance (CMR) imaging at rest and during supine bicycle exercise to evaluate systemic ventricular volumes (end-diastolic volume index (EDVi), end-systolic volume index (ESVi) and stroke volume index (SVi)) during normal respiration and a Valsalva maneuver. Respiratory-dependent SV was calculated. Clinical results were compared to predictions made by a closed-loop lumped-parameter (LPN) computational model of Fontan circulation.
Results
Inspiration resulted in increased EDVi (98 ± 16 to 103 ± 15 mL; P = 0.001), SVi (55 ± 9 to 59 ± 9 mL; P = 0.001) and cardiac index (3.9 ± 0.7 to 4.2 ± 0.8 L/min; P = 0.002), whereas ESVi (P = 0.096) remained unchanged. The effect of inspiration on EDVi (mean effect + 6 ± 1 mL; P < 0.0001) and SVi (+ 4 ± 1 mL; P < 0.0001) was maintained during exercise. Respiratory-dependent SVi tended to increase during exercise (3 ± 2% to 5 ± 3%; P = 0.084). Valsalva resulted in decreased EDVi (P = 0.001), ESVi (P = 0.003) and SVi (P = 0.005). Computational modeling indicated higher EDV and SV at end-inspiration and expiration, showing a phased time delay between peak caval vein flow and peak SV.
Conclusion
In Fontan patients, inspiration resulted in increased ventricular filling at rest and during exercise. Results were confirmed using a computational model indicating a phased time delay between peak SV and peak caval vein flow.
Keywords
Fontan;Respiration;Valsalva;Exercise;Cardiac magnetic resonance imaging;Computational modeling
1. Introduction
The Fontan circulation provides definite palliation for patients born with a single anatomical or functional ventricular chamber. Due to the absence of a sub-pulmonary energy source, the Fontan circulation is exquisitely sensitive to changes in intrathoracic pressure. Previous studies have shown increased pulmonary blood flow with inspiration and absent (or reversed) pulmonary blood flow during the Valsalva maneuver [1] ; [2]. However, the effect of respiration on systemic ventricular volumes during normal respiration, exercise and Valsalva has not yet been assessed. Using real-time cardiac magnetic resonance (CMR) imaging we assessed the influence of respiration on end-diastolic and end-systolic volumes at rest and during exercise [3].
Kung et al. recently described a simulation protocol modeling the Fontan circulation at rest and during exercise, including simulated phasic intrathoracic pressures changes due to respiration [4]. Simulated exercise showed changes in inferior caval vein flow similar to clinically measured data and provided a means for virtual testing of exercise physiology and to evaluate the simulated impact of decreased thoracic pressure amplitude that may be present in Fontan patients [2]; [4]; [5] ; [6]. We hypothesized that (1) changes in intrathoracic pressure due to respiration would aid ventricular filling and output and (2) this effect would be enhanced during incremental exercise. In the second part of this study, using a comprehensive closed-loop lumped-parameter model, we aimed to (1) confirm clinically observed changes in ventricular volumes during respiration and (2) evaluate timing differences between peak caval vein flow and ventricular filling in Fontan patients.
2. Methods
2.1. Subjects
Ten Fontan patients (6 male, 20 ± 4 years), followed in the pediatric cardiology or adult congenital heart disease clinic of the University Hospitals Leuven were selected and included in the study. All patients included were clinically stable and reported no or only mild exercise limitation. None of the patients had significant atrioventricular valve regurgitation on their last echocardiographic evaluation prior to the study. Five patients had an intracardiac total cavopulmonary connection (TCPC) and 5 had an extracardiac TCPC, without any residual fenestrations or significant aorta-pulmonary collaterals on their last invasive evaluation. Eight patients had a systemic left ventricle and 2 had a systemic right ventricle. Detailed patient characteristics are reported in our previous publication [7]. Baseline characteristics are summarized in Table 1.
| Variable | |
|---|---|
| Age (years) | 19.6 ± 4.0 |
| Age at TCPC (years) | 7.2 ± 4.6 |
| Male gender n (%) | 6 (60) |
| BMI (kg/m2) | 22.0 ± 2.0 |
| AV-valve regurgitationa | 1.0 ± 0.8 |
| Mean arterial pressure (mm Hg) | 81.2 ± 7.2 |
| Mean pulmonary artery pressure (mm Hg) | 9.2 ± 3.2 |
| Ejection fraction (%) | 57 ± 10 |
| Cardiac index (L/min/m2) | 4.1 ± 1.6 |
TCPC: total cavopulmonary connection — BMI: body mass index — AV: atrioventricular.
a. Determined by echocardiography prior the inclusion in the study.
All patients (and parents when indicated) provided written informed consent for the study protocol which was approved by the University Hospitals Leuven Institutional Review Board.
2.2. Study protocol
2.2.1. Respiration
Patients were asked to breath normally during the free-breathing ungated image acquisition. They were instructed on how to perform a Valsalva maneuver prior to entering the CMR bore. Once inside the CMR bore, they were asked to perform a forced expiration against a closed glottis with imaging acquisition starting immediately. The number of heartbeats during one respiratory cycle was counted. Respiratory rate was calculated as heart rate divided by the number of heartbeats during the respiratory cycle.
2.3. Exercise CMR protocol
Patients performed low, moderate and high-intensity supine exercise in the CMR bore using a programmable ergometer (Lode, Groningen, The Netherlands). Low intensity exercise was defined as a workload (in Watt) perceived as easy (and corresponding to a heart rate of 100–110 bpm). The wattage was then increased to a level perceived as moderately intense (heart rate of 120–130 bpm) and then further increased to a level perceived as near-maximal intensity (heart rate of 140–150 bpm). If necessary, the wattage was reduced during the maximal exercise level so that the patient would manage to continue exercising. Images were acquired during free breathing using a Philips Achieva 1.5 T CMR with a five-element phased-array coil (Philips Medical Systems, Best, The Netherlands) [3].
A plethysmograph was placed on the upper abdomen to provide information on respiratory phase, with simultaneous R-wave determination using a hemodynamic monitor (Maglife Serenity, Schiller, Baar, Switzerland). These data were synchronized with the acquired images using an in-house developed software program (RightVol — Right Volume Leuven, Leuven, Belgium).
2.4. CMR image acquisition
A stack of 18 contiguous 8-mm image slices from the apex to the base of the systemic ventricle were acquired in the short-axis plane followed by a stack of 20 image slices in the long-axis plane. The number of consecutive image frames for each slice was adjusted to make sure that at least one, but preferably two, entire respiratory cycles were recorded (100 frames) and was reduced from rest to high-intensity exercise (to 50 frames per slice at high-intensity exercise). Image acquisition was performed using a temporal resolution of 36–38 ms. Imaging parameters were as follows: field of view, 320 × 260 mm (approximately); matrix, 128 × 128; flip angle, 50°; SENSE factor 2 (Cartesian k-space undersampling); repetition time, 1.8 ms; echo time, 0.9 ms; and reconstructed voxel size, 2.3 × 2.3 × 2.8 mm3. During the Valsalva maneuver, the number of image frames per slice was reduced to 30 in order to have all the image slices during the same Valsalva maneuver.
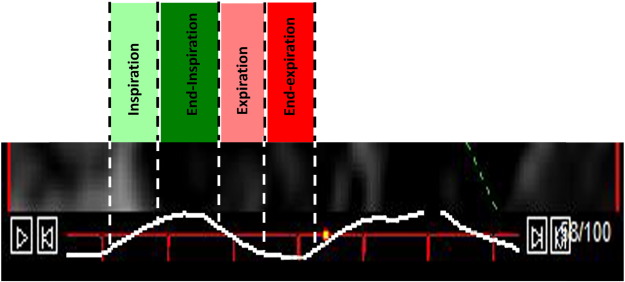
The respiratory cycle was divided into four phases using information on timing of respiration provided by the plethysmograph and electrocardiographic R-wave determination from the hemodynamic monitor (Maglife Serenity, Schiller, Baar, Switzerland). End-inspiration was defined as maximal diaphragmatic excursion (or the top point of the upstroke on the respiratory curve) whereas end-expiration was defined as minimal diaphragmatic excursion (or the lowest point of the decline of the respiratory curve). Inspiration and expiration were defined as the upstroke and downslope, respectively, of the respiratory excursion. The end-diastolic and end-systolic volume closest to each phase of the respiratory cycle were selected (Fig. 1).
|
|
|
Fig. 1. The respiratory cycle is divided into 4 phases: inspiration (light green), end-inspiration (dark green), expiration (light red) and end-expiration (dark red). Assessment of ventricular volumes combined with R-wave determination allows for accurate determination of end-diastolic and end-systolic volumes at each phase during the respiratory cycle. |
Ventricular volumes were calculated using a summation of disks method by contouring the endocardial wall on the short-axis images and using the long-axis plane as a reference to locate the atrioventricular valve plane. Volumes were indexed for body surface area. Stroke volume index (SVi) was measured as the difference between end-diastolic volume index (EDVi) and end-systolic volume index (ESVi). Cardiac index (CI) was calculated as the product of SVi and heart rate (HR).
The fraction of SV that depended on respiration was calculated as (peak inspiratory SVi − trough expiratory SVi) / (peak inspiratory SVi + trough expiratory SVi) × 100 [8].
2.5. Closed-loop lumped-parameter network (LPN) computational model
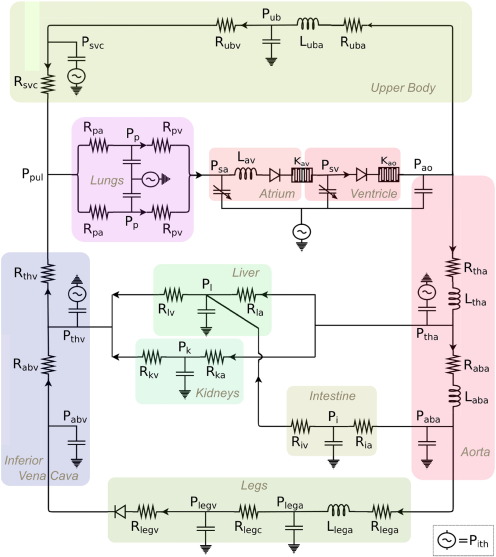
Simulations in this study were performed according to the computational modeling protocol for Fontan exercise developed by Kung et al. (Fig. 2) [4]. This modeling protocol derives a full set of simulation parameters necessary to model lower-body exercise conditions for a typical Fontan patient with any specific body size at any physiologic exercise intensity defined by metabolic equivalent (MET). The inputs to the modeling protocol are patient weight, height and desired MET. The outputs of the simulations are time-resolved pressure, flow, and volume waveforms at different locations in the circulation including pulmonary arteries, abdominal organs, atrium, and ventricle. In this model, the Fontan circulation is represented using circuit analogy via a closed-loop lumped-parameter network (LPN). The LPN consists of major blocks describing the upper body, lower body, atrium, ventricle, and pulmonary circuits. The heart blocks and the intrathoracic pressures generate active pressure which drive blood flow through the system, and the rest of the circuit contain passive elements such as resistances, compliances, inertances, and diodes. The system of algebraic and ordinary differential equations of the LPN is solved using a 4th order Runge–Kutta method for time integration in a custom solver written in Fortran.
|
|
|
Fig. 2. Closed-loop lumped-parameter network (LPN) of Fontan circulation. Rsubscript, Lsubscript, and Psubscript refer to resistor components, inductor components and nodal pressures respectively. The LPN consists of major blocks describing the upper body, lower body, atrium, ventricle, and pulmonary circuits. The heart blocks and the intrathoracic pressures generate active pressure which drive blood flow through the system, and the rest of the circuit contain passive elements such as resistances, compliances, inertances, and diodes [4]. |
According to the clinical patient data, we converted the wattage performed in each physical testing scenario into MET using the equation MET = 3PWR + 1 presented by Kung et al. [4], where PWR is the power to weight ratio in Watts per kg. The patient weight, height, and MET information together provide the inputs to each simulation. For each patient in this study we performed 4 simulations, one for each metabolic state tested (rest, low, moderate and high intensity exercise). We ran all simulations with 20 microsecond time steps for 12 s of simulated time. The last 4 cardiac cycles (one respiration cycle) of data, after stable periodicity was established, was used in the analysis. The respiratory cycle was similarly divided into four phases based on intrathoracic pressure changes. The fraction of caval vein flow that depended on respiration was calculated as (peak inspiratory caval vein flow − trough expiratory caval vein flow) / (peak inspiratory caval vein flow + trough expiratory caval vein flow) × 100.
2.6. Statistical analysis
Data were analyzed using SPSS® for Windows (version 19, SPSS, Chicago). Descriptive data for continuous variables are presented as means ± SD or as medians with ranges when appropriate. Descriptive data for discrete variables are presented as frequencies or percentages.
A paired t-test was used to evaluate differences between normal respiration and the Valsalva maneuver. Mixed modeling statistical analysis in a random-effects model and the Bonferroni post hoc test for multiple comparisons were performed. A mixed model with a random component (intercept) for each patient and an unstructured 8-by-8 covariance matrix was used. Significance levels are reported after Bonferoni adjustment for multiple comparisons. A p-value < 0.05 was considered statistically significant.
3. Results
3.1. Normal respiration and Valsalva
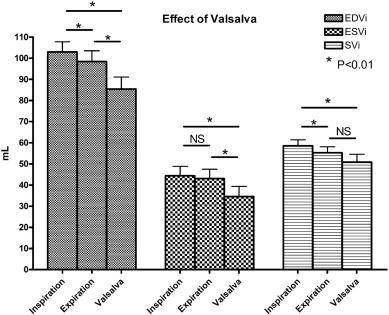
At rest, respiration frequency was 21 ± 3 per minute with an average of 3.5 ± 0.8 heartbeats per respiratory cycle. Inspiration resulted in an increase in EDVi (98 ± 16 to 103 ± 15 mL; P = 0.001), SVi (55 ± 9 to 59 ± 9 mL; P = 0.001) and CI (3.9 ± 0.7 to 4.2 ± 0.8 L/min; P = 0.002), whereas ESVi (43 ± 14 to 44 ± 14 mL; P = 0.096) remained unchanged (Fig. 3). During normal respiration, respiratory-dependent SVi was 3 ± 2%. Valsalva resulted in decreased EDVi (103 ± 15 to 85 ± 18 mL; P = 0.001), ESVi (44 ± 14 to 35 ± 15 mL; P = 0.003) and SVi (59 ± 9 to 51 ± 12 mL; P = 0.005) when compared to ventricular volumes at end-inspiration. The decrease in EDVi was larger than the decrease in ESVi (− 18 ± 12 mL vs − 10 ± 8 mL; P = 0.005) (Fig. 4).
|
|
|
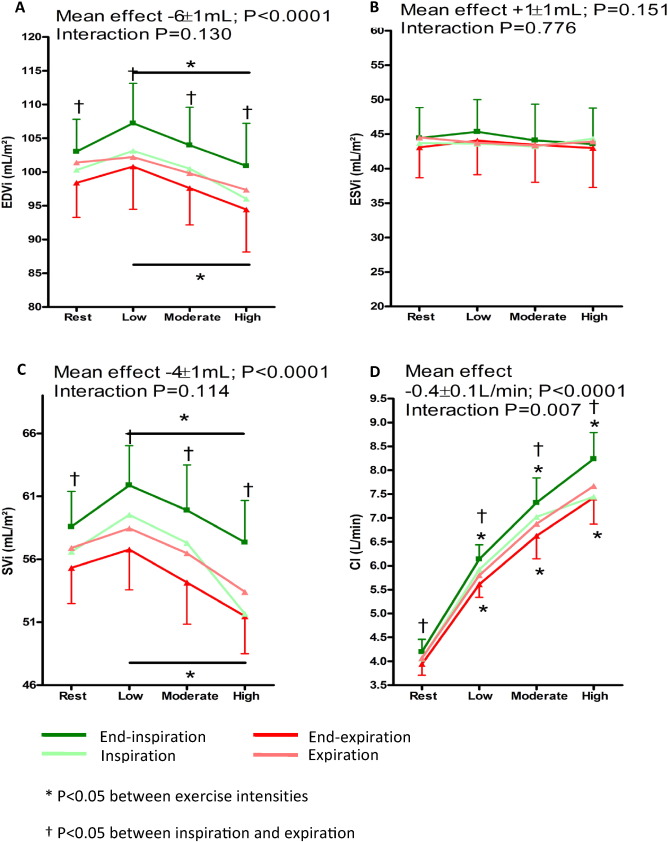
Fig. 3. Comparison at rest, low, moderate and high intensity exercise intensity at end-inspiration and end-expiration. (A) End-diastolic volume index (EDVi), (B) end-systolic volume index (ESVi), (C) stroke volume index (SVi) and (D) cardiac index (CI). The green line indicates “end-inspiration”, light green “inspiration”, light red “expiration” and the red line “end-expiration”. An asterisk indicates a significant change between exercise intensities. A dagger indicates a significant difference between inspiration and expiration. The p-value at the upper left indicates the overall between group effect (inspiration versus expiration). |
|
|
|
Fig. 4. Forced expiration against a closed glottis (Valsalva) resulted in a significant decrease in EDVi, ESVi and SVi at rest. The decrease in EDVi was larger than the decrease in ESVi (− 18 ± 12 vs − 10 ± 8 mL; P = 0.005). |
3.2. Respiration during exercise
Median workload at low, moderate, and high intensity was 35 (range 10-55 W), 75 (range 25–110 W, and 105 W (range 35–145 W). During exercise, respiration frequency increased to 41 ± 9 per minute (P < 0.0001), although the number of heartbeats per respiratory cycle remained stable (3.5 ± 0.8 to 3.7 ± 1.0; P = 0.583). The effect on EDVi (mean effect + 6 ± 1 mL; P < 0.0001 — interaction P = 0.130), SVi (+ 4 ± 1 mL; P < 0.0001 — interaction P = 0.114) and ESVi (+ 1 ± 1 mL; P = 0.151 — interaction P = 0.776) was maintained throughout exercise. There was a significant decrease in EDVi and SVi from low- to high-intensity exercise, both during inspiration and expiration (Fig. 3). Respiratory-dependent SVi tended to increase during exercise (3 ± 2% to 5 ± 3%; P = 0.084) (Fig. 5).
|
|
|
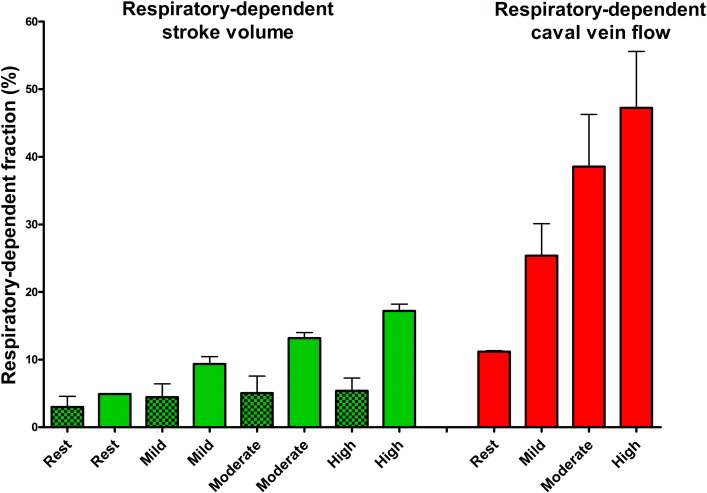
Fig. 5. Based on the LPN simulation there is an increase in respiratory-dependent stroke volume and caval flow during exercise. The increase in respiratory-dependent SV during exercise is much smaller when compared to the increase in respiratory-dependent caval vein flow. Clinical data also indicate a trend (P = 0.08) for an increase in SVi variation. Clear bars indicate simulated data. Dotted bars indicate clinical data. |
3.3. LPN computation model
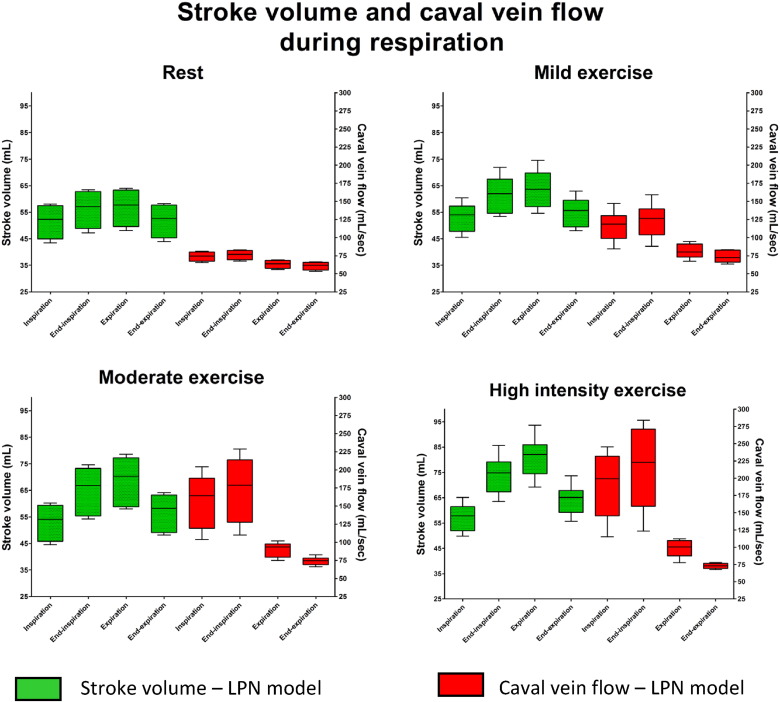
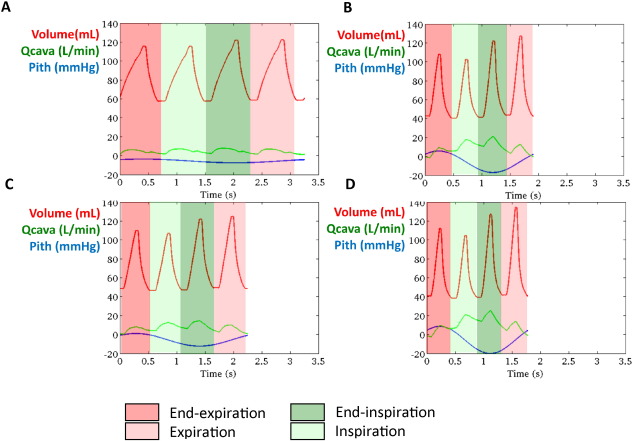
Simulated results using the closed-loop LPN indicated that whilst caval vein flow was higher during inspiration with a peak at end-inspiration, SV was higher at end-inspiration and during expiration, with a peak during expiration (Fig. 6). There was an increase in respiratory-dependent stroke volume and caval flow during exercise. However, the magnitude of respiratory-dependent SV increase was smaller when compared to the increase in caval vein flow variation (Fig. 5). Fig. 7 shows a representative example of ventricular volume, caval vein flow and intrathoracic pressure changes during one respiratory cycle. EDV varied during respiration whilst ESV remained unchanged. It also indicated increased caval vein flow during inspiration peaking at end-inspiration, with higher EDV (and SV) during end-inspiration peaking during expiration. Supplement 1 shows simulated pressure-volume loops and caval vein flow at rest and mild, moderate and high-intensity exercise based on clinical parameters of a patient in the study. Supplement 2 shows lower simulated stroke volume and caval vein flow if respiratory induced changes in intrathoracic pressure are removed from the LPN model.
|
|
|
Fig. 6. Simulated caval vein flow and stroke volumes (SV) at rest, mild, moderate and high intensity exercise. Whilst caval vein flow was higher during inspiration with a peak at end-inspiration, SV is highest at end-inspiration and during expiration indicating a phased delay between initiation of antegrade blood flow in the caval vein by inspiration and the time to reach and fill the systemic ventricle. |
|
|
|
Fig. 7. A representative example of simulated stroke volume and caval vein flow at rest and mild, moderate and high-intensity exercise based on clinical parameters of a patient included in the study. When plotted with intrathoracic pressure (Pitp), it is clear that whilst caval vein flow increases during inspiration with a peak at end-inspiration, highest SV occurs at end-inspiration and expiration. This indicates the time for blood flow initiated by inspiration in the caval vein to fill the systemic ventricle. The red line indicates ventricular volume, the green line indicates caval vein flow (inferior caval vein + superior caval vein) and the blue line intrathoracic pressure at rest (A), mild (B), moderate (C) and high-intensity exercise. (Q cava: caval vein flow — Pith: intrathoracic pressure). |
4. Discussion
In this study, using real-time CMR imaging, we have demonstrated for the first time that normal respiration aids ventricular filling in Fontan patients at rest and that this effect was maintained throughout exercise. The results of the study extend previous reports on the effect of respiration of caval vein and pulmonary blood flow in Fontan patients and also assess the effect of respiration on exercise hemodynamics. The results of this study confirm the presence of a ‘respiratory pump’ in patients with Fontan circulation. An LPN framework confirmed that inspiration results in initiation of antegrade blood flow in the caval vein with peak flow at end-inspiration, but added that peak SV occurred during expiration. Thus, there appears to be a phased time delay between initiation of antegrade blood flow in the caval veins (with inspiration) and the time of maximum filling of the systemic ventricle.
4.1. Effect of respiration on ventricular filling
In a normal biventricular circulation, inspiration results in a reduction in left ventricular (LV) SV, which has been attributed to diastolic ventricular interdependence [9], transient pooling of blood in the lungs [10] and/or changes in LV afterload [11]. Normal inspiration results in an increase in right atrial [12] and right ventricular [9] preload and a reciprocal decrease in LV dimensions [9]. In patients with a total cavopulmonary connection (TCPC) there is no sub-pulmonary atrium and ventricle in which blood can be pooled during inspiration. Indeed, not only is the respiratory-dependent venous return in TCPC patients larger than in controls [8], there is also an increase in pulmonary blood flow during inspiration [1] ; [13]. Until recently, it has been difficult to evaluate systemic ventricular volumes throughout the respiratory cycle. We have described a real-time CMR imaging methodology that enables evaluation of ventricular volumes at each time point during the respiratory cycle, providing a means to evaluate the effect of respiration on ventricular filling [3]. The results of this study – with an increase in EDVi and unchanged ESVi – indicate improved cardiac filling during inspiration in Fontan patients. Respiratory rate at rest in this study was slightly lower than observed in previous studies, resulting in an average of 3 s per respiratory cycle at rest [14], which apparently was sufficient to result in improved systemic ventricular filling and cardiac output at end-inspiration. Our LPN simulations strengthen the notion of a phased time delay between initiation of antegrade flow in the caval veins and the time when it reaches and fills the systemic ventricle with higher SVs occurring at end-inspiration and peaking during expiration. Estimated respiratory-dependent SVi (3 ± 2%) was smaller than respiratory-dependent total inferior venous return (30%) and the 24% increase in pulmonary blood flow previously reported [8] ; [13] and was confirmed in our LPN simulation. Presumably, the pulmonary vascular compliance is responsible for the attenuation of respiration-induced variation from caval vein flow to SV. The decrease in systemic ventricular volumes during Valsalva maneuver confirms previous reports [1]. The larger reduction in EDVi when compared to ESVi confirms that increased intrathoracic pressures impede pulmonary blood flow and systemic ventricular filling [1] ; [15]. Finally, the LPN model indicates that stroke volumes and caval vein flow are lower if respiration would be absent. This confirms that respiration contributes to blood flow rather than just causing variation in blood flow and ventricular volumes.
4.2. Effect of respiration on ventricular filling during exercise
During exercise, increased stroke volume and cardiac output are dependent on peripheral muscle activity (muscle pump), respiration (respiratory pump) and cardiac function [16]. Despite resting measurements of cardiac function at rest were normal, our patients showed a limited increase in CI and an early decrease in EDVi and SVi during exercise. Presumably this is due to a combination of impaired ventricular filling (in the absence of a subpulmonary ventricle) and reduced contractility relative to systemic afterload [7]. Shafer et al. showed that in Fontan patients, the largest contribution of increase in SV is caused by the muscle pump [16]. However, in contrast to their study and more in line with Hjortdal et al. [2], exercise only caused a small and not significant increase in SVi (5%) in our patients. The increase in respiratory rate during exercise is similar to what has been previously reported [14]. Although the effect of inspiration on systemic ventricular filling was maintained during exercise with a trend toward increased respiratory-dependent SVi, inspiration did not prevent a decrease in EDVi and SVi during high-intensity exercise.
Although the overall effect seems small, there are several reasons why the respiratory pump may be important during exercise [17]. First, exercise with expiratory load dramatically reduces SVi during exercise [16]. Second, pulsatile blood flow due to phasic changes in intrathoracic pressure caused by respiration may aid recruitment and distension of the pulmonary vasculature as well as shear-stress related nitric oxide (NO) release, contributing to a decrease in pulmonary vascular resistance [18]. The LPN model, as well as our clinical data, indicate that respiratory-dependent flow tends to increase during exercise. Third, there is evidence of reduced respiratory muscle strength in patients with congenital heart disease which may contribute to reduced dynamic lung volumes (such as forced vital capacity (FVC)), and be related with decreased exercise capacity [6] ; [19]. Greutmann et el. reported a reduction in respiratory muscle strength that is similar to patients with chronic heart failure [20]. Similarly, Nathan et al. reported that the presence of exercise oscillatory ventilation due to aberrant respiratoy autoregulartion is common and related to outcome in Fontan patients [19]. Respiratory muscle training may improve respiratory muscle strength and reduce exercise oscillatory ventilation as has been observed in heart failure patients [21]; [22] ; [23]. Therefore combined exercise training with inspiratory muscle training may be a therapeutic target in Fontan patients [21] ; [24].
Although respiratory rate itself does not appear to influence exercise hemodynamics [16], a decrease in intrathoracic pressure amplitude changes during exercise may be related with increased left atrial and pulmonary artery pressures [5]. Although reduced intrathoracic pressure amplitude may be related with mechanical factors (i.e. scoliosis, pectus deformities, diaphragm paralysis), it also provides perspectives for resistive respiratory muscle training in patients with Fontan circulation [6].
5. Limitations
First, the comprehensive procedures undertaken in this study limited the sample size. However, the established accuracy of exercise CMR measurements enabled us to evaluate meaningful hemodynamic differences with this modest-sized cohort. Second, we were concerned whether end-inspiration defined as the top point of the upstroke on the respiratory curve would capture maximal end-diastolic volume. Therefore, we also measured end-diastolic and end-systolic volume during inspiration and expiration which provided intermediate values of EDVi and ESVi (Supplement 3). As heart rate is independent from the respiratory cycle, it is impossible to select EDVi and ESVi precisely at end-inspiration or end-expiration. Third, several differences between clinical data and LPN predictions were noted. The increase in respiratory-dependent SV during exercise was larger in the LPN model. The model assumes a gradual increase in intrathoracic pressure amplitude during exercise, based on literature data. This may not be true for Fontan patients who underwent cardiac surgery. Also, LPN predictions show a higher SV during expiration, more consistent with the results of Hjortdal et al. [ 4]. It should be noted that the model was constructed on literature data using older Fontan circuits, which may have different hemodynamics when compared to contemporary TCPC patients.
6. Conclusions
In Fontan patients, there is a phased time delay between peak caval vein flow and peak SV. Respiration results in improved ventricular filling, the effect of which is maintained throughout exercise and which was confirmed in an computation model of Fontan circulation. This may provide perspective for respiratory muscle training in patients with Fontan circulation.
Funding sources
We would like to thank Rotary Club of Tienen, Sporta monVentoux and Eddy Merckx research grant for donating toward the cost of the CMR-compatible ergometer. A La Gerche was supported by a grant from the National Health and Medical Research Council (NHMRC) of Australia. Drs Marsden and Kung were supported by the Leducq Foundation and by a Burroughs Wellcome Fund CASI award.
Conflict of interest
No conflicts to disclose.
Acknowledgments
First and foremost, we would like to thank all patients for participating in the study. We would also like to thank Stefan Ghysels, Guido Putzeys and Chris Byloos for their help in performing the exercise MRI studies, Astrid Vloemans and Sonia Rens for their help with the logistics.
Appendix A Supplementary data
Supplementary figures
References
- [1] A.N. Redington, D. Penny, E.A. Shinebourne; Pulmonary blood flow after total cavopulmonary shunt; Br. Heart J., 65 (1991), pp. 213–217
- [2] V.E. Hjortdal, K. Emmertsen, E. Stenbog, T. Frund, M.R. Schmidt, O. Kromann, K. Sorensen, E.M. Pedersen; Effects of exercise and respiration on blood flow in total cavopulmonary connection: a real-time magnetic resonance flow study; Circulation, 108 (2003), pp. 1227–1231
- [3] A. La Gerche, G. Claessen, A. Van De Bruaene, N. Pattyn, J. Van Cleemput, M. Gewillig, J. Bogaert, S. Dymarkowski, P. Claus, H. Heidbuchel; Cardiac magnetic resonance imaging: a new gold standard for ventricular volume quantification during high-intensity exercise; Circ. Cardiovasc. Imaging, 6 (2013), pp. 329–338
- [4] E. Kung, G. Pennati, F. Migliavacca, T.Y. Hsia, R. Figliola, A. Marsden, A. Giardini; A simulation protocol for exercise physiology in fontan patients using a closed loop lumped-parameter model; J. Biomech. Eng., 136 (2014) https://doi.org/10.1115/1.4027271
- [5] E. Kung, J.C. Perry, C. Davis, F. Migliavacca, G. Pennati, A. Giardini, T.Y. Hsia, A.M. Marsden; Computational modeling of pathophysiologic responses to exercise in fontan patients; Ann. Biomed. Eng. (2014) https://doi.org/10.1007/s10439-014–1131–4
- [6] M. Greutmann, T.L. Le, D. Tobler, P. Biaggi, E.N. Oechslin, C.K. Silversides, J.T. Granton; Generalised muscle weakness in young adults with congenital heart disease; Heart, 97 (2011), pp. 1164–1168
- [7] A. Van De Bruaene, A. La Gerche, G. Claessen, P. De Meester, S. Devroe, H. Gillijns, J. Bogaert, P. Claus, H. Heidbuchel, M. Gewillig, W. Budts; Sildenafil improves exercise hemodynamics in fontan patients; Circ. Cardiovasc. Imaging, 7 (2014), pp. 265–273
- [8] T.Y. Hsia, S. Khambadkone, A.N. Redington, F. Migliavacca, J.E. Deanfield, M.R. de Leval; Effects of respiration and gravity on infradiaphragmatic venous flow in normal and fontan patients; Circulation, 102 (2000), pp. III148–III153
- [9] G. Claessen, P. Claus, M. Delcroix, J. Bogaert, A. La Gerche, H. Heidbuchel; Interaction between respiration and right versus left ventricular volumes at rest and during exercise: a real-time cardiac magnetic resonance study; Am. J. Physiol. Heart Circ. Physiol., 306 (2014), pp. H816–H824
- [10] J. Ruskin, R.J. Bache, J.C. Rembert, J.C. Greenfield Jr.; Pressure-flow studies in man: effect of respiration on left ventricular stroke volume; Circulation, 48 (1973), pp. 79–85
- [11] A.J. Buda, M.R. Pinsky, N.B. Ingels Jr., G.T. Daughters II, E.B. Stinson, E.L. Alderman; Effect of intrathoracic pressure on left ventricular performance; N. Engl. J. Med., 301 (1979), pp. 453–459
- [12] J.J. Ferguson III, M.J. Miller, J.M. Aroesty, P. Sahagian, W. Grossman, R.G. McKay; Assessment of right atrial pressure-volume relations in patients with and without an atrial septal defect; J. Am. Coll. Cardiol., 13 (1989), pp. 630–636
- [13] D.J. Penny, A.N. Redington; Doppler echocardiographic evaluation of pulmonary blood flow after the fontan operation: the role of the lungs; Br. Heart J., 66 (1991), pp. 372–374
- [14] V.E. Hjortdal, T.D. Christensen, S.H. Larsen, K. Emmertsen, E.M. Pedersen; Caval blood flow during supine exercise in normal and fontan patients; Ann. Thorac. Surg., 85 (2008), pp. 599–603
- [15] L.S. Shekerdemian, A. Bush, D.F. Shore, C. Lincoln, A.N. Redington; Cardiopulmonary interactions after fontan operations: augmentation of cardiac output using negative pressure ventilation; Circulation, 96 (1997), pp. 3934–3942
- [16] K.M. Shafer, J.A. Garcia, T.G. Babb, D.E. Fixler, C.R. Ayers, B.D. Levine; The importance of the muscle and ventilatory blood pumps during exercise in patients without a subpulmonary ventricle (fontan operation); J. Am. Coll. Cardiol., 60 (2012), pp. 2115–2121
- [17] A.L. Marsden, I.E. Vignon-Clementel, F.P. Chan, J.A. Feinstein, C.A. Taylor; Effects of exercise and respiration on hemodynamic efficiency in cfd simulations of the total cavopulmonary connection; Ann. Biomed. Eng., 35 (2007), pp. 250–263
- [18] T. Nakano, R. Tominaga, I. Nagano, H. Okabe, H. Yasui; Pulsatile flow enhances endothelium-derived nitric oxide release in the peripheral vasculature; Am. J. Physiol. Heart Circ. Physiol., 278 (2000), pp. H1098–H1104
- [19] A.R. Opotowsky, M.J. Landzberg, M.G. Earing, F.M. Wu, J.K. Triedman, A. Casey, D.A. Ericson, D. Systrom, S.M. Paridon, J. Rhodes; Abnormal spirometry after the fontan procedure is common and associated with impaired aerobic capacity; Am. J. Physiol. Heart Circ. Physiol., 307 (2014), pp. H110–H117
- [20] Y. Nishimura, H. Maeda, K. Tanaka, H. Nakamura, Y. Hashimoto, M. Yokoyama; Respiratory muscle strength and hemodynamics in chronic heart failure; Chest, 105 (1994), pp. 355–359
- [21] P. Dall'Ago, G.R. Chiappa, H. Guths, R. Stein, J.P. Ribeiro; Inspiratory muscle training in patients with heart failure and inspiratory muscle weakness: a randomized trial; J. Am. Coll. Cardiol., 47 (2006), pp. 757–763
- [22] R.B. Jaenisch, V.S. Hentschke, E. Quagliotto, P.R. Cavinato, L.A. Schmeing, L.L. Xavier, L.P. Dal; Respiratory muscle training improves hemodynamics, autonomic function, baroreceptor sensitivity, and respiratory mechanics in rats with heart failure; J. Appl. Physiol., 111 (2011), pp. 1664–1670
- [23] M. Zurek, U. Corra, M.F. Piepoli, R.K. Binder, H. Saner, J.P. Schmid; Exercise training reverses exertional oscillatory ventilation in heart failure patients; Eur. Respir. J., 40 (2012), pp. 1238–1244
- [24] D.M. Mancini, D. Henson, J. La Manca, L. Donchez, S. Levine; Benefit of selective respiratory muscle training on exercise capacity in patients with chronic congestive heart failure; Circulation, 91 (1995), pp. 320–329
Document information
Published on 19/05/17
Submitted on 19/05/17
Licence: Other
Share this document
Keywords
claim authorship
Are you one of the authors of this document?
