Abstract
On the basis of data from the period 1971–2007, and by applying trend analysis, a study on formation, disappearance and duration of lake ice cover on the Morskie Oko Lake in the Tatra Mountains in southern Poland was carried out. The results show decreasing trends in the maximum thickness of winter lake ice cover and in duration of lake ice phenomena, while air temperature recorded at the same period at the foot of the Tatra Mountains shows increasing trend. There are strong relationships between the course of lake ice phenomena and air temperature.
Keywords
lake ice cover ; thickness ; duration of lake ice phenomena ; air temperature
1. Introduction
Contemporary climate warming is reflected among others in changes in hydrological processes, including their scope, magnitude and frequency of occurrence. Kożuchowski et al. [2000] pointed out that in Poland climate changes are manifested by increasing temperatures during the autumn-winter period. Symptoms of climate warming can be clearly seen in mountain areas with ongoing glacial processes. It seems that in non-glaciated mountains, lake ice cover, in particular its thickness and the duration of lake ice phenomena, may serve as an indicator of the tendencies of climatic changes. However, it has to be reminded that changes of lake ice cover reflect not only the influence of meteorological conditions, but they also result from water circulation within the lake basin.
Studies on lake ice cover carried out in other parts of the Northern Hemisphere show a tendency with those phenomena shortened, especially on lowland lakes [ Jensen et al., 2007 and Magnuson et al., 2000 ]. This research aims at analyzing the tendencies of changes in lake ice phenomena on the Morskie Oko Lake in the Tatra Mountains in southern Poland in relation to air temperature recorded in winter over the period 1971–2007. Choiński [2006–2007] concluded a decreasing tendency of the duration of ice phenomena and ice cover on that lake in the period 1971–1995. However, in that period the declining trend was not statistically significant. Thus, it is interesting to examine if that tendency continued over the next years.
2. Data and methods
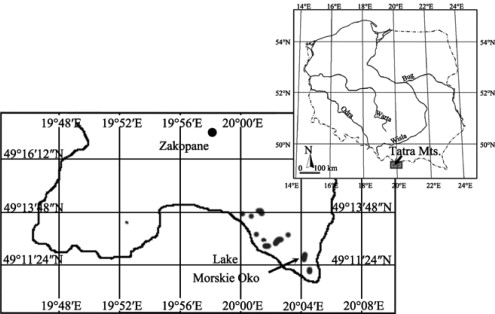
The Morskie Oko Lake (49°11’49”N, 20°04’14”E) is situated in southern Poland, on the northern slopes of the highest mountain range of the Carpathians — the Tatra Mountains (Fig. 1 ). The lake covers an area of 34.94 hm2 and is located 1,935 m above sea level. Its drainage area is 595 hm2 , the maximum depth is 51.8 m, while the total volume of its water is about 9.935 million m3 [ Choiński, 2000 ]. The Morskie Oko Lake is the largest and the fifth deepest water body in the Tatra Mountains.
|
|
|
Figure 1. Geographical position of the study area |
The analysis was carried out on the basis of data collected in the period 1971–2007 at the meteorological station of the Institute of Meteorology and Water Management located in the tourist shelter on the northern shore of the Morskie Oko Lake. The data includes the maximum thickness of lake ice cover, the dates of appearance and disappearance of lake ice cover, the duration of lake ice phenomena and the duration of continuous lake ice cover. In this study duration of lake ice phenomena means the period from the date of appearance of lake ice until the date of its complete disappearance from the surface of the lake, while duration of continuous lake ice cover means the duration of ice cover over the entire surface of the lake. The thickness of lake ice cover is measured several times a week, a few meters from the northern shore of the lake. The measurements of Choiński [2006–2007] showed that the difference in thickness of lake ice cover in different part of the lake was relatively small. In 2004 the thickness of lake ice cover was not measured. Consequently, the average thickness of the years 2003 and 2005 was used in calculations. Additionally, for the purpose of further comparative analyses, the investigated 37-year period (1971–2007) was divided into three proportional, i.e., 12-year, 12-year and 13-year time series.
Moreover, monthly mean surface air temperature recorded in the period 1971–2007 at the meteorological station of Zakopane (49°17’06”N, 19°58’19”E, a.s.l. 910 m) at the foot of the Tatra Mountains was surveyed; the data come from NCDC (http://www7.ncdc.noaa.gov/CDO/georegion ). After data standardization the Pearson’s coefficient of linear correlation was applied to calculate the correlations between lake ice cover characteristics and air temperature.
3. Results
3.1. Changes in characteristics of lake ice cover
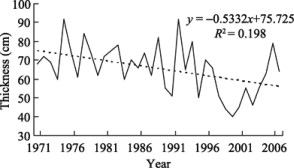
The study shows that between 1971 and 2007 the maximum thickness of lake ice cover has a clear decreasing trend. The trend is statistically significant at the confidence level of 99% and exceeds −0.53 cm per year (Fig. 2 ). Interestingly, according to the results of Choiński [2006–2007] , the decreasing trend in the period 1971–1995 was at the rate of −0.26 cm per year. It has to be noted that in the last 13 years (1995–2007) the average maximum thickness of lake ice cover was as much as 16 cm thinner than that in the first 12 years (1971–1982) of the investigated period (Table 1 ).
|
|
|
Figure 2. Changes of the maximum thickness of lake ice cover on the Morskie Oko Lake during 1971–2007 (dashed line illustrates the linear trend) |
| Period | Number of years | Average maximum thickness of lake ice cover (cm) | Average duration of lake ice phenomena (day) | Average duration of continuous lake ice cover (day) |
|---|---|---|---|---|
| 1971–1982 | 12 | 72 | 192 | 171 |
| 1983–1994 | 12 | 70 | 173 | 160 |
| 1995–2007 | 13 | 56 | 176 | 157* |
| 1971–2007 | 37 | 66 | 176 | 157 |
- . 1995–2005
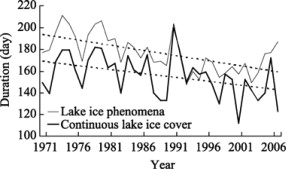
The decreasing trend in the maximum thickness of lake ice cover is related to the dates of formation and disappearance of ice on the lake. As shown in Figure 3 , ice phenomena on the Morskie Oko Lake usually appears in November and disappears in May as Łajczak [1996] concluded. In the investigated period, ice cover on the lake appeared at the earliest in 1974 (4 November) while at the latest in 2001 (31 December). In turn, the earliest disappearance of ice cover was recorded in 1990 (30 March), while the latest in 1991 (31 May). In 1991 continuous ice cover lasted as many as 200 days, while in 2001 only 112 days (Fig. 4 ).
|
|
|
Figure 3. Dates of appearance and disappearance of lake ice phenomena (a) and continuous lake ice cover (b) on the Morskie Oko Lake in the period 1971–2007 (dashed lines illustrate the linear trends) |
|
|
|
Figure 4. Changes of the duration of lake ice phenomena and continuous lake ice cover on the Morskie Oko Lake during 1971–2007 (dashed lines illustrate the linear trends) |
Figure 3 clearly shows that both lake ice phenomena and continuous lake ice cover on the Morskie Oko Lake had the tendency to appear later and disappear earlier during the period 1971–2007. However, the concluded changes proceeded at different rates. From 1971 to 2007, the duration of ice phenomena decreased significantly at the rate of −0.95 day per year (α=0.001), while the duration of continuous ice cover decreased at the rate of −0.72 day per year (α=0.01) (Fig. 4 ). It has to be noted that the rates of the decreasing trends calculated by Choiński [2006–2007] for the period 1971–1995 were −1.39 and −0.13 day per year respectively. It was noted that the decreasing trend in continuous ice cover strengthened much more when the period 1996–2007 was considered.
Between 1971–1982 and 1995–2007, both the duration of ice phenomena and the duration of continuous ice cover on the Morskie Oko Lake shortened by 16 and 14 days respectively. In the first 12 years (1971–1982), continuous ice cover appeared on average on 20 November, and in the next 12 years a week later, while during 1995–2007 as late as on 5 December (Table 2 ).
| Period | Average date of appearance of continuous lake ice cover (month-day) | Average date of disappearance of continuous lake ice cover (month-day) |
|---|---|---|
| 1971–1982 | 11-20 | 05-09 |
| 1983–1994 | 11-27 | 05-04 |
| 1995–2007 | 12-05 | 04-25 |
| 1971–2007 | 11-26 | 05-04 |
Similar tendencies were observed on other lakes in Poland. Studies carried out by Marszalewski and Skowron [2006] showed that during 1961–2000 continuous ice cover on six lakes located in lowland Poland disappeared earlier and earlier and the duration of continuous ice cover shortened at the average rate of −0.8 to −0.9 day per year. Moreover, Skowron [1997] concluded that among 34 surveyed lakes located in the northern part of the country 31 of them showed increasing trends in the temperatures of their surface waters, ranging from 0.002 to 0.124 °C per year.
In light of the obtained results it can be concluded that the analysis of lake ice cover on the Morskie Oko Lake indicates climate warming, especially in relation to the winter season.
3.2. Changes in air temperature
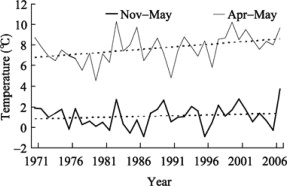
The average temperature from November to May recorded at Zakopane illustrates an increase of 1.4 °C per 100 years (Fig. 5 ). The increase is more significant (nearly 5 °C per 100 years) if considering only the last two months of the winter season (April and May), when the break-up of ice cover on the Morskie Oko Lake usually occurs.
|
|
|
Figure 5. Variations in average air temperature of November–May and April–May during 1971–2007 at Zakopane station (dashed lines illustrate the linear trends) |
There is a noticeable relationship between air temperature at Zakopane station and the maximum thickness of ice sheet on the Morskie Oko Lake in the investigated period (Table 3 ). Some observed discordances could be explained by the fact that Zakopane meteorological station is located at the foot of the Tatra Mountains, so it represents a different elevation zone compared with the Morskie Oko Lake. Nonetheless, high values of the Pearson’s correlation coefficients between air temperature and the date of lake ice cover disappearance, the duration of lake ice phenomena and the duration of continuous lake ice cover prove that there are strong relationships between the course of lake ice phenomena and air temperature, especially in April and May.
| Months | ICD | DIP | DCI |
|---|---|---|---|
| Apr–May | –0.63 | –0.54 | –0.48 |
| Nov–May | –0.53 | –0.31 | –0.49 |
4. Conclusions
The obtained results are as follows:
(1) During 1971–2007 the maximum thickness of winter lake ice cover, the duration of continuous lake ice cover and the duration of lake ice phenomena show downward trends. In the first 12 years (1971–1982) of the investigated period the average maximum thickness of lake ice cover was 16 cm greater than in the last 13 years (1995–2007). The periods of continuous lake ice cover and lake ice phenomena are visibly getting shorter. The decreasing trend in maximum thickness of lake ice cover is statistically significant.
(2) In the period 1971–2007 an increase in the average air temperature of the cold season (in particular April and May) was detected at Zakopane station. High values of the Pearson’s correlation coefficients between winter air temperatures and ice phenomena on the Morskie Oko Lake proved a strong relationship between the detected tendencies of changes.
Acknowledgements
The authors are grateful to the editor and the anonymous reviewers for their insightful comments and suggestions for the improvement of the quality of this manuscript.
References
- Choiński, 2000 A. Choiński; The deepest lakes in the Tatra Mountains — the newest depth measurements; Journal of Geography (in Polish), 71 (1) (2000), pp. 99–103
- Choiński, 2006–2007 A. Choiński; Ice phenomena on the Morskie Oko Lake in the Tatra Mountains; Folia Geographica, Series Geographica Physica (in Polish) (2006–2007), pp. 38–39 65–77.
- Jensen et al., 2007 O.P. Jensen, B.J. Benson, J.J. Magnuson, et al.; Spatial analysis of ice phenology trends across the Laurentian Great Lakes region during a recent warming period; Limnology and Oceanography, 52 (5) (2007), pp. 2013–2026
- Kożuchowski et al., 2000 K. Kożuchowski, J. Degirmendžić, K. Fortuniak, et al.; Trends to changes in seasonal aspects of the climate of Poland; Geographia Polonica, 73 (2) (2000), pp. 7–24
- Lajczak, 1996 A. Lajczak; Hydrology; Z. Mirek (Ed.), Environment of the Tatra National Park (in Polish), Tatra National Park Publishing House (1996), pp. 169–196
- Magnuson et al., 2000 J.J. Magnuson, D.M. Robertson, B.J. Benson, et al.; Historical trends in lake and river ice cover in the Northern Hemisphere; Science, 289 (2000), pp. 1743–1746
- Marszelewski and Skowron, 2006 W. Marszelewski, R. Skowron; Ice cover as an indicator of winter air temperature changes: case study of the Polish lowland lakes; Hydrological Sciences Journal, 51 (2) (2006), pp. 336–349
- Skowron, 1997 R. Skowron; Temporal-spatial Differentiation of Temperature of Surface Waters of Lakes of Northern Poland (in Polish), Institute of Geography, Department of Hydrology and Water Management, Nicolaus Copernicus University (1997), p. 151
Document information
Published on 15/05/17
Submitted on 15/05/17
Licence: Other
Share this document
Keywords
claim authorship
Are you one of the authors of this document?


