Abstract
A new available dataset of daily observational precipitation is used to study the temporal and spatial variability of extreme precipitation events for 1956–2008 in the ten large river basins of China. The maximum daily rainfall and heavy precipitation days (≥ 50 mm d–1 ) are analyzed for the basins of the Songhua River, Liaohe River, Haihe River, Yellow River, Northwest China Rivers, Huaihe River, Yangtze River, Pearl River, Southeast China Rivers, and Southwest China Rivers. The results indicate that the maximum daily rainfall was increasing in southern river basins, while it was decreasing in northern river basins, which leads to no discernible increasing or decreasing trend in the maximum daily rainfall of whole China, especially after 2001. The national averaged heavy precipitation days shows an insignificant increase. However, a rise in heavy precipitation days of southern river basins and a decline of northern river basins are observed.
Keywords
China river basins ; extreme precipitation events ; climate change
1. Introduction
Projections of change in precipitation distribution under global warming, which could intensify the contradiction between water supply and demand and increase the risks of flood and draught, have drawn much attention during the past 50 years [ Ren et al., 2008 ]. Extreme precipitation and subsequent flooding are major environmental hazards in river basins. Extensive efforts have been devoted to studying the variability of the frequency and intensity of extreme precipitation [ Liu, 1999 , Zhai et al., 2007 , Wang and Qian, 2009 and Ren et al., 2000 ]. Liu [1999] found that the number of heavy precipitation days increased after 1980s in most China, particularly in the regions of South China and south of the Yangtze River Basin, meanwhile, it decreased in North China. Zhai et al [2007] found that the frequency of total rainfall and extreme events decreased in North China while they increased in south of the Yangtze River Basin. Increased risks of flooding is supposed due to more precipitation extremes in eastern China. An increasing trend in extreme events of 1-day duration has been detected in most part of China except in North and Southwest China.
Numerous studies analyzing precipitation over single river basin show that the frequency and total amounts of heavy precipitation increased in large areas of the Yangtze River Basin. Besides, the frequent floods in the Yangtze River Basin in the late 20th century were highly correlated with the increase of extreme precipitation [ Chen et al., 2005 and Yang et al., 2005 ]. In the Yellow River Basin, the annual precipitation decreased, mainly in the area of the lower reaches [Su et al., 2006; Xu et al., 2006 ].
In this study, maximum daily rainfall and number of heavy precipitation days are investigated to diagnose spatial and temporal variations in precipitation extremes in China’s large river basins.
2. Data and methodology
The study area covers primarily the large river basins in China including Songhua River, Liaohe River, Haihe River, Yellow River, Northwest China Rivers, Huaihe River, Yangtze River, Pearl River, Southeast China Rivers and Southwest China Rivers. The previous five river basins are defined as the southern river basins and the other five are named as the northern river basins [ Chen et al., 2005 ].
The daily rainfall data for the period 1956–2008 from the qualified database of National Meteorological Information Center was used. Analysis was performed on stations with exceeding 30 years. Thus, a set of 591 stations is selected from 636 stations. Special interests are put in the number of days with precipitation exceeding 50 mm within 24 hours. We applied the following rules to the station data. First, a station will not be selected unless heavy precipitation events occurred exceeding 20 years. Second, the stations in the Northwest China Rivers Basin are removed from the ten study areas when analyzing heavy precipitation days.
The annual maximum daily rainfall also has been taken into consideration to show precipitation intensity. The arithmetic average of the indicator at stations of the study area represents the national average. The climatic average adopts the average value of 1971–2000. In addition, simple linear analysis with t-test performed on the trend.
3. Variation of maximum daily precipitation
3.1. National averaged trends
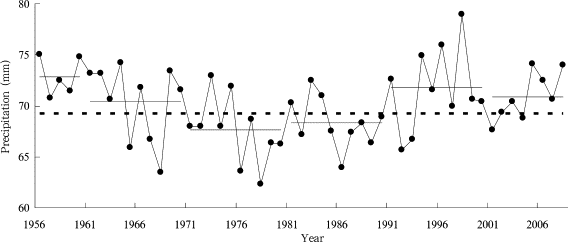
Figure 1 illustrates the time series of national averaged maximum daily rainfall during the period 1956–2008. There is no discernible linear trend but a notable interdecadal variation. From the middle 1950s to the late 1970s, the maximum daily rainfall of China river basins experienced a decrease trend. The smallest value occurred in the 1970s. After that period, particularly after the mid 1980s, it shows an increasing trend. The largest value was found in 1998 (79.0 mm). The maximum daily rainfall fluctuated near the climatic value in mid and late 1990s. The mean value over 2001–2008 was consistently more than that over 1960s–1980s.
|
|
|
Figure 1. Time series of national averaged maximum daily precipitation for 1956–2008 in China (the horizontal solid lines denote the decadal average value, and the dashed line represents the climatic average)
|
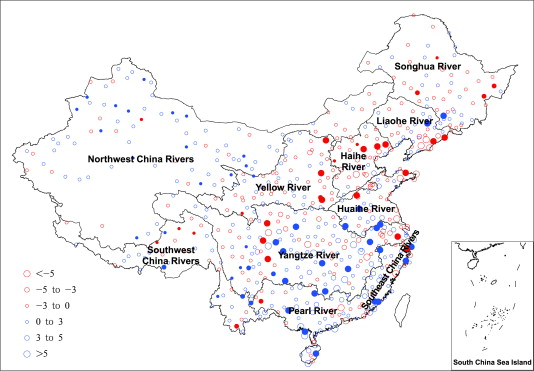
The linear trend in maximum daily rainfall at each station is given in Figure 2 . The maximum daily precipitation is increasing in the south and west of the Yellow River Basin. The upward trend is in the range of 3.0–5.0 mm per 10 years in the south of the Yangtze River. There is a downward trend in the mid and lower reaches of the Yellow River Basin and northern and eastern China containing the Haihe River Basin, Liaohe River Basin and Songhua River Basin. A remarkable decrease trend exceeding 5.0 mm per 10 years is found in Liaodong Peninsula, Jiaodong Peninsula, and the Jing-Jin-Tang Area.
|
|
|
Figure 2. Linear trends in maximum daily precipitation (1956–2008) for each station in China (unit: mm per 10 years, the solid circles mean that the trend is at the statistically significant level of 0.1)
|
For 327 stations (55.3% of 591 stations), an upward trend in maximum daily rainfall is found. The trend is statistically at the significant level of 0.1 for 49 stations among those stations, with 21 stations even passing the level of 0.05. In contrast, there are 264 stations with downward trends covering 44.7% of all stations. The trend for 29 stations out of those stations is statistically at significant level of 0.1 and with 13 stations at the level of 0.05.
3.2. Trends in different river basins
Table 1 shows the trends in maximum daily rainfall in different river basins. An downward trend is observed in the northern river basins except the Northwest China Rivers Basin. A significant downward trend can be found in the Haihe River Basin, which is the largest downward trend of about 2.4 mm per 10 years. In contrast, the Northwest China Rivers Basin experienced an obvious increase at the rate of about 0.4 mm per 10 years.
| Basin | Trend coefficient | Trend (mm per 10 years) |
|---|---|---|
| Songhua River | –0.159 | –0.60 |
| Liaohe River | –0.136 | –1.10 |
| Haihe River | –0.273** | –2.40 |
| Yellow River | –0.213 | –0.70 |
| Northwest China Rivers | 0.279** | 0.40 |
| Huaihe River | 0.020 | 0.20 |
| Yangtze River | 0.156 | 0.70 |
| Southeast China Rivers | 0.202 | 1.70 |
| Pearl River | 0.299** | 2.30 |
| Southwest China Rivers | –0.235* | –0.50 |
Notes:
- . illustrates statistically significant at level of G.G5, and
- . at level of 0.1
At the southern river basins except for Southwest China Rivers Basin where the linear trend is negative, the annual maximum daily rainfall presents an upward trend. For example, the upward trend in the Peal River Basin (2.3 mm per 10 years) is at the statistically significant level of 0.05.
The Songhua River Basin and the Liaohe River Basin have similar decadal variations. The maximum decadal mean appeared in the 1990s while the minimum was found in the period 2001–2008. For the Yellow River Basin, the decadal mean reached its maximum in the 1960s and the minimum in the 1980s. In the Northwest China Rivers Basin, the lowest decadal mean was in the 1960s, thereafter, an upward trend is apparent with the highest in the 1990s.
The maximum daily rainfall similarly fluctuated in the Huaihe River Basin and the Pearl River Basin, undergoing a process from decrease to increase. The value was the smallest in the 1980s, then notably increased in the next decades and reached the highest in the 2000s. In the Yangtze River Basin, the decadal mean was the smallest in the 1970s and the largest in the 1990s. However, it tended to decrease since 2001. In the Southeast China Rivers Basin, the smallest mean value was found in the 1970s. Upward trend was observed in the following decades, and the largest mean value was found in the early 2000s.
The maximum daily precipitation in the Southwest China Rivers Basin has a comparatively large decadal variation. The analysis also indicates that the smallest decadal value of maximum daily precipitation in most of the northern river basins (e.g., Songhua River, Liaohe River, and Haihe River) occurred in the 2000s, while most of the southern river basins (e.g., the Huaihe River, Southeast China Rivers and the Peal River) showed the highest decadal values. Conclusively, an increase in rainfall is found in southern China, while a decrease is found in northern China.
4. Variation of heavy precipitation days
4.1. National averaged trends
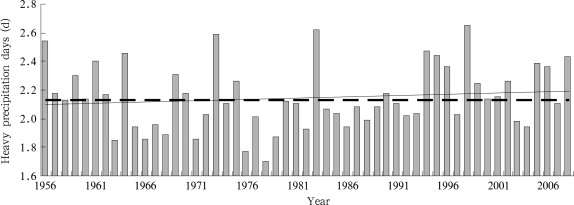
The national averaged number of heavy precipitation days is 2.1 days for China in 1956–2008. The highest number (2.7 days) was found in 1998 while the smallest (1.7 days) was in 1978 (Fig. 3 ). During the period, the number of heavy precipitation days increased slightly, with a climatological upward trend by 0.02 day per 10 years. The highest frequency of heavy precipitation is found in the 1990s and the lowest in the 1970s. For 2001–2008, the frequency is above the climatic mean.
|
|
|
Figure 3. Annual variations of national averaged heavy precipitation days for 1956–2008 in China (the thick dashed line denotes the climatic average, and the thick solid line is the linear trend)
|
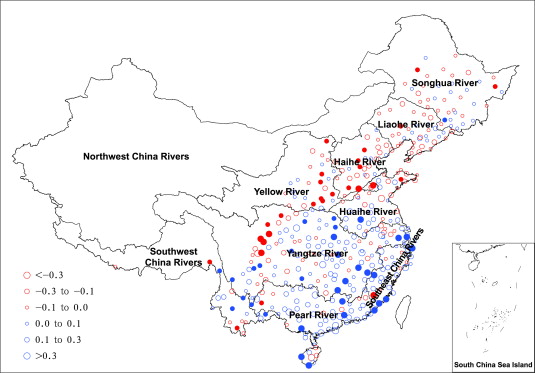
Figure 4 shows the spatial distribution of the trend in heavy precipitation days in China. Stations with frequent heavy precipitation are mainly located in East China. A rise of heavy precipitation days is found in the southern river basins, especially in the Yangtze River Basin and Southeast China Rivers Basin which experienced a notable increasing. While the heavy precipitation days decreased at most of the stations in the Yellow River Basin, the Haihe River Basin and the Liaohe River Basin. Besides, an obvious decrease trend is also found in the Sichuan Basin.
|
|
|
Figure 4. Same as Figure 2 but for heavy precipitation days (unit: d per 10 years, solid circles denote the stations are at the statisticlly significant level of 0.1)
|
The number of stations with an increase (decrease) in heavy precipitation days is 226 (171). The corresponding percentages accounting for the total station (397) are 56.9% and 40.1%, respectively. The number of stations with increase trends is higher than that with decreasing trend. Among those 226 stations, 33 stations pass the t-test at a significant level of 0.1 and 15 stations even exceed the significant level of 0.05. Of the stations with decrease trends, 27 stations pass the t-test at a significant level of 0.1, and 13 stations pass the t-test at the significant level of 0.05.
4.2. Trends in different river basins
During 1956–2008, the variations of heavy precipitation days in the northern river basins except for Northwest China Rivers Basin differed from those in the southern river basins. The number of days increased in the southern river basins. In particular, the upward trend in the Pearl River Basin is 0.18 day per 10 years, while a smaller increase occurred in the Huaihe River Basin and the Yangtze River Basin. The downward trend in the Southwest China Rivers Basin was 0.04 day per 10 years. The number of events decreased in the northern river basins, distinctively in the Haihe River Basin and the Yellow River Basin. For example, the downward trend in the Haihe River Basin was 0.11 day per 10 years (Table 2 ).
| Basin | Trend coefficient | Trend (d per 10 years) |
|---|---|---|
| Songhua River | –0.139 | –0.02 |
| Liaohe River | –0.138 | –0.05 |
| Haihe River | –0.301** | –0.11 |
| Yellow River | –0.333** | –0.04 |
| Huaihe River | 0.046 | 0.02 |
| Yangtze River | 0.131 | 0.05 |
| Southeast China Rivers | 0.212 | 0.14 |
| Pearl River | 0.269** | 0.18 |
| Southwest China Rivers | –0.270** | –0.04 |
Note:
- . illustrates at significant level of 0.05
The years with frequent heavy precipitation often appear in the 1960s for the northern river basins and in the period 2001–2008 for the southern river basins. In the northern river basins, the years with less heavy precipitation are found in and after the 1990s. But in the southern river basins, the years are mostly found before the 1970s.
In the Songhua River Basin, most of the heavy precipitation events happened in the 1990s. But after 1999, the number fell below the climatic mean and lasted for 10 years, when heavy precipitation events rarely happened in the Songhua River Basin. For the Liaohe River Basin, the number of heavy precipitation days was the highest in the 1960s and the smallest in the 1970s respectively. Then it slightly increased in later decades. The Yellow River Basin and the Haihe River Basin have similar variations of heavy precipitation days, with the maximum value in the 1960s. Thereafter, heavy precipitation days was decreasing and dropped to the minimum in the early 2000s.
An obvious fluctuation was observed in the Huaihe River Basin. The number of heavy precipitation days decreased from the 1960s to the 1980s, and increased in the 1990s with the highest value after 2001. In the Yangtze River Basin, the lowest number was in the 1970s and the highest in the 1990s with an obvious decreasing trend after 2001. The number of events varies to a large extent in the Southwest China Rivers Basin where upward trends alternate with downward trends. In the 1980s, the number reached its maximum, while dropped to the minimum in the 1990s.
Generally speaking, heavy precipitations days change from increasing trends to decreasing trends in the northern river basins, while change from decreasing to increasing trends in the southern river basins.
5. Conclusions and discussion
A long time series of daily precipitation observations is used to study the variability of extreme precipitation events in China river basins for 1956–2008. The maximum daily precipitation and heavy precipitation days in ten China river basins are analyzed in order to detect the variations in temporal and spatial scales.
(1) There is no discernable linear trend observed, but an obvious interdecadal trend in the national averaged maximum daily precipitation. Large areas in South and West China experience an upward trend in maximum daily rainfall. Downward trend is found in North and Northeast China. At most of the stations in China, the maximum daily precipitation tends to increase.
(2) The maximum daily precipitation increased in the southern river basins and decreased in the northern river basins, especially after 2001.
(3) Since 1956, there is an insignificant increase in the national averaged number of heavy precipitation days. The highest value occurred in the 1990s and the lowest in the 1970s. The number of days shows an upward trend in south of the Huaihe River and a downward trend in the north of the Huaihe River.
(4) Variations of heavy precipitation days change from increase to decrease in the northern river basins, while change from decrease to increase in the southern river basins.
All of these results are in agreement with previous studies [ Ren et al., 2008 , Liu, 1999 , Zhai et al., 2007 and Yang et al., 2005 ; 2008 ; Su et al., 2007 and Zhang et al., 2008 ]. This indicates that no visible changes exist in the temporal and spatial variations of extreme precipitation events even though new data of 21st century are added. At most of the stations, the maximum daily precipitation exhibits an upward trend — even in North China where the total rainfall amount is decreasing. In recent 10 years, summer and annual precipitation amounts are less than the climatic value. But it has no effect on the tendency of increasing maximum daily rainfall and heavy precipitation days. This implies that there is no obvious downward trend of strong precipitation events, which is consistent with the results from Zhai et al. [2007] who analysed by grading precipitation intensity.
Acknowledgements
This study is supported by the Ministry of Water Resource of China (GYHY200801001); National Key Technologies R&D Program (2007BAC29B02 and 2007BAC29B05); National Basic Research Program (2010CB428401); Ministry of Science and Technology of China (2010DFA21340); and China Meteorological Administration (540000G010C01).
References
- Chen et al., 2005 Y. Chen, G. Gao, G. Ren; Spatial and temporal variation of precipitation over ten major basins in China between 1956 and 2000; Journal of Natural Resources (in Chinese), 20 (5) (2005), pp. 637–643
- IPCC, 2007 IPCC; Climate Change 2007: Impacts, Adaptation and Vulnerability; M.L. Parry (Ed.), et al. , Contribution of Working Group II to the Fourth Assessment Report of the Intergovernmental Panel on Climate Change, Cambridge University Press (2007), p. 976
- Liu, 1999 X. Liu; Climatic characteristics of extreme rainstorm events in China; Journal of Catastrophology (in Chinese), 14 (1) (1999), pp. 54–59
- Liu et al., 2009 L. Liu, T. Jiang, F. Yuan; Observed (1961–2007) and projected (2011–2060) climate change in the Pearl River Basin; Adv. Clim. Change Res. (in Chinese), 5 (4) (2009), pp. 209–214
- Ren et al., 2000 G. Ren, H. Wu, Z. Chen; Spatial pattens of change trend in rainfall of China quarterly; Journal of Applied Meteorology (in Chinese), 11 (3) (2000), pp. 322–330
- Ren et al., 2008 G. Ren, T. Jiang, W. Li, et al.; An integrated assessment of climate change impacts on China’s water resources; Advances in Water Science (in Chinese), 19 (6) (2008), pp. 772–779
- Su et al., 2007 B. Su, T. Jiang, G. Ren, et al.; Trends of extremes precipitation over the Yangtze River Basin of China in 1960–2004; Adv. Clim. Change Res, 3 (2007), pp. S45–S50
- Wang and Qian, 2009 Z. Wang, Y. Qian; Frequency and intensity of extreme precipitation events in China; Advances in Water Science (in Chinese), 20 (1) (2009), pp. 1–9
- Xu and Zhang, 2006 Z. Xu, N. Zhang; Long-term trend of precipitation in the Yellow River basin during the past 50 years; Geographical Research (in Chinese), 25 (1) (2006), pp. 27–34
- Yang et al., 2005 H. Yang, Z. Chen, Y. Shi, et al.; Change trends of heavy rainfall events for last 40 years in the Changjiang Valley; Meteorological Monthly (in Chinese), 31 (3) (2005), pp. 66–68
- Yang et al., 2008 J. Yang, Z. Jiang, P. Wang, et al.; Temporal and spatial characteristic of extreme precipitation event in China; Climatic and Environmental Research (in Chinese), 13 (1) (2008), pp. 75–83
- Zhai et al., 2007 P. Zhai, C. Wang, W. Li; A review on study of change in precipitation extremes; Adv. Clim. Change Res. (in Chinese), 3 (3) (2007), pp. 144–148
- Zhang et al., 2008 A. Zhang, X. Gao, G. Ren; Characteristic of extreme precipitation events change in Central North China in recent 45 years; Arid Meteorology (in Chinese), 26 (4) (2008), pp. 46–50
- Zhang et al., 2009 J. Zhang, J. Wang, Q. Gan; Temporal and spatial variation characteristics of extreme precipitation events in the Yangtze and Huaihe River Basin of China from 1961 to 2006; Journal of Anhui Agricultural Sciences (in Chinese), 37 (7) (2009), pp. 3089–3091
Document information
Published on 15/05/17
Submitted on 15/05/17
Licence: Other
Share this document
Keywords
claim authorship
Are you one of the authors of this document?


