Abstract
The global warming potential (GWP) and global temperature potential (GTP) are two common metrics to calculate the CO2 equivalent of greenhouse gases (GHGs). If the country’s GHG emissions are calculated with GTP instead of GWP, the shares of the EU, USA, Japan, Canada and South Africa rise in the period 1990–2005, and those of Brazil, Australia, China, India, Mexico and Russia decrease. From 2015 to 2030, the projected shares of the EU, USA, Japan and China will increase, but those of Russia, Canada, Australia, India, Mexico and Brazil will decrease. The reduced shares of Brazil and Australia and increased share of the EU might be one of the important reasons that Brazil and Australia suggested to adopt GTP instead of GWP as early as possible, but the EU opposed it.
Keywords
greenhouse gas ; global warming potential ; global temperature potential
1. Introduction
Different greenhouse gases (GHGs) have different radiative forcing and atmospheric lifetime, with different warming effect. The IPCC has used the global warming potential (GWP) as a method for comparing the potential climate impact of different GHG emissions. In 1990, the IPCC developed GWP, based on the time-integrated global mean radiative forcing of 1 kg pulse emissions of some compound relative to that of 1 kg reference gas CO2 [ IPCC, 1990 ]. The application of GWP can convert other GHGs into CO2 equivalents (CO2 -eq). Policy makers may formulate policies to reduce other GHG emissions according to CO2 -eq [ Zhang et al., 2011c ].
However, since its introduction, GWP has been subject to criticism [ Shine et al., 2005 , Fuglestvedt et al., 2003 , Manne and Richels, 2001 and O’Neil, 2000 ]: GWP cannot represent the impact of GHG emissions on global temperature; GWP uses the time-integrated radiative forcing, which does not give a unique indication of the effect of pulse emissions on temperature; and GWP was not based on an analysis of damages caused by emissions. Decision makers and the public are more concerned about the impact of human emissions on climate changes (temperature), socioeconomy, and ecological systems, than about radiative forcing. Up to now, although the research methods have gradually matured, there are still many uncertainties in the calculation of GWP. According to the IPCC Second Assessment Report, the uncertainties were ± 35% [ IPCC, 2001 ].
Shine et al. [2005] proposed the global temperature potential (GTP) as a new relative emissions metric. GTP is defined as the ratio between the global mean surface temperature change at a given future time horizon of a gas and the reference gas CO2 for a pulse emission (1 kg at t=0) and sustained emission (1 kg per year). GTPS from a pulse emission and sustained emission are expressed as GTPP and GTPS , respectively. Under a relatively large time span, GTPS and GWP have similar mathematical expressions, thus there is a near equivalence between GTPS and the pulse GWP. Although GTPP is the same as GWP in the main physical significance, the values of the GTPP of the main GHGs in 100 years differ largely from the corresponding GWP values. Therefore, this paper mainly used GTPP values and the corresponding GWP values for a comparison, and GTPP is referred to as GTP for convenience. The GTP metric has potential advantage over GWP: it is more directly related to surface temperature changes, and was adopted in the IPCC Fourth Assessment Report [ IPCC, 2007 ]. However, GTP has many uncertainties, such as climate sensitivity factors for radiative forcing, sea-air heat exchange within climate system, selection of a target time point, etc., all of which may affect GTP calculation [ Zhang et al., 2011c ]. In contrast to GWP, GTP concept was introduced recently, and it lacks scientific, political, and economic verification, although it gives quantitative assessments of an equivalent climate response of GHGs at a given time point. Moreover, GTP cannot determine a suitable time span for the dangerous anthropogenic interference in climate system, so it cannot substitute GWP temporarily.
In the negotiations on commitments to reduce GHG emissions in developed countries during the second commitment period in the Kyoto Protocol, Brazil proposed a dialogue on whether to adopt the latest GWP values in the IPCC Fourth Assessment Report or to replace GWP values with GTP values. Brazil believed that the parties should realize the defects in GWP and should consider the substitution of GTP for GWP as soon as possible. Australia and New Zealand agreed with Brazil. The European Union (EU) stressed that this issue had been put under consideration in the IPCC Fifth Assessment Report, and that considering the substitution of GTP for GWP lacks a basis in the current phase, hoping to take this issue into account later.
Currently, researches on GWP and GTP mostly focus on the accurate calculation of GWP and GTP of major GHGs [ Zhang et al., 2011a and Zhang et al., 2011b . The differences between using GWP and GTP values in calculating the total GHG emissions of countries (economies) were rarely reported in literature. This paper analyzed the impact of replacing GTP for GWP on the EU, the Umbrella Group (USA, Japan, Canada and Australia), the BASIC countries (China, India, Brazil and South Africa), and Russia, and possible reasons for the attitudes of different countries (economies) towards the issue of replacing GWP with GTP.
2. Research methods
The scope of research in this paper is limited to the Group of Twenty (G20), due to the lack of GHG emission data. As G20 accounted for about 90%, 80% and two-thirds of the world’s total GDP, volume of trade, and population, respectively, it appears rational that G20 is chosen to represent the world. As Germany, France, UK and Italy are the EU member states, they are not included in the calculation of the aggregates of G20, in case of double calculation.
The emission data of CO2 , CH4 , N2 O, SF6 , CF4 , C2 F6 , HFC-134a, HFC-152a, HFC-125 and HFC-143a in all major economies during 1990–2005 are derived from the Emission Database for Global Atmospheric Research① . The CO2 emissions during 2015–2030 are derived from the USA Energy Information Administration② ; the projection emissions of CH4 , N2 O and SF6 are retrieved from the USA Environmental Protection Agency③ .
The calculation steps are as follows: Firstly, calculating the 100-year values of GWP and GTP according to annual GHG emissions in all major economies. All GWP and GTP values of the studied GHGs are shown in Table 1 [ Zhang et al., 2011a , Zhang et al., 2011b and ECSCNARCC (Editorial Committee for Second China’s National Assessment Report on Climate Change), 2011 ]. Secondly, calculating the percentages of GWP and GTP values of major economies in the aggregate of G20. Finally, calculating the difference between the percentage of GTP and that of GWP of each major economy.
| GHG | Lifetime (years) | GWP | GTP |
|---|---|---|---|
| CH4 | 12 | 18 | 0.26 |
| N2 O | 114 | 298 | 250 |
| HFC-125 | 29 | 4,713 | 1,113 |
| HFC-134a | 14 | 1,966 | 55 |
| HFC-152a | 1.4 | 191 | 0 |
| HFC-143a | 52 | 7,829 | 4,288 |
| CF4 | 50,000 | 7,597 | 10,052 |
| C2F6 | 10,000 | 17,035 | 22,468 |
| SF6 | 3,200 | 31,298 | 40,935 |
If an economy’s share (percentage) increases after using GTP instead of GWP, it shows that the calculation of GHG emissions by using GTP value is relatively unfavorable to this economy, which may oppose the use of GTP instead of GWP. In contrast, if its share decreases, an economy will actively support and promote the use of GTP, since using GTP to calculate GHG emissions will be relatively favorable to this economy.
3. Results
3.1. Results for historical GHG emissions
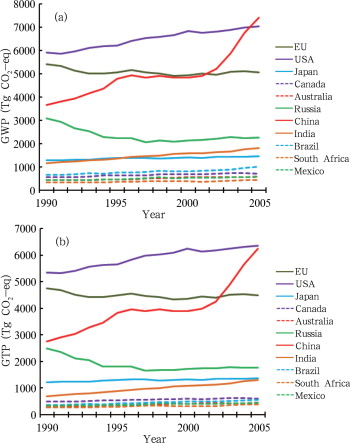
The total GWP and GTP of GHGs in all major economies are shown in Figure 1 . The total GWP and GTP of GHGs in the EU remained basically stable from 1990 to 2005. The GWP and GTP in Russia declined annually by 146 and 119 Tg CO2 -eq respectively from 1990 to 1997, and basically remained stable from 1998 to 2005.
|
|
|
Figure 1. GWP (a) and GTP (b) of the major economies of G20 from 1990 to 2005 |
In the Umbrella Group countries, the annual GWP and GTP increased by 83 and 74 Tg CO2 -eq respectively in the USA, by 12 and 10 Tg CO2 -eq respectively in Japan, and by 11 and 9 Tg CO2 -eq respectively in the both of Canada and Australia.
In the 4 BASIC countries, China’s emission pathway can be divided into 3 stages: annual GWP and GTP increased by 214 and 207 Tg CO2 -eq respectively from 1990 to 1995, remained stable from 1996 to 2001, and increased by 744 and 676 Tg CO2 -eq respectively from 2002 to 2005. The annual GWP and GTP in India increased by 42 and 39 Tg CO2 -eq respectively from 1990 to 2005; the GWP and GTP in Brazil increased by 22 and 14 Tg CO2 -eq each year respectively from 1990 to 2005; South Africa saw a yearly increase in GWP and GTP respectively by 7 and 6 Tg CO2 -eq from 1990 to 2005.
The cumulative values of and difference between GWP and GTP of major economies during 1990–2005 are shown in Table 2 . China had the highest difference with 15,431 Tg CO2 -eq between the cumulative GWP and GTP during 1990–2005. The cumulative amount of GWP in Brazil was 5,298 Tg CO2 -eq higher than that of GTP, and the GHG emissions in Brazil decreased by 42%, which was the highest reduction of the major economies, calculated by GTP instead of GWP. The cumulative amount of GWP in Australia was 1,806 Tg CO2 -eq higher than that of GTP, and the GHG emissions in Australia decreased by 23% calculated by GTP instead of GWP, which was the highest reduction of all Annex I countries.
| Economy | GWP (Tg CO2 -eq) | GTP (Tg CO2 -eq) | GWP-GTP (Tg CO2 -eq) | (GWP-GTP)/GWP (%) |
|---|---|---|---|---|
| EU | 81,060 | 71,822 | 9,238 | 11 |
| USA | 103,707 | 94,161 | 9,545 | 9 |
| Japan | 21,808 | 20,826 | 982 | 5 |
| Canada | 10,364 | 9,131 | 1,233 | 12 |
| Australia | 7,995 | 6,189 | 1,806 | 23 |
| Russia | 37,453 | 29,976 | 7,477 | 20 |
| China | 79,216 | 63,786 | 15,431 | 19 |
| India | 23,344 | 15,831 | 7,513 | 32 |
| Brazil | 12,608 | 7,310 | 5,298 | 42 |
| South Africa | 5,950 | 5,162 | 788 | 13 |
| Mexico | 7,902 | 6,319 | 1,583 | 20 |
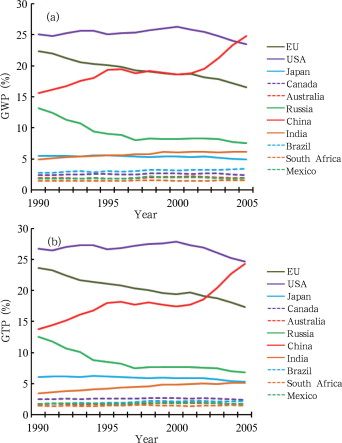
The percentage of GWP and GTP of the major economies in the aggregate of G20 is shown in Figure 2 . It shows that the EU’s proportion of GWP/GTP in G20 continued to decrease slowly from 22.3%/23.7% in 1990 to 16.5%/17.4% in 2005. Russia’s proportion of GWP/GTP decreased from 13.2%/12.5% in 1990 to 8.0%/7.5% in 1997, and almost remained stable from 1998 to 2005.
|
|
|
Figure 2. Percentages of GWP (a) and GTP (b) of the major economies to the total of G20 from 1990 to 2005 |
In the Umbrella Group countries, the USA’ proportion of GWP/GTP increased slowly from 25.1%/26.8% in 1990 to 26.3%/27.9% in 2000, reaching the peak, and then continued declining slowly to 23.5%/24.3% in 2005, reaching the minimum. Japan’s, Canada’s, and Australia’s proportion of GWP and GTP did vary obviously.
In the four BASIC countries, China’s proportion of GWP/GTP increased from 15.6%/13.8% in 1990 to 19.3%/18.0% in 1995, then remained stable during 1996–2001, and increased from 19.5%/18.6% in 2002 to 24.7%/24.3% in 2005. India’s GWP/GTP continued to increase from 4.9%/3.5% in 1990 to 6.0%/5.1% in 2005; Brazil’s GWP/GTP continued to rise from 2.7%/1.8% in 1990 to 3.4%/2.2% in 2005; South Africa’s GWP/GTP during 1990–2005 fluctuated between 1.4%/1.4% and 1.5%/1.6%.
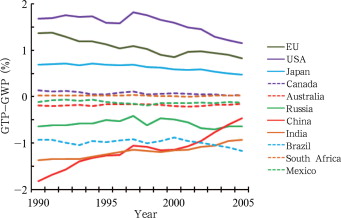
If GTP is used instead of GWP for the calculation, the EU’s share during 1990–2005 increases by 1.1% (0.8%–1.4%) in average (Fig. 3 ). In the Umbrella Group countries, shares of the USA, Japan and Canada increased by 1.6% (1.2%–1.8%), 0.6% (0.5%–0.7%), and 0.1% (0.03%–0.14%) respectively, while Australia’s share decreased by 0.2%. Russia’s share decreased by 0.6% (0.4%–0.7%). In the four BASIC countries, China’s, India’s and Brazil’s shares reduced by 1.2% (0.5%–1.8%), 1.2% (0.3%–1.4%) and 1.0% (0.9%–1.2%) respectively, while South Africa’s share increased by 0.02%. Mexico’s share decreased by 0.1%.
|
|
|
Figure 3. Differences between the percentages of GWP and that of GTP of major economies to the total of G20 from 1990 to 2005 |
According to the above data, the use of GTP instead of GWP is favorable to China, India, Brazil, Australia and Russia, but relatively unfavorable to the EU, the USA, Japan, Canada, and South Africa.
3.2. Results for future emission projections
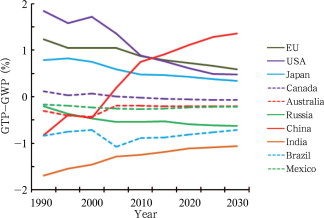
According to the future emission projections, the EU’s share increases by 0.7% (0.6%–0.8%) in average during 2015–2030 after replacing GWP values with GTP values. In the Umbrella Group countries, the USA’s and Japan’s shares increase by 0.6% (0.5%–0.8%) and 0.4% (0.3%–0.5%) respectively, while Australia’s and Canada’s shares decrease by 0.2% and 0.1%, respectively. Russia’s share decreases by 0.6% (0.5%–0.6%) (Fig. 4 ).
|
|
|
Figure 4. Projected differences between the percentages of GWP and those of GTP of the major economies to the total of G20 from 2015 to 2030 |
After replacing GWP values with GTP values for the four BASIC countries, India’s and Brazil’s shares decrease by 1.1% and 0.8% (0.7%–0.9%) respectively, while China’s share increases by 1.2% (0.9%–1.4%) from 2015–2030 (Fig. 4 ). South Africa’s future trend could not be determined due to lacking projection emission data. Mexico’s share decreases by 0.2% until 2030.
3.3. Possible impacts on China
For historical emissions, the difference between China’s GTP and GWP proportions from 1990 to 2005 diminished gradually from 1.8% in 1990 to 0.5% in 2005 (Fig. 3 ). However, China’s GTP proportion has always been smaller than the GWP proportion, which implies that China’s historical responsibility is relatively small by using GTP instead of GWP to calculate the share of GHG emissions. According to the data in Figure 4 , by using GTP instead of GWP, China’s proportion reduced by 0.4%–0.8% from 1990 to 2000, but increased in an almost straight line since 2005, by 0.2% in 2005 and 1.4% in 2030, respectively (Fig. 4 ). This indicates that China’s share is likely to increase by using GTP instead of GWP. In general, for the issue of replacing GWP with GTP, China’s position in history and in future may be completely opposite.
4. Discussion and conclusions
For the different influence of using GTP instead of GWP to calculate the total GHG emissions on economies, reasons may be found in the structure of GHG emissions. After using the 100-year GTP instead of GWP, the warming effect of CF4 , C2 F6 and SF6 in the 9 studied GHGs increased by approximately one-third, and that of the remaining 6 GHGs decreased. HFC-152a has hardly any warming effect; CH4 and HFC-134a reduced the warming effect by 98.6% and 97.2% respectively; the warming effect of HFC-125 and HFC-143a decreased by 76.4% and 45.2%, respectively; the warming effect of N2 O diminished slightly (Table 1 ). The data suggests that using GTP instead of GWP will reduce the share of the countries in which CH4 emissions contribute a great proportion to the total emissions. After replacing GWP with GTP, China’s share in historical emissions became smaller, and the reason for the increasing share in future emissions might be that excessive CO2 emissions in future cause a very small proportion of CH4 emissions. As the future emission projection data of more than half of the studied GHGs is not available, the specific reasons for great changes in China’s emissions share require further research.
(1) Replacing GWP with GTP, in terms of historical emissions (1990–2005) and projected emissions (2015–2030), the share increased in the USA, Japan and the EU among the Annex I countries, while the share decreased in Australia and Russia among the Annex I countries, as well as in India, Brazil, and Mexico among the non-Annex I countries.
(2) If GTP is used instead of GWP, China’s share of historical GHG emissions decreased, and that of future emissions is likely to increase. In contrast, Canada’s share of historical emissions increased, and that of future emissions decreases.
(3) Using GTP instead of GWP, the reduction in the share of Brazil and Australia, and the increase in the EU’s share could be an important cause of the fact that Brazil and Australia considered using GTP instead of GWP as soon as possible and that the EU strives for later use of GTP instead of GWP.
Acknowledgements
The authors thank Dr. CHAO Qing-Chen, GAO Yun, LIU Hong-Bin and HUANG Lei for their useful recommendations for the research. This research was supported by the National Basic Research Program (No. 2012CB955504 and 2010CB955703).
References
- ECSCNARCC (Editorial Committee for Second China’s National Assessment Report on Climate Change), 2011 ECSCNARCC (Editorial Committee for Second China’s National Assessment Report on Climate Change); Second China’s National Assessment Report on Climate Change (in Chinese)Science Press (2011), p. 710
- Fuglestvedt et al., 2003 J.S. Fuglestvedt, T.K. Berntsen, O. Godal, et al.; Metrics of climate change: Assessing radiative forcing and emission indices; Climatic Change, 58 (2003), pp. 267–331
- IPCC, 1990 IPCC; ,in: J.T. Houghton (Ed.), et al. , Climate Change 1990: The IPCC Scientific AssessmentCambridge University Press (1990), p. 365
- IPCC, 2001 IPCC; Climate Change 2001: The Scientific Basis; ,in: J.T. Houghton (Ed.), et al. , Contribution of Working Group I to the Third Assessment Report of the Intergovernmental Panel on Climate Change.Cambridge University Press (2001), p. 881
- IPCC, 2007 IPCC; ,in: S.D. Solomon (Ed.), et al. , Climate Change 2007: The Physical Science Basis. Contribution of Working Group I to the Fourth Assessment Report of the Intergovernmental Panel on Climate ChangeCambridge University Press (2007), p. 996
- Manne and Richels, 2001 A.S. Manne, R.G. Richels; An alternative approach to establishing trade-offs among greenhouse gases; Nature, 410 (2001), pp. 675–677
- O’Neil, 2000 B.C. O’Neil; The jury is still out on global warming potentials; Climatic Change, 44 (2000), pp. 427–443
- Shine et al., 2005 K.P. Shine, J.S. Fulestvedt, K. Hailemariam, et al.; Alternatives to the global warming potential for comparing climate impacts of emissions of greenhouse gases; Climatic Change, 68 (3) (2005), pp. 281–302
- Zhang et al., 2011a H. Zhang, J.-X. Wu, P. Lu; A study of the radiative forcing and global warming potentials of hydrofluorocarbon; Journal of Quantitative Spectroscopy & Radiative Transfer, 112 (2011), pp. 220–229
- Zhang et al., 2011b H. Zhang, J.-X. Wu, Z.-P. Shen; Radiative forcing and global warming potential of perfluorocarbons and sulfur hexafluoride; Science China Earth Sciences, 54 (5) (2011), pp. 764–772
- Zhang et al., 2011c R.-Y. Zhang, J.-H. He, H. Zhang; Overview of researches on global warming potential of greenhouse gases; Journal of Anhui Agriculture Science (in Chinese), 39 (28) (2011), pp. 17416–17419
Notes
①. EC-JRC/PBL. EDGAR version 4.0. http://edgar.jrc.ec.europa.eu
Document information
Published on 15/05/17
Submitted on 15/05/17
Licence: Other
Share this document
claim authorship
Are you one of the authors of this document?


