1 Introduction
The project MAYA has been funded by the European Commission within the Horizon 2020 Framework Programme, work programme part Clean Sky 2 after the proposal JTI-CS2-2018-CfP08-LPA-02-24: Generic added structures on thermoplastic fuselage shells.
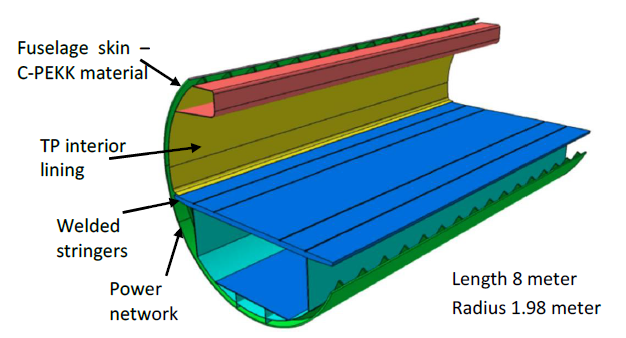
Nowadays, lining panels for aircraft cabin interior are normally produced using honeycomb panels with glass-fibre reinforced sheets with thermoset resins. All the attachments or fittings have to be adhesively bonded afterwards. Because of the necessary curing process for the thermoset matrix, the productivity ratio of these panels is low. Moreover, these panels present an unbalanced Life Cycle Analysis and substitution materials and processes are welcome. To overcome these limitations, the use of glass-fibre reinforced thermoplastic (TP) sheets substituting the thermoset ones has been investigated within the frame of the Multifunctional Fuselage Demonstrator project (Clean Sky 2 programme, Figure 1). This opens the possibility to directly add the attachments to the shell of the lining panel directly by injection moulding or using additive manufacturing.
The main objective of the MAYA project was to develop innovative manufacturing procedures integrating standard thermoplastic processes (injection moulding and thermoforming) and additive manufacturing to produce aircraft fuselage lining panels while improving its performance, reducing its weight and optimizing its manufacturing costs. For this, both injection moulding and additive manufacturing techniques have been considered to manufacture the attachment brackets of the panels in a more efficient way. These brackets are to be directly manufactured on top of the glass-fibre sheets of the sandwich panels or adhesively bonded.
The project has been developed by LEITAT – Acondicionamiento Tarrasense (Spain), responsible for the project management, material selection and development of the solution using 3D-printing, Centre Technique Industriel de la Plasturgie et des Composites (France), IPC, responsible for the development of the solution using injection moulding and also 3D-printing and process upscaling and manufacturing of demonstrator parts and AMADE (Spain), responsible for the experimental campaign.
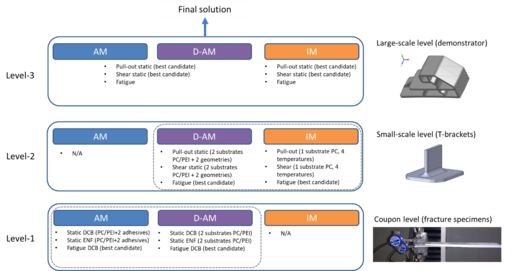
During all the project, the work carried out by AMADE has focused on the experimental characterisation of the interface bonding for material selection and validation of designs. As shown in Figure 2, the project has been developed following a building-block approach with four different stages: material selection, tests at coupon level (level-1), small-scale or T-brackets (level-2) and large scale demonstrator (level-3). Level-1 encompasses the initial characterisation of the interface bonding of the specimens obtained by either direct 3D printing on the composite skin or by using adhesives. The tests are carried out under mode I, static and fatigue, and mode II, static, to obtain the best material candidates and design properties. The experimental analysis of the union between the composite skin and small-scale brackets under pull-out and shear-out conditions is considered in Level-2. Only static loading is taking into account at this stage. Level-3 is devoted to the validation of the final designs of the brackets, both for injection moulding and additive manufacturing, and the corresponding interface bonding with the composite skin. under static and fatigue conditions simulating the service loads applied to the panels.
In this work, the test campaign carried out at coupon level or Level-1 is described.
2 Materials
As it has been previously commented, the objective of the project was the improvement of the manufacturing process and final performance of aircraft lining panels by using injection moulding and 3D-printing techniques to manufacture the attachment brackets of these panels. Two different alternatives are considered for bonding the 3D-printed brackets to the fibre-glass composite sheet of the lining panel: i) direct 3D-printing on top of the panel and ii) adhesive bonding of the 3D-printed bracket. For the injection moulding case, the bracket is directly injected on top of the panel.
Current lining panels are manufactured using a sandwich structure combining a honeycomb core between two composite urea-formaldehyde sheets reinforced with fibre-glass. However, in line with the Multifunctional Fuselage Demonstrator project within the Clean Sky 2 programme, the composite skins of the sandwich panel are to be manufactured using thermoplastic matrices. In agreement with the topic manager of the project, PolyCarbonate (PC) organosheet, PC composite sheets reinforced with glass-fibre fabric, has been considered during the development of MAYA.
As for the materials to manufacture the brackets, the selection carried out by LEITAT in collaboration with the topic manager and AMADE and the support of IPC reduced the list of candidate materials to two different TP materials: LEXAN FST 9405 PolyCarbonate (PC) and Ultem 9085 PolyEthylenImine (PEI). Both materials offer appropriate mechanical and fire resistant properties, as required for aircraft applications, and are compatible with injection moulding and 3D-printing manufacturing techniques. Following a similar procedure, LEITAT carried out the selection of the adhesives for bonding the brackets to the organosheet skin. Although two adhesive candidates were chosen, because of fire resistance properties,
the selection was finally limited to the epoxy-based Araldite Standard.
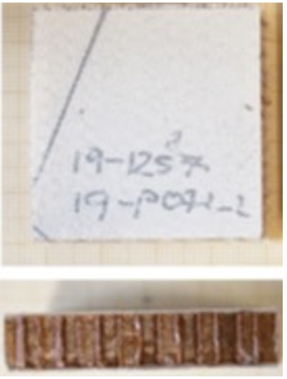
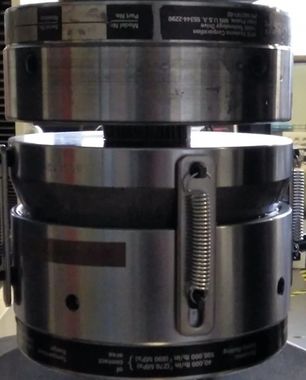
One of the key aspects for the direct injection moulding process on top of the panel is the capacity of the honeycomb to withstand the injection pressure. Thus, in a first stage of the experimental campaign the flatwise compression strength of the honeycomb was evaluated, as shown in Figure 3. Five sandwich specimens with organosheet skins and honeycomb provided by the topic manager were tested at room conditions according to the ISO-844 standard. The results of the tests showed that the compression strength of the honeycomb used in the lining panels is about 0.66 MPa. This value is too low to allow for the direct injection moulding process, which according to IPC requires a pressure of around 800 MPa.
|
Taking into account that the brackets cannot be directly injected on top of the sandwich panels because of the low compressive strength of the honeycomb, a different approach was considered. The injection brackets should be directly injected on top of the organosheet skin and this assembly integrated in the sandwich panel in a subsequent step. Therefore, the test campaign carried out by AMADE to characterise the bonding interface capabilities between PC and PEI material and brackets with the organosheet skins did not include any specimen with honeycomb core.
3 Coupon level – fracture specimens
As shown in Figure 2, the Level-1 or coupon level tests are mainly devoted to determine the quasi-static fracture toughness and fatigue onset curves of the interface between the organosheet and the bracket material. For this, the typical delamination tests used in composite materials with beam-like specimens were considered. Due to the limitations of manufacturing this type of specimens using injection moulding on top of an organosheet skin, this manufacturing technique was not considered at this stage. Thus, the fracture tests were limited to the characterisation of the bonding strength when the material is directly deposited on top of the organosheet using 3D printing, D-AM (Direct Additive-Manufacturing), and when the 3D-printed material (AM) is bonded with adhesive to the organosheet (AM). With the experimental tests a comparison between the two manufacturing methods and the two substrate materials (PC and PEI) is established.
The fracture tests considered at this stage include the characterisation in mode I, both static and fatigue, using the Double Cantilever Beam (DCB) test, as per ASTM D-5528 standard, and mode II, only static, using the End-Notched Flexure (ENF) test, according to standard ASTM D7905.
3.1 DCB fracture test
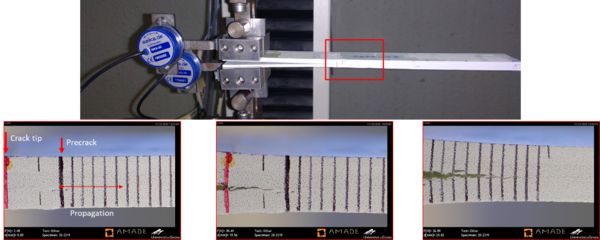
The data reduction methods for the DCB tests considered in the different standards such as ASTM D5528 do not cover the analysis of dissimilar materials as the current case of study. For this reason, AMADE proposed to use the J-integral approach to determine the fracture toughness, which is not limited to one single material but also does not require the monitoring of the exact position of the crack tip. Instead, the fracture toughness can be computed by measuring some rotation angles as follows [1]:
|
|
(1) |
where P is the measured load, b is the specimen width, θA and θB are the rotation angles of the top and bottom arms, as shown in Figure 4.
3.2 ENF fracture test
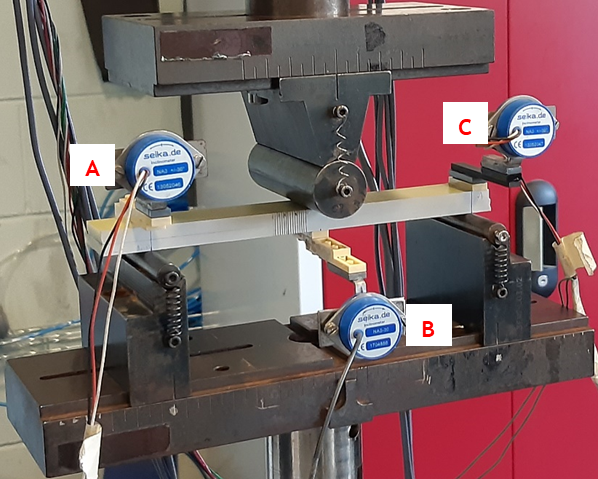
As in the mode I case, the standard does not cover the study of multi-material specimens, and thus UdG suggested to make use of the J-integral approach to determine the mode II fracture toughness. In this case, three rotation angles must be measured as follows:
|
|
(2) |
where the rotation angles θA, θB and θC are measured with inclinometer A at the left, B in the centre and C at the right side of the specimen (see Figure 5).
3.3 Fatigue onset curves
AMADE carried out the mode I fatigue tests following the ASTM D6115 standard test method for mode I fatigue delamination growth onset of unidirectional composite laminates. This test method determines the number of cycles (N) for the onset of crack growth based on the opening mode I cyclic strain energy release rate (G) using the DCB specimen. The fatigue tests were carried out under a cyclic displacement at 5 Hz. As suggested in the standard, the specimen compliance was monitored and a 5% increase with respect to the initial compliance was used as the condition to establish the crack onset.
Following the test methodology proposed by Renart et al. [2], the specimen compliance was monitored in real time and the number of cycles for different severities (i.e., ratio between the maximum energy release rate Gmax over the static fracture toughness) were measured as depicted in Figure 6. The final goal is to best-fit a Gmax – N curve with the experimental data of a batch of 5-6 specimens.
3.4 Specimen design
3.4.1 D-AM Specimens
The D-AM specimens consist of 3D printing PEI or PC on top of the organosheet as shown in Figure 7 (manufactured by IPC). A region with a precrack is created by using Dimafix (a spray for 3D printing acting as adhesive at temperatures higher than 50 ºC and without bonding characteristics below this temperature).
Generally, performing fracture tests on specimens with two different materials will have the following consequences if the design of the specimen is not properly done:
- Joint dissimilarity. DCB and ENF tests will not be pure mode tests, therefore obtaining spuriously higher or lower fracture energies due to the mode mixity introduced.
- Material strength. The arms have to withstand the load expected during the tests without failure before reaching the critical fracture toughness at the interface.
- Specimen bending stiffness: the specimen bending stiffness must be within a certain bounds to avoid large displacement and rotations, or being overly stiff.
AMADE defined some guidelines for the design of multi-material fracture specimens [3], which mainly resulted in an equation that imposes a restriction between the bending stiffness of each arm of the specimen as follows:
|
|
(3) |
where EU and EB are the bending modulus of the upper and bottom arms, hU and hB are the arm thicknesses, respectively. The bending stiffness of each arm has to be perfectly balanced to prevent crack growth under mixed-mode conditions. Consequently, the original D-AM specimens were reinforced to fulfil equation (3) as shown in Figure 8. In order to avoid failure of the arms before reaching the target joint fracture toughness, the minimum arm thickness for a DCB specimen can be estimated as (assuming Linear Elastic Fracture Mechanics, LEFM):
|
|
(4) |
where Ef is the equivalent bending modulus of one arm, GIc is the mode I fracture toughness and σf is the bending strength of the substrate material. Similarly, for an ENF specimen and considering GIIc as the mode II fracture toughness (assuming LEFM):
|
|
(5) |
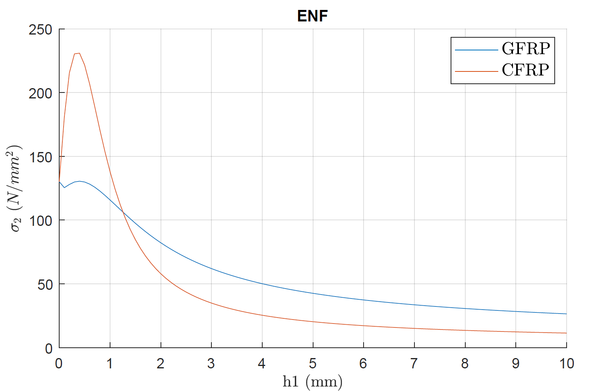
Based on some preliminary tests performed at the lab with 1.5 mm thickness GFRP reinforcement (see Figure 8 left), fracture of the 3D printed arms occurred at around 50 MPa.
Using simple beam theory with a multi-material specimen, it is possible to plot the bending stress at the 3D printed arm (σ2) with respect to the thickness of the reinforcement (either CFRP or GFRP), assuming the joint fracture toughness to be around 1 N/mm and the maximum stress to be 50 MPa. According to Figure 7 and Figure 8, the minimum reinforcement thickness required to reduce the stress below 50 MPa in a DCB and ENF specimen is 2 mm using CFRP and 4 mm using GFRP.
Figure 11 shows a picture of the final specimen with a 4 mm thick GFRP plate that gives the best compromise and fulfils the requirements specified in this section.
3.4.2 AM Specimens
Analogously, the AM specimens were prepared by IPC following the same methodology as the D-AM specimens. However, the thickness of the 3D printed arm was slightly increased in the AM specimens since the results from the D-AM tests revealed some technical issues. The results obtained with the AM specimens using the same design as in the D-AM case (specimen type 1 in Figure 12) were not valid (see results section), so it was decided to design a new specimen completely symmetric as shown in Figure 12 (specimen type 2).
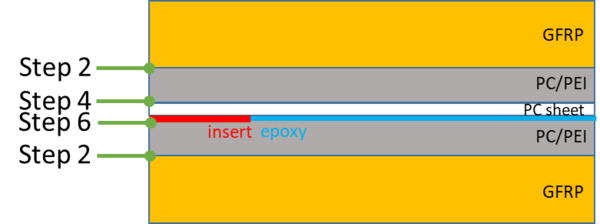
The bonding process of AM specimens with the epoxy-based Araldite standard adhesive (selected by LEITAT in agreement with the topic manager) was performed following the steps below:
1. Sand the surfaces with sand paper fine grit (1200).
2. Bond with Araldite the GFRP reinforcements to the PC/PEI printed materials.
3. Cure at 40ºC during 16h holding with pressure.
4. Bond with Araldite the PC sheet to one of the arms GFRP/PC/PEI.
5. Cure at 40ºC during 16h holding with pressure.
6. Bond with Araldite the interface of study (thickness ≈ 0.5 mm).
7. Cure at 40 ºC during 16 h holding with pressure.
Each individual specimen was prepared in 3 days, one day to bond the interface of step 2, one day to bond the interface of step 4 and the last day to bond the interface of study (step 6). The different interfaces are shown in Figure 13.
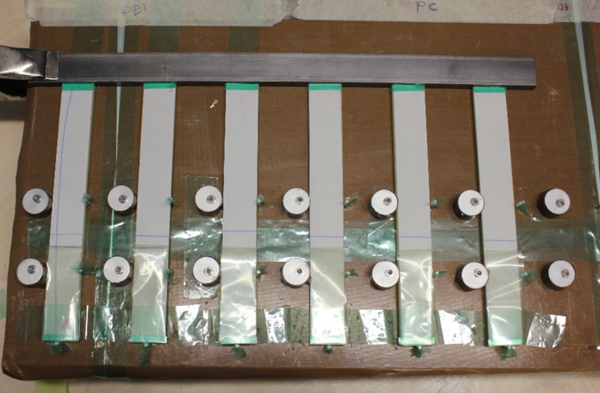
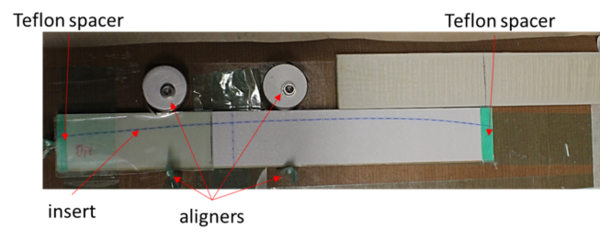
Figure 14 shows the tooling fixture used to bond the specimens. The tooling allows to prepare six specimens simultaneously with four rollers than align the specimen in the width direction and one pin that restricts the longitudinal movement. Two Teflon spacers were used to have a bond thickness of around 0.5 mm.
4 Results and discussion
4.1 DCB fracture test
4.1.1 D-AM specimens
Tables 1 and 2 summarise the fracture toughness obtained with D-AM specimens with material combinations PC/PC and PEI/PC, respectively. Note that two types of energies are given. The first refers to the initiation of crack growth and the second refers to the average propagation energy. Since most of the tests experienced crack jumping or failure of the 3D printed arm, the more reasonable and conservative approach is to use the visual initiation energy level (VIS) for the initiation. Thus, the PC/PC configuration reaches around 395 J/m2 and the PEI/PC configuration around 495 J/m2.
| J-integral: JIC (J/m2) | ||
| Specimen | Initiation | Avg. Propagation |
| 20-2225 | 360 | 425 |
| 20-2231 | 350 | * |
| 20-2233 | 336 | 660 |
| 20-2234 | 534 | * |
| Average | 395 | 543 |
| Standard dev. | 93.2 | 166.2 |
| CV (%) | 24% | 31% |
| J-integral: JIC (J/m2) | ||
| Specimen | Initiation | Avg. Propagation |
| 20-2253 | 362 | 773 |
| 20-2254 | 692 | 1234 |
| 20-2255 | 451 | 774 |
| 20-2256 | 474 | 908 |
| Average | 495 | 922 |
| Standard dev. | 140.4 | 217.3 |
| CV (%) | 28% | 24% |
Figure 15 and Figure 16 show the fracture surfaces of the specimens after testing. The white vertical lines mark the position of the crack tip from the beginning to the end of test.
4.1.2 AM specimens
As mentioned before, type 1 AM specimens are similar to D-AM specimens but increasing the thickness of the 3D printed arm, while type 2 AM specimens are fully symmetric (see Figure 12). The results obtained with specimen type 1 were not valid as the crack jumped into another interface thereby invalidating the test. Figure 17 illustrates this by showing an edge view of specimen type 1 in which the crack grows at the interface between the organosheet and the GFRP reinforcement. Consequently, the AM specimen tests were done with type 2 geometry as this one was the best configuration with the best bonding process.
Nevertheless, only three specimens for each configuration PC/PC and PEI/PC could be tested as the other samples were used in unfruitful trials. Table 3 summarises the mode I toughness obtained with AM PC/PC specimens reaching around 476 J/m2 (VIS). Unfortunately, the three specimens tested for the PEI/PC configuration resulted in invalid failure due to the crack propagating in other interfaces.
| J-integral: JIC (J/m2) | ||
| Specimen | Initiation | Avg. Propagation |
| 21-1417 | 515 | 668 |
| 21-1418 | 460 | 591 |
| 21-1419 | 451 | 641 |
| Average | 476 | 634 |
| Standard dev. | 34.5 | 38.8 |
| CV (%) | 7% | 6% |
Figure 18 shows the fracture surfaces of a representative AM PC/PC specimen in which failure can be described as combined cohesive + adhesive failure, even though most of the adhesive remained at the 3D printed arm. The black vertical lines mark the position of the crack tip from the beginning to the end of test.
4.2 ENF fracture test
4.2.1 D-AM specimens
Tables 4 and 5 summarize the mode II fracture toughness obtained for D-AM specimens. The results indicate that the PC/PC configuration reaches around 794 J/m2 and the PEI/PC around 962 J/m2 considering crack initiation. It has to be noted that in both cases the scatter obtained is considerable and the results have to be taken carefully. Figure 19 and Figure 20 display the fracture surfaces for each configuration. In the figures, the black vertical lines mark the position of the crack tip from the beginning to the end of test.
| J-integral: JIIC (J/m2) | ||
| Specimen | Initiation | Avg. Propagation |
| 20-2226 | 212 | 402 |
| 20-2227 | 646 | 897 |
| 20-2230 | 941 | 1666 |
| 20-2236 | 1397 | 1667 |
| 20-2239 | 1043 | 1427 |
| 20-2241 | 524 | 805 |
| Average | 794 | 1144 |
| Standard dev. | 419.7 | 520.0 |
| CV (%) | 53% | 45% |
| J-integral: JIIC (J/m2) | ||
| Specimen | Initiation | Avg. Propagation |
| 20-2249 | 1065 | 1510 |
| 20-2257 | 1029 | 1391 |
| 20-2258 | 712 | 911 |
| 20-2261 | 1240 | 1854 |
| 20-2262 | 727 | 1167 |
| 20-2266 | 1000 | 1276 |
| Average | 962 | 1352 |
| Standard dev. | 205.8 | 320.2 |
| CV (%) | 21% | 24% |
4.2.2 AM specimens
Table 6 shows the mode II fracture toughness obtained with AM PC/PC specimens where the mode II toughness reached an average of 1384 J/m2. It has to be noted that only two specimens were valid and they present significant scatter. The scatter can be attributed to the crack tip shape (or also known as crack tip blunting) that strongly affects the initiation fracture energy. All the three tests performed on AM PEI/PC specimens resulted in invalid failure modes so the toughness could not be determined for this configuration.
| J-integral: JIIC (J/m2) | ||
| Specimen | Initiation | Avg. Propagation |
| 21-1426 | 964 | 1126 |
| 21-1427 | 1810 | 1980 |
| 21-1428 | * | * |
| Average | 1387 | 1553 |
| Standard dev. | 598.2 | 603.9 |
| CV (%) | 43% | 39% |
Figure 21 shows the fracture surfaces of the AM PC/PC specimens under mode II testing. The surfaces indicate combined failure cohesive + adhesive as in the mode I case. The black vertical lines mark the position of the crack tip from the beginning to the end of test.
4.3 Fatigue onset curves
4.3.1 D-AM specimens
Table 7 shows the fatigue tested D-AM PEI/PC specimens (as best candidate for D-AM based on the static tests), the parameters used in each fatigue test and the number of cycles to reach a 10% increase in compliance.
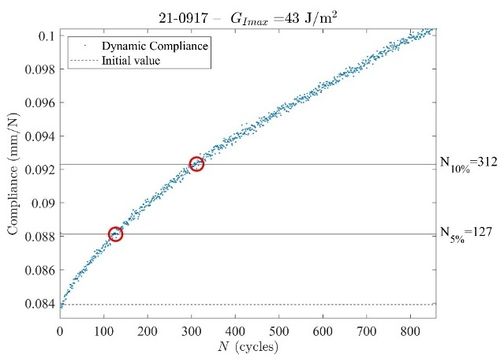
Figure 22 shows the evolution of the compliance of specimen 21-0917 with the maximum energy release rate applied of about Gmax = 43 J/m2. The 10% increase in compliance is found at 312 cycles.
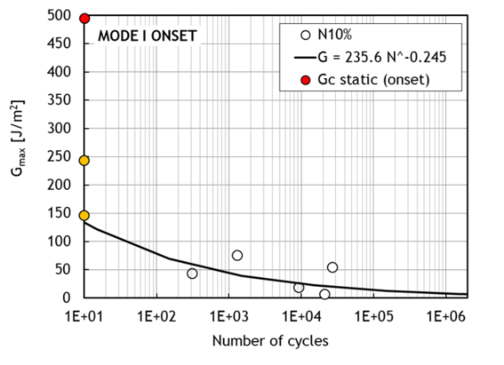
Figure 23 shows the entire Gmax vs. number of cycles curve for the batch and the best-fit with a power-law function.
4.3.2 AM specimens
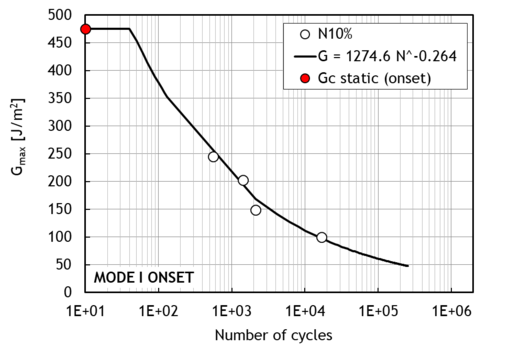
Table 8 shows the fatigue tested AM PC/PC specimens (as best candidate for AM), the parameters used in each test and the number of cycles to have a 10% increase in compliance.
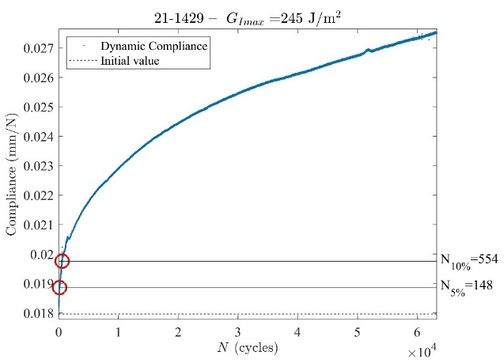
Figure 24 shows the evolution of the compliance of specimen 21-1429 with the maximum energy release rate applied of about Gmax = 245 J/m2. The 10% increase in compliance is found 554 cycles.
Figure 25 shows the entire Gmax vs. number of cycles curve for the batch and the best-fit with a power-law function.
| Specimen | Disp. | R | Freq. | GIc (static) | Gmax | Fmax | Severity | Cycles-to-onset |
| (mm) | (-) | (Hz) | (J/m2) | (J/m2) | (N) | (%) | 10% increase | |
| 21-0909 (*) | 1.4 | 0.1 | 5 | 495 | 243 | 110 | 49 | 10 |
| 21-0916 | 1.9 | 0.1 | 5 | 495 | 146 | 64 | 29 | 10 |
| 21-0917 | 1.9 | 0.1 | 5 | 495 | 43 | 25 | 9 | 312 |
| 21-0918 | 1.4 | 0.1 | 5 | 495 | 19 | 16.4 | 4 | 9273 |
| 21-0919 | 0.7 | 0.1 | 5 | 495 | 7 | 13.5 | 1 | 20934 |
| 21-0912 (*) | 2 | 0.1 | 5 | 495 | 76 | 39.2 | 15 | 1291 |
| 21-0913 | 1.5 | 0.1 | 5 | 495 | 55 | 38.8 | 11 | 26777 |
| Specimen | Disp. | R | Freq. | GIc (static) | Gmax | Fmax | Severity | Cycles-to-onset |
| (mm) | (-) | (Hz) | (J/m2) | (J/m2) | (N) | (%) | 10% increase | |
| 21-1429 | 2 | 0.1 | 5 | 476 | 245 | 110 | 51 | 554 |
| 21-1430 | 2 | 0.1 | 5 | 476 | 203 | 96 | 43 | 1423 |
| 21-1431 | 2 | 0.1 | 5 | 476 | 149 | 79.1 | 31 | 2098 |
| 21-1432 | 2 | 0.1 | 5 | 476 | 100 | 76.1 | 21 | 16989 |
5 Conclusions
An experimental campaign has been carried in the project MAYA for the characterisation of the bonding between PC and PEI material substrates with the glass-fibre/PC organosheet skin of aircraft lining panels as part of the Multifunctional Fuselage Demonstrator project within the Clean Sky 2 programme. In the Level-1 stage of this campaign different beam-like fracture toughness coupons combining PC and PEI substrates bonded to the organosheet skin have been considered. For both materials two manufacturing processes have been studied: i) direct 3D printing on top of the organosheet, D-AM, and ii) adhesive bonding of the 3D-printed substrate, AM. The following conclusions can be drawn from the tests performed (see Table 9 for comparison purposes):
D-AM:
The fracture toughness is higher with the PEI configuration than PC, but in general the fatigue behaviour with D-AM PEI is poor. A lot of scatter was obtained in these tests and the results must be taken carefully.
The complexity to prepare “standard” bending specimens for fracture testing with 3D printed materials is considerable and showed several drawbacks that led to several invalid test results and uncertainty:
1. The 3D printed arms cracked during the test invalidating the test.
2. Too much warping of the 3D printed arm.
3. Crack migration/jump into other interfaces (e.g., GFRP reinforcement).
AM:
Similar problems were found when testing AM specimens with adhesive even adding a further complexity when performing the bonding between the two arms.
The toughness is higher than the D-AM specimens but significant scatter is still observed. Thus, the results must be taken carefully.
| Material |
[Init. / Prop.] |
[Init. / Prop.] |
Fatigue tests
(best candidates) | |
| D-AM | PC/PC | 395±93/ 543±166 | 794±420/ 1144±520 | û |
| PEI/PC | 495±140/ 922±217 | 962±206/ 1352±320 | ||
| AM | PC/PC | 476±34.5/ 634±38.8 | 1387±598/ 1553±604 | |
| PEI/PC | INVALID TESTS | û | ||
Acknowledgements
The funding support for the MAYA project from the Clean Sky 2 Joint Undertaking under the European Union’s Horizon 2020 research and innovation programme under grant agreement No 831989 is acknowledged. The support from LEITAT and IPC to carry out the work described in this communication is also acknowledged.
References
[1] C. Sarrado, A. Turon, J. Renart, J. Costa, An experimental data reduction method for the Mixed Mode Bending test based on the J-integral approach, Composites Science and Technology, 117, 85-91 (205). https://doi.org/10.1016/j.compscitech.2015.05.021
[2] J. Renart, J. Costa, C. Sarrado, A. Turon, S. Budhe, A. Rodriguez-Bellido, Mode I fatigue behaviour and fracture of adhesively-bonded fibre-reinforced polymer (FRP) composite joints for structural repairs, Fatigue and Fracture of Adhesively-bonded Composite Joints (2015). https://doi.org/10.1016/B978-0-85709-806-1.00005-7
[3] P. Maimí, N. Gascons, L. Ripoll, J. Llobet, Mixed mode delamination of asymmetric beam-like geometries with cohesive stresses, International Journal of Solids and Structures, 155, 36-46 (2018). https://doi.org/10.1016/j.ijsolstr.2018.06.032
Document information
Published on 22/01/22
Accepted on 22/01/22
Submitted on 22/01/22
Volume 06 - AEMAC en PROYECTOS EUROPEOS (2022), Issue Núm. 1 - Monográfico Proyectos Europeos, 2022
DOI: 10.23967/r.matcomp.2022.01.004
Licence: Other
Share this document
Keywords
claim authorship
Are you one of the authors of this document?
