Resum
A mesura que el codi d'un programa creix en tamany i complexitat, es torna cada cop més difícil de mantenir sota control i actualitzat amb les últimes novetats, especialment quan la feina de desenvolupament esta compartida amb un gran grup d'usuaris. Amb aquesta premisa és facil entendre perqué en els ultims anys, l'enfasi en el diseny d'un programa ha canviat de ser la creativitat en la creació de procediments a centrar-se en plantejaments més eficients de sistemes d'organizació de dades.
Els codis d'elements discrets actuals aprofiten les capacitats de computació en paralel (tan en maquines de memoria compartida com distribuïda) per incrementar el nombre de partícules o la durada de les simulacions i aixo seria complicat de conseguir sense una bona organizació de la estructura en el codi.
En aquest contexte, l'objectiu principal d'aquesta tesi és la implementació eficient d'una llibreria de models constitutius per a simulacions basades en elements discrets. Una estructura flexible i ben definida en la que modificar o introduir noves equacions constitutives sigui més senzill i al mateix temps es minimitzi el risc d'introduir errors que afectin a la correcta execució del programa.
També s'ha actualitzat la interficie d'usuari existent on es realitza la entrada de dades per poder utilitzar les millores introduïdes en la aplicació d'elements discrets.
Finalment, s'han dut a terme alguns exemples classics com l'assaig de compressió simple (UCS) o l'assaig triaxial a differents nivells de confinament utilitzant dues de les lleis constitutives disponibles actualment a l'aplicació de DEM i s'han analitzat els resultats obtinguts comparant-los amb dades experimentals publicades.
Paraules clau: metode dels elements discrets, material no lineal, classe heredada, materials granulars cohesius, formigó, tests de compressió triaxial
1 Introduction and Objectives
As a program increases its size and complexity, it can rapidly turn into something pretty difficult to keep controlled and up-to-date, specially when the developing work is shared between an extensive group of users. Keeping this in mind, it is pretty straightforward to understand why over the last few years, the emphasis in the design of programs has shifted from the design of procedures and toward an efficient organization of data.
A set of related procedures with the data they manipulate is often called a module. Structuring your code into clearly separated modules, each one with its data hidden within them, makes it far more easy to introduce new modules when needed, while at the same time, it greatly reduces the resources required to identify and fix programming issues since it will, most of the times, be located in this new introduced module.
Applying these concepts to the computationally intensive discrete element methods (DEM) is specially indicated. Modern DEM codes usually take advantage of parallel processing capabilities (shared or distributed systems) to scale up the number of particles or length of the simulation and this would be more difficult to achieve without good foundations in the code structure.
In this context, the main objective of this work is to implement an efficient constitutive model library for discrete element based simulations. A well-defined and flexible structure in which modifying or introducing new constitutive equations would be easier, keeping the main program strategy mostly unchanged while minimizing, at the same time, the risk of error during the execution of the program. Furthermore, the existing basic user interface currently used for introducing the data in the pre-process stage will need to be updated in order to use the newly introduced developments in the DEM code.
The thesis is organized as follows. First of all, the basic concepts on the Kratos Multi-Physics Platform and a brief overview of some of the C++ language capabilities are introduced in the second chapter, followed by a description of the currently implemented discrete element method within the Kratos framework.
In the third chapter we will focus on the structure definition and implementation of the DEM constitutive laws library. This includes an overview of the recent development on the Kratos discrete element application, an in-depth analysis of the currently available constitutive models in the library and the main characteristics of the program interface.
Finally, in the fourth chapter, several numerical examples will be run using the available constitutive equations from the library, comparing the obtained simulation results with published experimental data.
2 State of the Art
2.1 Introduction
In numerical methods, and particularly in the discrete element field, many different constitutive models have been published in the last years to try and reproduce the behavior of multiple engineering materials. With this background in mind, it was reasonable for us to consider developing a reliable structure which would allow any developer to switch between models and implement new constitutive equations faster than requiring a completely new file structure to be implemented.
In the present work we have focused our efforts on developing a C++ library based on a class-derived structure for discrete element simulations within Kratos.
Particularly, this chapter will be devoted to present some basic concepts on the Kratos Multi-Physics Platform, emphasizing its internal structure defined by the kernel and all the integrated applications and the need of using an scripting language as a bridge between the preprocessed problem and the compiled code; then briefly expose the most relevant advantages and disadvantages of including the discrete element application within this framework.
2.2 Basic concepts on the Kratos Multi-Physics Platform and application programming
Before getting into the implementation of the library structure and running some examples, we should explain how are we going to develop such structure and get useful results. In this chapter a set of methods and tools related with the implementation process will be presented. All these tools will provide us with the proper framework to achieve our objective of creating and using a constitutive model library in our simulations.
Kratos Multi-Physics is designed as an Open-Source framework for building multi-disciplinary finite element programs aimed at solving many engineering problems. It is written in C++ and is designed to allow collaborative development by large teams of researchers focusing on modularity as well as on performance. This framework features a “core” and “applications” approach where “standard tools” (such as databases, linear algebra, search structures, etc...), come as a part of the core and are available as building blocks in the development of “applications” which focus on the solution of the problems of interest.
In addition to this, the Kratos platform has an innovative variable base interface designed to be used at different levels of abstraction and implemented to be clear and extendible. It also provides an efficient yet flexible data structure which can be used to store any type of data in a type-safe manner. Python scripting language is used to define the main procedure of Kratos which significantly improves the flexibility of the framework. The kernel and application approach is used to reduce the possible conflicts arising between developers of different engineering fields. Also a layered system is designed to reflect the personal working space of each developer, considering their programming knowledge.

|
| Figure 1: KRATOS' logo. |
Finally, in order to get ahead of the trends for the current software market requirements, Kratos is fully parallelized for Shared Memory Machines (SMMs) and Distributed Memory Machines (DMMs) while providing tools for its many applications to easily and efficiently adapt their algorithms to these architectures. Its scalability has been verified up to thousands of cores.
2.2.1 Advantages of using the Kratos Platform
Due to Kratos focus on FEM-based codes development one may think it may not be suitable for other type of codes but there actually are many other applications that fit perfectly in its structure and data base. The Discrete Element Method solves a physical problem, it does have elements which contain nodal values and elemental properties; those nodes have boundary conditions, a basic PDE have to be solved during the calculation of the particle motion, it also requires a search to be done and those discrete elements are usually involved in media that can be modeled using FEM.
So what do we have at our disposal if we decide to work with this platform?,
- The kernel of Kratos: The overall structure and data base of the Kratos core allows the developer to focus on creating efficient algorithms and a better strategy for solving a problem than wasting its time and efforts organizing the infrastructure for a new code. Kratos as a package covers all these basic requirements (management of data, object properties, solvers, search utilities, libraries and much more) and is ready for the engineer to develop their own application and research.
- The graphical interface: All the applications developed within this framework can directly take advantage of the Input and Output data system linked with GiD, the pre and postprocessing software, for geometry design and visualization of results.
- The Kratos community will always welcome new developers, researchers or students in their group. Belonging to a community makes troubleshooting easier as many other users will probably had find themselves facing a similar problem before you and will offer their help. This is also a meeting point for knowledge sharing and cooperation that gives people the chance to learn from many others and improve their applications.
- Kratos repository : With the subversioning system and the daily benchmarking, multiple developers can work on the same code and avoid programming conflicts when implementing new capabilities in the applications.
- Coupling capabilities: One of the main advantages of this platform is its ability to couple different applications within the same framework. Since every application developed in Kratos is set in the same structure, it is pretty straight forward to couple any application with another one. Thereby, the DEM-FEM applications emerge using the DEM and FEM applications without the need of rewriting those codes, creating a common strategy combined with its correspondent interface.
2.2.2 Use of Python scripting language
Although it was not strictly required, for us, the use of a high-level programming language makes it considerable easier for the user and developer to interact with the core of our program since Python can be embedded in existing applications that need a programmable interface.
Python first appeared on 1991 with its design philosophy focusing on code readability and a syntax that would allow us, as application developers, to express concepts (solver strategy, data postprocess, etc...) in fewer lines of code than would be possible in other lower-level languages like C++. This language provides constructs intended to enable clear programs while at the same time, supports multiple programming paradigms (the way we build the structure and elements of a computer program) including object-oriented and structured programming.
Its dynamic type system and automatic memory management makes it easier to implement new or modify existing scripts without having to recompile the code. That being said, as high-level language, most of the low-level workload is given to the CPU so the computation speed can be greatly reduced.
2.2.3 Overview of the C++ language capabilities
C++ is arguably the most versatile language in common use. C++ allows for both high-performance code as well as expressive abstractions and design constructs. The language is not perfect but it does represent an excellent compromise between these potentially conflicting language capabilities.
The defining feature which distinguishes C++ from C is support for Object-Oriented Programming (OOP). This makes C++ a multi-paradigm programming language. Other languages, as the previously introduced Python, also allow the programmer to write code in this object-orientated way. The key difference between C++ and these languages is that C++ is designed to be compiled into efficient low-level code which can run directly on the processor of a computer.
For the development of this work, the most important capability of the C++ programming language is probably its ability to work with classes and inheritance. A class is the building block of program built using the object-oriented methodology. Such programs consist of independent, self-managing modules and their interactions. Using mainly inheritance and derivated classes, we will be able to implement an efficient constitutive model library for our application.
2.2.4 Discrete Element Application
Before proceeding with the changes in the overall structure of our application, it is a good idea to give a brief insight into how the current code is organized. As all the other applications implemented within the Kratos framework, the DEM application code is free and open-source, an anyone is welcome to download it from the official Kratos repository and give it a try (https://kratos.cimne.upc.edu/projects/kratos/repository).
2.2.4.1 DEM basic algorithm
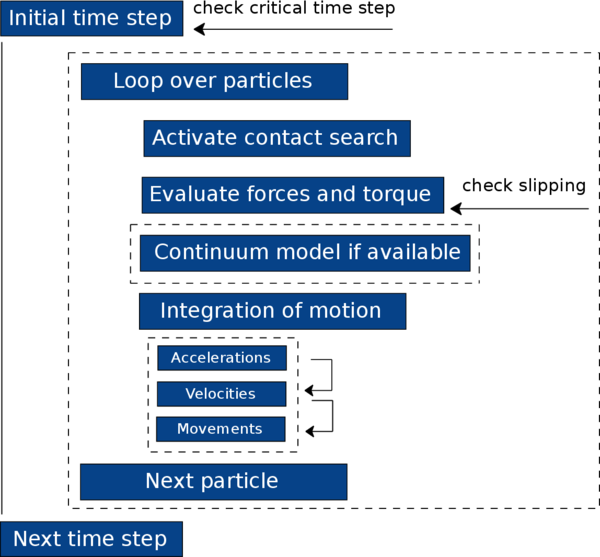
The current algorithm implemented in the Kratos DEM-application is very similar to the one introduced by Cundall [1] back in 1979. As most of the commercial codes available today, the DEM-application follows a basic calculation sequence (Figure 2).
|
| Figure 2: DEM code sequence. |
Using the particle as basic entity for our algorithm instead of the contact represents an advantage, for example when introducing parallelism, but at the same time it may not be optimal in terms of the computational resources required.
Looping over a particle element is more versatile. Parallelization wise, this is the optimal way of programming the application since available memory can be easily divided with simple geometry functions and thus reducing the communication between processors at minimum. If we consider DEM basic calculations, looping over contacts would still be a better strategy for minimizing the required operations. But this approach, as we now know, is not the only one. Other approaches would require better optimized strategies, for example when including fluid-particle interaction.
If we loop over particles we will soon realize we are actually calculating the existing contact forces between them twice for every time-step. This is one of the major drawbacks of this algorithm since it require the operations to be done for every contacting particle.
In addition to this, when considering continuum simulations, other specific operations are required increasing the algorithm cost even further.
Continuum problems were originally considered as one particular case of discrete element simulations, but subsequently became a separate element in its own right. When aiming to model a continuum, there are lots of extra specific variables that require to be stored and mapped accordingly. This mapping procedure will take place each timestep in which new contacts are computed in order to efficiently identify which of those contacts are the current ones. If a particle approach is considered, every sphere will need an array of values where to store all these additional member variables associated with the element while in a contact oriented approach we would be linking them to its associated contact instead.
|
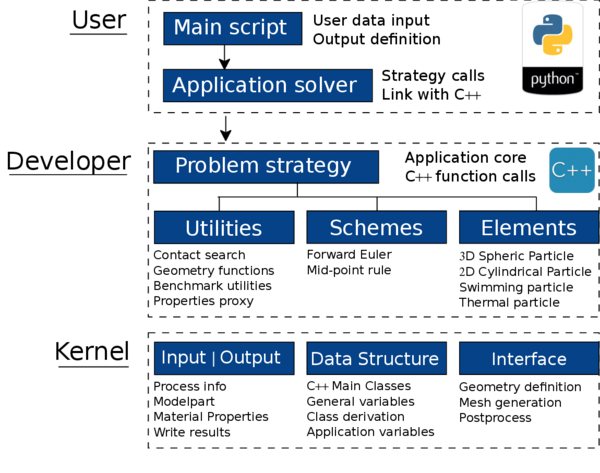
| Figure 3: Kratos application structure. |
2.2.4.2 Kratos DEM base structure
The underlying structure of the DEM application (see Fig. 3) is very similar to the other applications (although them being FEM-based) implemented in Kratos since one of the main guidelines when programming within this framework is to follow the same basic structure in order to maintain the current coupling capabilities between applications.
Although fitting a new Kratos-supported application in that fixed structure may require quite an additional effort it is long-term worth it if we aim to have as much versatility as possible.
2.2.5 DEM parallelization procedures
Current codes, specially DEM-based codes which typical flows can contain up to billions of particles on large cluster computing resources, would not be able to perform such simulations without a parallelized structure. One of the advantages of using DEM is that code parallelization is quite easy to achieve, but before parallelizing the code, we should optimize those lines for single CPU execution. Many optimization techniques can accelerate performance in cache-memory systems and many tools are available for performance profiling.
The purpose of introducing parallelism into a code is to reduce the elapsed time used for execution. The elapsed time is the time that elapses from when the first processor starts execution to when the last processor completes execution. The discrete element method in its conception is based on calculating each particle independently resulting in the main procedures in the computational strategy to be easily adopted into a parallel scheme.
There are two types of cluster computing architectures. While Shared Memory Machines (SMM) offer single memory allocation shared by all the available processors, with Distributed Memory Machines (DMM) each logical processor has its private memory and computational tasks can only operate on local data. If access to remote data is required, it must then communicate with the remote processor containing that data. OpenMP (Open Multi-Processing) for SMM systems and MPI (Message Passing Interface) for DMM are two widespread suitable parallelization techniques in C++.
   void InitializeContactElements(){
        KRATOS_TRY

        ElementsArrayType pContactElements = GetAllElements(*BaseType::mpContact_model_part);
        vector<unsigned int> contact_element_partition;
        OpenMPUtils::CreatePartition(BaseType::mNumberOfThreads, pContactElements.size(), contact_element_partition);

       #pragma omp parallel for
       for (int k = 0; k < BaseType::mNumberOfThreads; k++){
           typename ElementsArrayType::iterator it_contact_begin=pContactElements.ptr_begin()+contact_element_partition[k];
           typename ElementsArrayType::iterator it_contact_end=pContactElements.ptr_begin()+contact_element_partition[k+1];

               for (typename ElementsArrayType::iterator it_contact= it_contact_begin; it_contact!=it_contact_end; ++it_contact){
                   (it_contact)->Initialize();
               }   //loop over CONTACT ELEMENTS
           } // loop threads OpenMP

       KRATOS_CATCH("")
   }
In this example function, the pragma omp parallel operation ( see Listing list:parallel-example) loops over the available threads and equally divides the existing particle contacts between them.
2.3 The Discrete Element Method
2.3.1 DEM basics for continuum
Since it was firstly introduced by Cundall and Strack [1] an extensive research work on the discrete element method (DEM) has been carried out in the last decades. The basic idea is to be able to simulate the mechanical behavior of a group of rigid particles arbitrarily disposed while considering those particles to be part of a more complex system. Each element is considered an independent object and the overall behavior of the system is determined by the defined cohesive or frictional contact laws.
Although the DEM has been proved to be an effective numerical technique to accurately reproduce the behaviour of non cohesive and cohesive granular assemblies [2,3,4,5], in recent years much of the research efforts have focused on the development of adequate DEM models applied to the study of multifracture and failure of geomaterials (soils and rocks), concrete, masonry and ceramic materials, among others [6,7,8,9].
When considering continuum simulations, appropriate contact laws are required to be defined in order to obtain the desired macroscopic material properties. The contact law can be seen as the formulation of the material model at the microscopic level in which cohesive bonds between rigid particles can be broken simulating the fracture of the material and its propagation through the media. For this, the analysis of solids with the DEM poses a number of difficulties for adequate reproducing the correct constitutive behaviour of the material under linear (elastic) and non linear conditions.
Within the analysis of solids, the material is typically represented as a collection of rigid particles (spheres in three dimensions (3D) and discs in two dimensions (2D)) interacting among themselves at the contact interfaces in the normal and tangential directions while material deformation is assumed to be concentrated at the contact points.
The discrete element algorithm from a computational point of view involves three steps:
- Contact search algorithm
- Evaluation of contact forces
- Integration of particle motion
The interaction forces are computed when elements slightly interpenetrate each other. This force-displacement formulation is often referred to as a Smooth contact method. In the next step Newton's second law is used to determine, for each discrete element, the resulting acceleration, which is then time integrated to find the new particle position. The process is repeated until the simulation is finished.
2.3.2 Contact search algorithm
2.3.2.1 Contact search
Discrete elements have no connectivities between their nodes, so transferring the interaction forces and its related accelerations, velocities and displacements are done using a contact criteria between element pairs. A contact is created when one discrete element intersects another. Having a good contact search algorithm is very important since it can take to of the computational costs.
Normally, the objects move freely around the assembly and the contact is determined when an overlap occurs and thus producing an interaction. Low overlapping (between and ) is usually preferred to obtain realistic results. Since the contact search step is pretty expensive, it would be wise to limit the this operation as much as possible. If the time step is sufficiently small, there is no need to update the contacts at every time step of the simulation, but at the same time, delaying the search too much can lead to excessive indentations and produce instabilities in the simulation due to the huge amount of localized energy in the contact.
Following with the contact search implementation, the most simple approach is to identify interaction pairs by checking every single particle against every other one. But, of course, that would be the most inefficient way of doing it as the operations needed would be proportional to , where is the number of elements. There are strategies to avoid such an expensive scheme, for example the well-known Grid-based algorithms and the tree-based ones.
Grid based algorithms define a rectangular grid dividing the entire domain into small cells. A unified bounding box is adopted to represent the discrete elements (of any shape) and then, the potential contacts are determined by selecting the surrounding cells where each target element is centered on. In our formulation the contact search is performed using a grid-based algorithm and the computational time is proportional to ln, which allows us to solve large contact systems with many particles [10]
On the other hand, in the tree-based algorithms each element is represented by a single point. Starting from the centered one, it splits the domain in two sub-domains obtaining the points with larger x-coordinate in one sub-domain and points with smaller values of x-coordinate in the other one. The method then proceeds to the next point, alternating each time the splitting dimension and obtaining a tree structure. Finally, for each particle, the nearest neighbors are determined following the tree in upwind direction.
2.3.2.2 Contact interface
We can assume each individual particle connected to the adjacent ones by appropriate relationships at the contact interfaces. These relationships define either a perfectly bond or a frictional sliding situation at the interface.
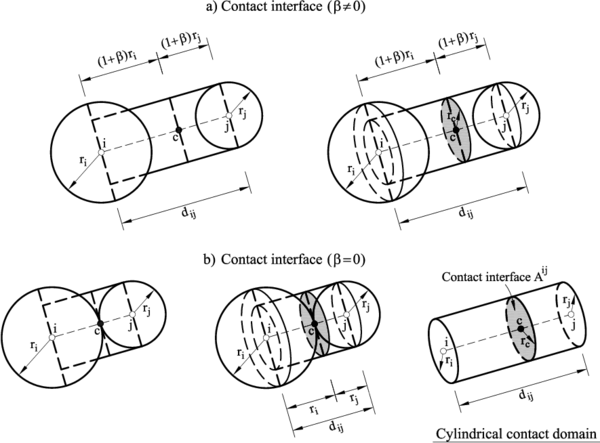
Particles are assumed to be spherical and can have very different sizes. Each particle is characterized by the sphere radius . We will assume that particles and are in contact at a point located at a distance ( or ( from the centers of particles and , respectively (Figure 4) where is a positive number (typically) . We define the interaction domain between the two particles that share the contact point as a cylinder of radius equal to the radius of the smaller of the two particles in contact. The circular section at point of radius is the contact interface between particles and .
This definition of the contact interface and the interaction domain is motivated by the fact that the two interacting particles can have very different radius for an arbitrary distribution of the particle sizes. The contact interface definition depends on the constitutive model (in this case is limited by the size of the smaller of the two particles in contact).
2.3.2.3 Interaction range
The overall behaviour of a material can be reproduced by associating a simple constitutive law to each contact interface. The interaction between spherical (in 3D) or circular (2D) particles and with radius and , respectively is defined within an interaction range. This range allows for a certain gap or an overlapping between the particles. Then two particles will interact if
|
|
(1) |
where is the distance between the centroids of particles and and is the interaction range parameter (Figures 8 and 4). With this formulation, the DEM can simulate materials other than simple granular materials, in particular those which involve a matrix ( as it is found in concrete, cement and rock). A value of is chosen in order to model the effect of this matrix that may glue two aggregates which are not themselves in contact. This way the model can handle the presence of gaps and overlappings generated by most of the sphere meshers. The contact search can be extended using a value of and the equilibrium position of the contact point is then set for its initial configuration (which is not always a tangential contact of particles). This works inwards for particle inclusions or outwards for gaps.
From Eq.(1) we deduce
|
|
(2) |
where the sign accounts for the gap and overlapping between the two particles.
|
| Figure 4: Definition of contact interface. (a) . (b) |
2.3.3 Evaluation of contact forces
Once contact between a pair of particles has been detected, the forces occurring at the contact point are calculated. The interaction between the two interacting particles can be represented by the contact forces and , which satisfy the following relation:
|
|
(3) |
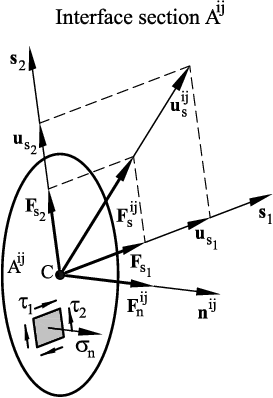
We decompose into its normal and shear components, and , respectively (Figure 5)
|
|
(4) |
where is the unit vector normal to the contact interface between particles and and is the modulus of the normal force at the interface. Eq.(4) implies that the normal force lies along the line connecting the centers of the two particles in contact and directed outwards from particle (Figure 5).

|
| Figure 5: Decomposition of the contact force into its normal and tangential components |
|
| Figure 6: Forces and stresses acting on a contact interface section . Definition of normal and shear directions |
The shear force along the shear direction (Figure 6) can be written as
|
|
(5) |
where and are the shear force components along the shear directions and , and and are unit vectors in these directions. Vector is taken in an arbitrary direction orthogonal to the normal vector. Then .
The shear force modulus is obtained as
|
|
(6) |
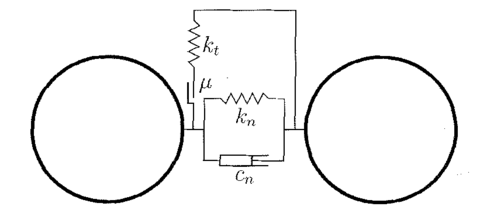
The contact forces , and and the particle displacements are obtained using a constitutive model formulated for the contact between two rigid particles. For the simplest formulation the contact interface is characterized by the normal and tangential stiffness and respectively, a frictional device based on Coulomb law with friction coefficient and a contact damping coefficient as shown in figure 7.
|
| Figure 7: Contact model |
Other specific models can define more complicated rheologies in order to reproduce the physics of a problem. In this work two non-linear frictional contact with damage and plasticity will be introduced as part of the constitutive model library.
2.3.4 Equations of motion
2.3.4.1 Basic equations
The translational and rotational motion of rigid spherical or cylindrical particles is described by means of the standard equations of rigid body dynamics. For the -th particle we have
|
|
(7) |
|
|
(8) |
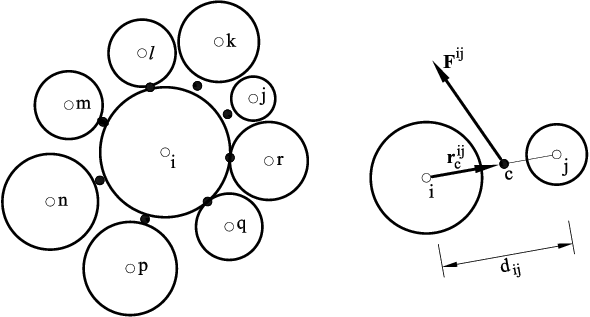
where is the particle centroid displacement in a fixed (inertial) coordinate frame , – the angular velocity, – the particle mass, – the moment of inertia, – the resultant force, and – the resultant moment about the central axes. Vectors and are sums of: (i) all forces and moments applied to the -th particle due to external loads, and , respectively, (ii) contact interactions with neighbouring particles (Figure 8), , where is the number of particles being in contact with the -th particle, (iii) forces and moments resulting from external damping, and , respectively. Thus, we can write
|
where is the vector connecting the centroid of the -th particle with the contact point at the interface between particles and (Figure 8).
|
| Figure 8: Force at the contact interface between particles and |
The form of the rotational equation (8) holds for spheres and cylinders (in 2D) and is simplified with respect to a general form for an arbitrary rigid body with the rotational inertial properties represented by a second order tensor. In the general case it is more convenient to describe the rotational motion with respect to a co-rotational frame which is embedded at each element, since in this frame the tensor of inertia is constant.
2.3.4.2 Integration of the equations of motion
Equations (7) and (8) are integrated in time using a standard central difference scheme [11]. The time integration operator for the translational motion at the -th time step is as follows:
|
|
(11) |
|
|
(12) |
|
|
(13) |
The first two steps in the integration scheme for the rotational motion are identical to those given by Eqs.(11) and (12):
|
|
(14) |
|
|
(15) |
The vector of incremental rotation is calculated for the th particle as
|
|
(16) |
Knowing the incremental rotation we can now update the tangential contact forces. It is also possible to track the rotational position of particles, if needed. Then, the rotation matrices between the moving frames embedded in the particles and the fixed global frame must be updated incrementally using an adequate multiplicative scheme [12].
Explicit time integration yields high computational efficiency and allows us to solve large models. The disadvantage of the explicit integration scheme is its conditional numerical stability imposing a limitation on the used time step [12], i.e.
|
|
(17) |
where is a critical time step determined by the highest natural frequency of the system as
|
|
(18) |
If damping exists, the critical time increment is given by
|
|
(19) |
where is the fraction of the critical damping corresponding to the highest frequency . Exact calculation of the highest frequency requires the solution of the eigenvalue problem defined for the whole system of connected rigid particles. In an approximate solution procedure, an eigenvalue problem can be defined separately for every rigid particle using the linearized equations of motion
|
|
(20) |
where
|
|
(21) |
and is the stiffness matrix accounting for the contributions from all the interface constraints that are active for the -th particle.
The maximum frequency can be estimated as the maximum of natural frequencies of the mass-spring system defined for all the particles with one translational and rotational degrees of freedom.
|
|
(22) |
and the natural frequency for each system is then defined as
|
|
(23) |
with the spring stiffness and the mass of the particle .
2.4 Kratos user interface and problem definition
2.4.1 GiD. The Pre and Post Processor
From a user point of view, being able to edit the geometry of a model and visualize the results obtained after running the simulation is essential. There are a huge amount of software available in the market for doing so but, without having access to its source, it would be impossible to customize it to our own needs.
GiD is a versatile multipurpose software developed at CIMNE specialized in the pre-process and post-process stages (http://gid.cimne.upc.edu). It has CAD tools for drawing the geometry, as well as a mesh generator for obtaining the spatial discretization of the model. Furthermore, its customization options makes it highly compatible with any implemented Kratos application allowing the developer to embed customized modules specifically designed for a problem of interest, called "Problem Types", which enhance GiD pre-processing capacities so as to define all the relevant components of the model, i.e., boundary conditions, loads, material properties and computation parameters.
Using that underlying structure, an specific graphical interface has been created for the DEM-Application. Thereby, by using GiD along with an specific problem-type, one can prepare a model and run the simulation all-together within GiD.
2.4.1.1 The pre and post process stages
In this stage, the user will be able to use the GiD CAD system to define the geometry and the required data for the simulation as well as the problem boundary conditions and computational options. Once the the geometry has been completely defined we can proceed with the mesh generation. GiD has at its disposal a large variety of options for the generation of finite element and discrete element meshes that are used in DEM simulations. Each application problemtype has specific options and input parameters designed for that application and loading that problemtype will automatically customize the visual interface according to the application requirements.
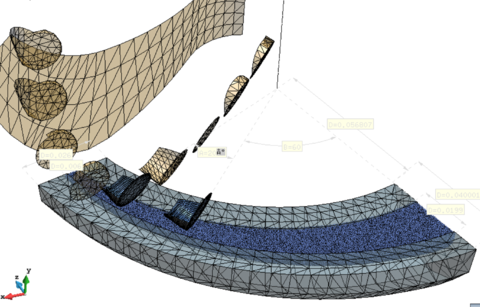
|
| Figure 9: Bottom hole assembly blade pre-process and meshing. |
Once the simulation ends, it is possible to switch to the post-process interface and visualize the results. Depending on the output options selected in the previous stage, the user will be able to plot multiple different results (force vectors, displacement contour fills, deformed mesh, graphs...) and switch or combine them freely.
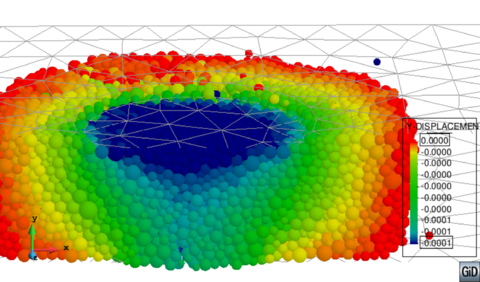
|
| Figure 10: Contour fill of Y-Displacement in a shear stress test specimen. |
3 Implementation of the DEM Constitutive Laws Library
3.1 Introduction
The idea of creating an application centered on the use of discrete elements within the Kratos framework was first introduced with the objective of providing this platform with basic capabilities to solve some very specific engineering problems that appeared in the last years. The DEM code was originally aimed to cover the increasing market interest in simulating the behavior of granular material at large scale. That initial approach was highly productive and it was decided to keep developing the application while eventually the idea of introducing continuum media capabilities was proposed.
Being able to model individual particles as stiff bodies and visualize the force networks formed in a granular media, transforming complicated microscopic behavior into a simple system of linear equations is what makes DEM such an interesting method.
However, trying to model the macro behavior of continuum media introducing micro parameters in the particle contacts proved to more complex than initially expected. While the DEM method is commonly accepted to accurately simulate a wide variety of granular flow and rock mechanics situations, producing results that agrees well with experimental findings in a wide range of engineering applications, it is difficult to consider the continuum media simulations can achieve a similar accuracy even if it produces more realistic results than FEM when modeling fracture.
As the method evolved a vast number of different approaches on how to correctly characterize a contact model at micro scale in order to to obtain the expected macro scale continuum behavior appeared. Those approaches could generally divided in two main types. The global one, in which homogeneous DEM properties are considered in the whole assembly and the local approach, where DEM parameters a assumed to depend on the local properties of the interacting particles.
Following a global approach, some authors [13] have used numerical experiments to determine a dimensionless relationship between DEM and continuum parameters. This method has been used in previous works and also by C. Labra [10] in the Fortran-based DEMPack software. Other typical procedures for estimating the global parameters in a discrete element simulation are based on the definition of an average particle radius applied to the whole discrete element assembly while establishing empirical relationships between the global parameters and the continuum parameters with several laboratory tests.
The second approach, used in our current application implemented within Kratos, is to consider a each interaction between particles as unique with its associated local properties (radii, density, stiffness,...). Many alternatives for estimating the value of this parameters have been reported in the last years.
With this background in mind, it was reasonable to consider developing a reliable structure which would allow us to switch between models and implement new constitutive equations in a faster way than in the existing code. In the following chapter the implementation of the constitutive model library will be described step-by-step.
3.2 Implementation of a constitutive library
The transition of the existing models to the new class-derived structure was carefully planned within the Kratos team over several days before it actually took place and went quite smoothly given all the support from the community. All the changes made can be summarized as follows:
- First of all, a quite good understanding of the existing structure is required since the parts of the code we are aiming to isolate are deeply rooted within the code.
- Once all those parts have been identified we can proceed to create the main files of the new structure which will contain the class basetype for each discontinuum and continuum models. These files will be used to declare the functions and variables required in the models we plan to move into the library later on.
- With the main files of the library structure defined, we are now able to begin migrating the different parts of the existing code containing model-dependent functions to its specific file inside the model library.
- Finally, all the existing calls to model-dependent functions are required to be updated to access the external files used to define the constitutive equations in the library.
The new process chart are schematically represented in Figure 11.
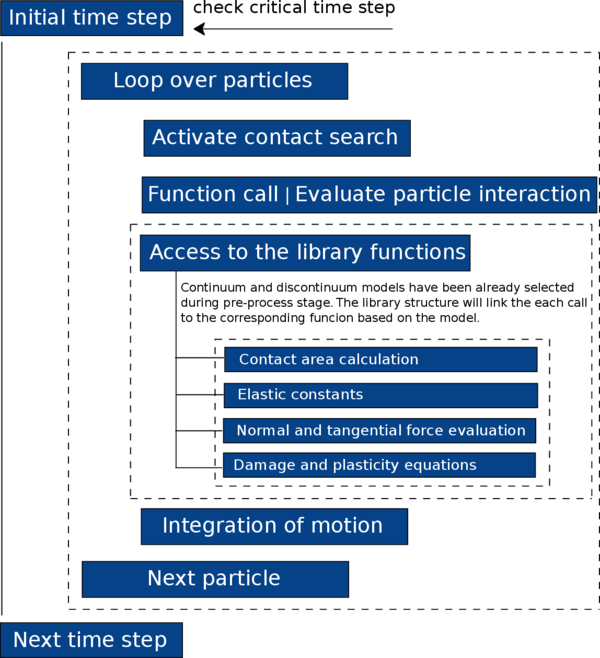
|
| Figure 11: Updated flowchart of the analysis with DEM and the implemented constitutive library. |
At this point, in order to properly understand the concepts explained here, it is important to describe in detail those stages and state the reason for which they are required.
3.2.1 Understanding the existing structure
Previous to the re-structure, all the constitutive equations were integrated in the main DEM code making it pretty difficult to try new models without messing up the existing one. For the same reason, only one model could be implemented and running at a time since all the variables and functions that would depend on the constitutive model were coded in the main file of the DEM application.
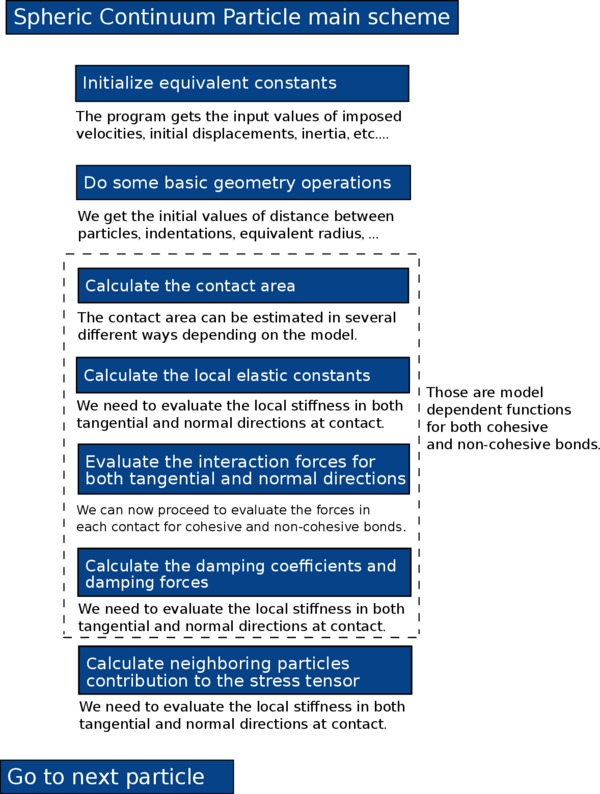
|
| Figure 12: Pseudo-code of the spheric continuum file. |
In figure 12 the current code structure for solving particle interaction are briefly explained. Some of the key functions that would need to be migrated to an external model dependent file were:
- The force calculation function for both normal and tangential direction in each particle contact.
- The estimation of the local elastic constants in the interacting particles.
- The considered effective area in the contact elements.
- The effect of the viscodamping in the contact behavior.
Special attention are given to all the variables involved in these functions since a minimum mistake in the assigned arguments would result in a program error difficult to track down.
3.2.2 Creating the new file structure
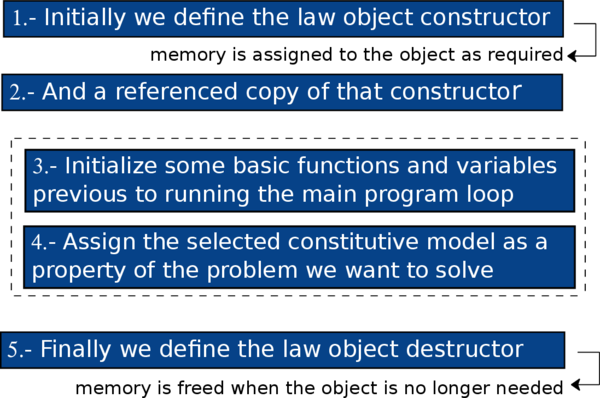
We can now proceed to create the main files of the new structure with their respective header files. The DEM_continuum_constitutive_law.cpp will contain the required basic functions such as the base constructor, destructor and initialize which will allow us to create a DEM constitutive law object for each particle contact as shown in Listing list:law-constructor.
   #include "DEM_application.h"
   #include "DEM_continuum_constitutive_law.h"

   namespace Kratos{
   1.- DEMContinuumConstitutiveLaw::DEMContinuumConstitutiveLaw(){
       //      std::cout << " Law constructor.." << std::endl;}

   2.- DEMContinuumConstitutiveLaw::DEMContinuumConstitutiveLaw(const DEMContinuumConstitutiveLaw rReferenceContinuumConstitutiveLaw){
       //      std::cout << " Law copy constructor.." << std::endl;}

   3.- void DEMContinuumConstitutiveLaw::Initialize(const ProcessInfo rCurrentProcessInfo){}

   4.- void DEMContinuumConstitutiveLaw::SetConstitutiveLawInProperties(Properties::Pointer pProp) const{
           std::cout << " Assigning DEMContinuumConstitutiveLaw to properties " << pProp->Id() << std::endl;
           pProp->SetValue(DEM_CONTINUUM_CONSTITUTIVE_POINTER, this->Clone());}
       DEMContinuumConstitutiveLaw::Pointer DEMContinuumConstitutiveLaw::Clone() const{
           DEMContinuumConstitutiveLaw::Pointer p_clone(new DEMContinuumConstitutiveLaw(*this));
           return p_clone;}

   5.- DEMContinuumConstitutiveLaw:: DEMContinuumConstitutiveLaw(){  //std::cout << "Law destructor..." ;}
   }
|
| Figure 13: Pseudo-code for the object creation shown in Listing list:law-constructor. |
In the header file DEM_continuum_constitutive_law.h we define the newly created constitutive law object as a derived of the main spheric continuum class. At the same time, we need to define all the functions that we plan to encapsulate inside any constitutive model.
   namespace Kratos{

       /* Base class of constitutive laws.*/
       class SphericContinuumParticle; // forward declaration

       class DEMContinuumConstitutiveLaw : public Flags{
       public:
           KRATOS_CLASS_POINTER_DEFINITION(DEMContinuumConstitutiveLaw);
           DEMContinuumConstitutiveLaw();
           DEMContinuumConstitutiveLaw(const DEMContinuumConstitutiveLaw rReferenceContinuumConstitutiveLaw);

           virtual void Initialize(const ProcessInfo rCurrentProcessInfo);
           virtual void SetConstitutiveLawInProperties(Properties::Pointer pProp) const;
           virtual  DEMContinuumConstitutiveLaw();
   1.-     virtual void CalculateContactArea(double mRadius, arg_2, arg_3,... ){};
   2.-     virtual void CalculateElasticConstants(double kn_el, arg_2, arg_3,... ){};
   3.-     virtual void CalculateNormalForces(double LocalContactForce[3], double kn_el){};
   4.-     virtual void CalculateTangentialForces(double LocalContactForce[3], arg_2, arg_3,... ){};
   5.-     virtual void CalculateViscoDampingCoeff(double kn_el, arg_2, arg_3,... ){};
   6.-     virtual void CalculateViscoDamping(double LocalRelVel[3], arg_2, arg_3,... );

   }
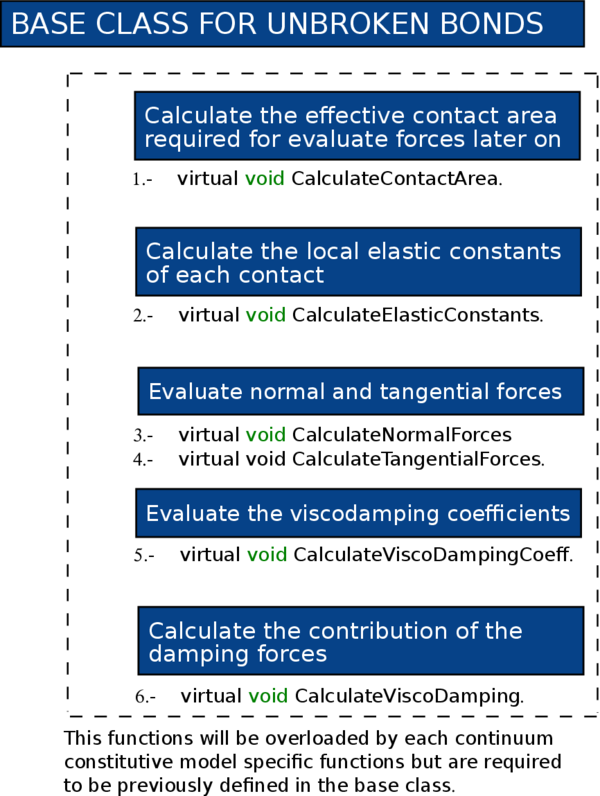
Listing list:law-object defines some of the key functions (area calculation, normal and tangential forces, elastic constants evaluation, etc...) that will be called depending on the created constitutive law object. Notice the functions in the base class are actually empty.
The actual definition of the operations contained in each of those functions may vary greatly when switching to a different constitutive model. Listing list:exponent may look the same as the one already presented in previous Listing list:law-object but the functions in the exponential model class will be containing the required operations for that constitutive law instead of the empty ones.
|
| Figure 14: Pseudo-code for the base class functions shown in Listing list:law-object. |
3.2.3 Migrating model-dependent functions
With the main files ready to be accessed via the library structure, now we are able to create the files which will contain the specific member variables and member functions of each constitutive law.
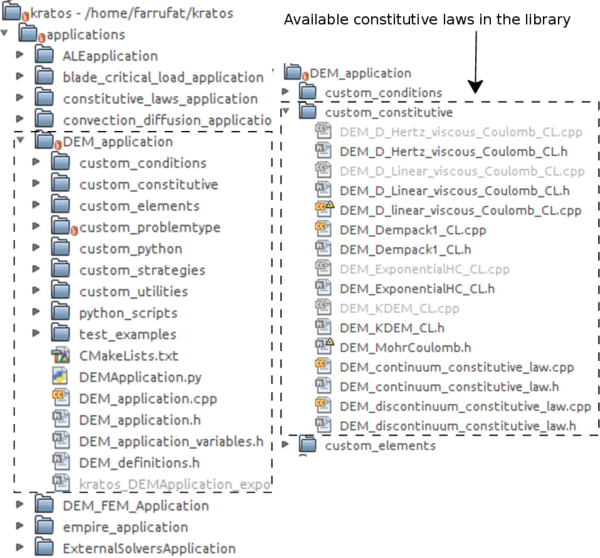
The custom constitutive folder shows the available models for both discontinuum simulations and continuum. The header declares what the class will do and contain the declaration of all the member variables and functions of the constitutive model, while the cpp file defines how it will perform those features.
This reduces dependencies so the code that uses the header doesn't necessarily need to know all the details of the implementation and any other classes/headers needed only for that. This reduce compilation times and also the amount of recompilation needed when something in the implementation changes.
|
| Figure 15: New file structure and introduced constitutive laws library. |
   #include "DEM_continuum_constitutive_law.h"   // the file with base structure must be included
   namespace Kratos{
       class DEM_ExponentialHC : public DEMContinuumConstitutiveLaw{
       public:
           KRATOS_CLASS_POINTER_DEFINITION(DEM_ExponentialHC);

           DEM_ExponentialHC(){}

           double member_variable1;
           double member_variable2;

           void Initialize(const ProcessInfo rCurrentProcessInfo);
           void SetConstitutiveLawInProperties(Properties::Pointer pProp);

           ~DEM_ExponentialHC(){}
           DEMContinuumConstitutiveLaw::Pointer Clone() const;

           void CalculateContactArea(double mRadius, double other_radius, double calculation_area);

           void CalculateElasticConstants(double kn_el, double kt_el, double initial_dist, double equiv_young, double equiv_poisson, double calculation_area);

           void CalculateViscoDampingCoeff(double equiv_visco_damp_coeff_normal,                 double equiv_visco_damp_coeff_tangential, SphericContinuumParticle* element1, SphericContinuumParticle* element2,...);

           void CalculateForces(double LocalElasticContactForce[3], double LocalDeltDisp[3], double failure_criterion_state, double indentation, double calculation_area, double acumulated_damage, SphericContinuumParticle* element1, SphericContinuumParticle* element2, int mNeighbourFailureId_count,...);

   }
In Listing list:exponent all the required functions and member variables in the exponential constitutive model are declared in the corresponding file as class derived from the main ContinuumConstitutiveLaw class.
The operations contained in those functions will vary depending on the selected model.
3.2.4 Updating the function call
Finally, we need to create all the function calls in the main DEM application file and link them with the corresponding function definitions that we already declared in the constitutive model library.
   for (unsigned int i_neighbour_count = 0; i_neighbour_count < mNeighbourElements.size(); i_neighbour_count++){
    SphericContinuumParticle* neighbour_iterator = dynamic_cast<SphericContinuumParticle*>(mNeighbourElements[i_neighbour_count]);
    unsigned int neighbour_iterator_id = neighbour_iterator->Id();
    ...
    if (cohesive = 1){
         mContinuumConstitutiveLawArray[mapping_new_cont]-> Continuum_Function_1(arguments);
         mContinuumConstitutiveLawArray[mapping_new_cont]-> Continuum_Function_2(arguments);
    }else{
         mDiscontinuumConstitutiveLaw -> Discontinuum_Function_1(arguments);
         mDiscontinuumConstitutiveLaw -> Discontinuum_Function_2(arguments);
         ...
   }
Notice the existing difference when calling a continuum function and a discontinuum one. While continuum functions require for each particle to be called using an array containing all the other bonded particles to the current one, this is not necessary when considering a discontinuum function call (see Listing list:function-call ).
3.3 Description of the constitutive models introduced in the library
In the previous section an overview of the library functionality has been shown. In this section we will center our attention on the different constitutive models for both continua and discontinua that have been introduced in the library.
3.3.1 Continuum basics
When trying to reproduce the complex constitutive behavior of materials like concrete with the damage and plasticity induced effects, arising from extensive micro and macro cracking, one can be easily overwhelmed by the difficulties that characterizing this kind of materials in terms of a continuum formulation implies [14].
Discrete-based methods which represent the material as an assemblage of independent elements interacting with one another are wide-spread accepted to provide very accurate results for granular media. The continuum model explicitly reproduces the discrete nature of the discontinuities, which are represented as the boundary of each element. Those models are often applied to investigate the mechanical behavior of frictional cohesive materials, by assuming that they can be approximated as assemblies of discrete elements bonded together by different forms of cohesive forces. The overall mechanical behavior can be evaluated through the collective contributions of these particles under loading or unloading processes exhibiting motion, displacement, sliding and inter-element rotation. Additionally, the creation of cracks are simulated by the de-bonding of the elements [15].
For all this, discrete element models which directly take into consideration the physical mechanisms and the influence of the concrete aggregate structure, offer an interesting alternative tool to model fracture in concrete, since this method will not rely upon any pre-imposed assumption about where and how a crack will occur and propagate as the medium is naturally discontinuous.
When using DEM to represent a real concrete sample, the local constitutive parameters are assigned to each of the interaction forces between the elements, such as the macroscopic behavior of the entire set of particles is representative of the real material at the macro-scale.
Standard constitutive models in DEM can be characterized by the following parameters:
- Normal and shear stiffness and .
- Normal and shear strength and .
- Coulomb static and dynamic friction coefficients and .
- Local (interface level) and global damping coefficients.
Several models are already included in the constitutive library, however in this work only two of them will be deeply exposed.
Used in many real engineering projects and developed by CIMNE, the KDEMPack model is reported in [16] and currently implemented in our application. This model has been validated in its application to the analysis of the behavior in concrete samples and have undergone a series of tests including uniaxial compressive strength, triaxial and brazilian tensile strength. The results obtained are quite remarkable and compare well with both the experimental data provided by the Technical University of Catalonia and Weatherford Ltd.
Following a similar methodology, another model developed by Donze [17] has also been implemented in the library with satisfactory results even under high pressure conditions.
3.3.2 The KDEMpack model for continuum mechanics
Let us begin by introducing the concept of a particle connected to the neighboring particles by pre-defined contact level relationships between them. Those relationships may define a perfectly established bond or a sliding effect at the interface.
3.3.2.1 Local definition of DEM elastic constitutive parameters
The normal force at the contact interface between particles and is obtained as
|
|
(24) |
where is the normal stress at the contact interface and is the effective area at the interface given as
|
|
(25) |
being the radius of the smaller of the two particles interacting at the interface (Figure 4).
We know the packing of particles generated with current meshing procedures is not optimal and usually produces higher porosity values than required. In Eq.(25) a new parameter is introduced to take this effect into account. is a local parameter that depends on the interface, however, in this thesis we have only considered the case of spherical particles and used a global definition of as
|
|
(26) |
where and are presented as the average number of contacts per sphere and the average porosity for the whole particle assembly. For quasi-optimal packaging distributions would be close to .
The normal stress is related to the normal strain between the interacting spheres, , by a visco-elastic law,
|
|
(27) |
where is the Young modulus of the solid material.
We assume the Young modulus to be an intrinsic property of the material. As such, it is typically characterized from axial tests on cylindrical samples done in laboratories. From this experimental axial stress-strain relationship we obtain the Young modulus and then it is used to define the local normal stress-strain relationship at a macroscopic level (Eq. 27) at the contact interfaces. In the same way we can follow a similar procedure to the evaluation of the Poisson's ratio of the material that will be used to define the local shear constitutive relationship.
We can define the normal strain and the normal strain rate as
|
|
(28) |
where is given by Eq.(2).
Using equation 28 into 27 gives
|
|
(29) |
In Eq.(29), is a local damping coefficient per unit length and and are the normal (relative) displacement and the normal (relative) velocity at the contact point defined as
|
|
(30) |
where and are the position vectors of the centroids of particles and , so then and will express the relative (incremental) motion between the centroids of the interacting particles.
The damping coefficient is considered to be a fraction of the critical damping per unit length for a system of two rigid spherical bodies with masses and connected by a spring of stiffness [10]
|
|
(31) |
with and is the reduced mass of the contact,
|
|
(32) |
From the previous equations (24) and (29) the relationship between the normal force and normal relative motion at the interface between particles and can be given as
|
|
(33) |
Working with equations 25 and 33 it is posible to write an expression of the normal stiffness and normal viscous (for the damping) coefficients at the contact interface as
|
We can follow a similar approach when obtaining the relationship between shear forces and relative tangential displacements for each contact. The shear forces in the and directions (Figure 6) are given by
|
|
(36) |
with and being the shear stresses at the interface. These stresses are linearly related to the shear strains and at the interface as
|
|
(37) |
where is the shear modulus.
The shear strains can be defined as
|
|
(38) |
where and are the components in the and directions of the relative tangential displacement vector at the particle contact (Figure 6) given by
|
|
(39) |
with
|
|
(40) |
where and are the displacement increments of the centroids of particles and , respectively (Eq.(13)) and and are the vectors connecting the particle centers with the contact point.
Substituting Eqs.(37) and (38) into (36) we obtain
|
|
(41) |
with
|
|
(42) |
with the Poisson ratio .
From 41 a relationship between the shear force and the shear displacement vector can be given as
|
|
(43) |
with
|
|
(44) |
The sign of in 41 depends on the the velocity component , while in 43 only the modulus of vectors and are involved.
3.3.2.2 Elasto-damage model for tensile and shear stress
There are a quite large amount of published models for continuum and each one of them has its own way to evaluate failure of the material. In the KDEMPack model, cohesive bonds at a contact interface are considered to initiate failure when its interface strength is exceeded by the tensile contact force or by the shear force. We write the uncoupled failure (decohesion) criterion for the normal and tangential directions at the contact interface between particles and as
|
|
(45) |
where and are the interface strengths for tension and shear-compression conditions, respectively, is the normal tensile force and is the modulus of the shear force vector defined in equation 44.
Our interface strengths are defined as
|
|
(46) |
with and being the tensile and shear failure stresses, respectively, is the compressive normal force at the contact interface and is a static friction coefficient, where is the internal friction angle of the material. These values are determined experimentally as properties of the material.
If those values were not available from experimental data the tensile strength can also be estimated from the maximum compressive stress, , in a uniaxial compressive strength (UCS) test. A typical relationship for concrete is
|
|
(47) |
After a tensile failure of the material, the behavior in the shear direction is governed by the standard Coulomb law
|
|
(48) |
where is a dynamic Coulomb friction coefficient and is the post-failure internal friction angle. Both and are also determined from experimental tests.
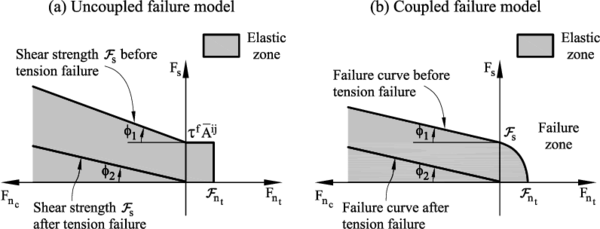
The graphical representation of the failure criterium described by equations (45, 46 and 48) can be seen in figure 16. This criterium assumes that the tension and shear forces contribute to the failure of the contact interface in a decoupled form. On the other hand, shear failure under normal compressive forces is a function of the shear failure stress, the compression force and the internal friction angle.
|
| Figure 16: Failure line in terms of normal and shear forces. (a) uncoupled failure model. (b) Coupled failure model |
A coupled failure model in the tension-shear zone could also be used, as shown in Figure 16b but for the numerical results presented in later chapters (see 4) the uncoupled model has been used.
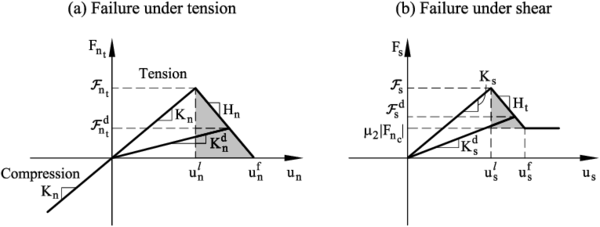
Figure 17 shows the evolution of the tensile force and shear force at the contact until failure. The effect of damage in the two constitutive laws is also shown in the same figure.
|
| Figure 17: Undamaged and damaged elastic moduli under tension (a) and shear (b) forces |
We can include the effect of elastic damage under tensile and shear conditions by assuming a linear softening behaviour (defined by the softening moduli and ) introduced into the force-displacement relationships in the normal and shear directions, respectively (Figure 17).
The constitutive equations for the elasto-damage model are written as
|
|
(49) |
where and are scalar damage parameters in the normal (tensile) and shear directions at the contact interface and and are the damaged elastic stiffness values. We use the damage parameters and as a measure of the loss of mechanical strength at each contact. For an undamaged state and , while for a damaged state and .
Damage effects will start when the strength failure conditions (45) are met. The evolution of the damage parameters from the value zero to one can be defined in a number of ways using fracture mechanics arguments. A key issue to consider is the area under the line defining the force (relative) displacement relationship in the damaged region (shadowed area in Figure 17) should be equal to the fracture energy of the material [18].
We define the following damage parameters
|
|
(50) |
where and are values of the interface displacement increments in the normal and shear directions at failure computed as
|
|
(51) |
where and are respectively the failure normal strain and the failure shear strain.
For the KDEMPack model we define and using a simple linear strain softening law as
|
|
(52) |
|
|
(53) |
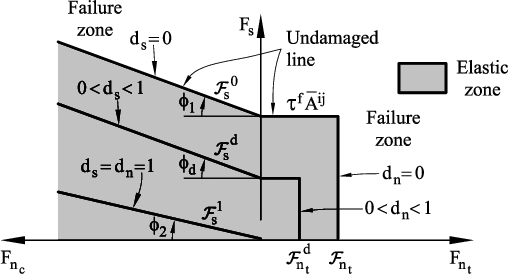
The failure conditions evolve due to damage as
|
|
(54) |
with
|
|
(55) |
where ) and are the undamaged and damage interface strengths for pure tension and pure shear conditions, respectively.
Figure 18 shows the evolution of the failure lines from the undamaged to the fully damaged state for the uncoupled model of Figure 16a.
|
| Figure 18: Evolution of the failure lines due to damage for uncoupled normal and shear failure |
3.3.2.3 Elasto-plastic model for compression stress
When modelling the compressive stress-strain behavior at the contact for frictional cohesive materials it is usual to find it governed by an initial elastic law followed by a non-linear constitutive equation that varies for each material (rock, concrete,...).
The compressive normal stress will keep increasing under linear elastic conditions until it reaches the compressive limit . At this point the experimental strain-stress curve will start to deviate from the linear elastic behaviour and the material will be considered to begin deforming under elastic-plastic conditions.
The elasto-plastic relationships in the normal compressive direction are defined as
Loading path
|
|
(56) |
Unloading path
|
|
(57) |
In equation 3.3.2.3 and are the increment of the normal compressive force and the normal (relative) displacement, is the initial (elastic) compressive stiffness for a value of (Figure 19), and is the tangent compressive stiffness given by
|
|
(58) |
where is the slope of the normal stress-strain curve in the elastoplastic branch (i.e. , , in Figure 19).
Figure 19 shows the diagram relating the compressive axial stress and the compressive axial strain used for modelling the elasto-plastic constitutive behaviour at the contact interfaces.
Using the diagram in Figure 19 we obtained some results for cement and concrete material that will be shown later in this work.

|
| Figure 19: Compressive axial stress-compressive axial strain diagram for elastoplastic material in KDEMPack model. |
3.3.3 Exponential model for continuum mechanics
Similar to the KDEMPack model, in the this exponential model developed by Donze [17], the initial elastic interaction force, which represents the action of an element a on element b, does not only involve elements in contact, but elements which are also separated by a distance smaller than an interaction radius controlled by a ratio defined by,
|
|
(59) |
where is the distance between the centroids of elements a and b and . This is and important difference from the classical DEM where only contact interactions are considered ( ). By setting a ratio, the macroscopic Young's modulus which depends on the local stiffness, is more easily controlled.
In this model we will also define to types of interactions. The first ones are the initial interactions which are bounding interactions. The second ones are purely repulsive and are created when a new contact occurs during the simulation.

|
| Figure 20: Tensile interaction law |
The normal interaction force can be calculated through the local constitutive law shown in figure 20, and can be split in two parts, the compressive and the tensile components. In the compressive part, the concrete's response is linear and the normal interaction force is given by:
|
|
(60) |
where is the normal interaction force, adn are the initial adn current distances between two particles respectively. This normal force can also be computed with the same equation 60 when considering tensile stress. Although, the stiffness may be slightly modified by a softening factor while this softening behavior occurs after the normal force has achieved its maximum value.
3.3.3.1 Complete local constitutive law
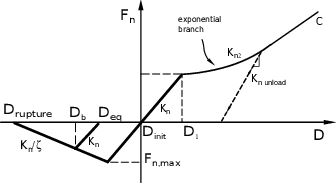
If we aim to consider the effects of the compaction process which happens at a lower scale than the discretization size, a more complete formulation must be proposed. In this formulation, the material response under compression is initially linear (figure 21) and the normal interaction force is given by equation 60.
|
| Figure 21: Complete exponential constitutive law. |
When the deformation achieves an elastic deformation limit related to the interaction distance (), a damaged response is considered. At this point, the normal interaction force is characterized by a nonlinear stiffness , which follows an exponential function of deformation and is controlled by three parameters , and . The stiffness can be expressed as,
|
|
(61) |
with maximum elastic deformation defined as,
|
|
(62) |
So the complete normal interaction force is expressed as,
|
|
(63) |
The nonlinear part of the stiffness is added in agreement to the experimental results obtained by triaxial tests under high confinement [19]. In this formulation, the parameter controls the slope of the beginning part of the nonlinear behavior, whereas the sum controls the shape of the slope of the last nonlinear part. Parameter controls the compaction's curve curvature.
|
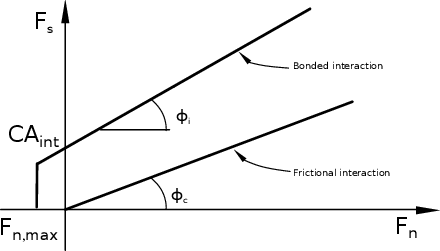
| Figure 22: Modified Mohr-Coulomb criterion. |
In the tangential direction, a modified Mohr-Coulomb model has been used (figure 22). For a given interaction, the maximum normal force is defined as a function of tensile strength . The maximum shear force is characterized by the normal force , the cohesion , the contact friction angle and the internal friction angle . The maximum normal force can be then defined as,
|
|
(64) |
where is defined as the interacting surface. The maximum shear force in a bonded contact is given by,
|
|
(65) |
and if new contacts appear during the simulation, the maximum shear force will be purely frictional,
|
|
(66) |
3.4 DEM user interface and wizard
A major initial motivation for developing a library structure for the DEM application is allowing the developers to implement their own material constitutive equations and add them to the main DEM program without the need of modifying or duplicating existing lines of code. Separating the different constitutive models as independent objects has demonstrated to be a far better strategy than the previous existing one.
However, while encapsulating the models into separate files and link them with a class derived structure is far more efficient cost-wise with a clear impact on the required calculation times, making this improvements accessible to the users is as important as creating the code itself.
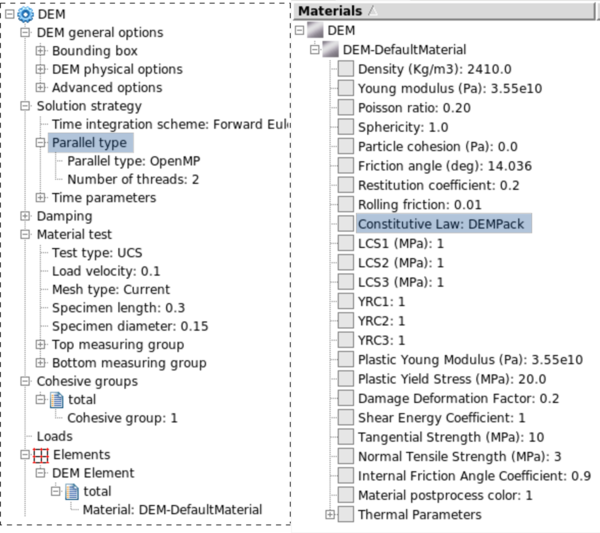
|
| Figure 23: DEM problemtype user interface and constitutive model selection. |
The importance of having a well designed interface is critical if we want our program to be used for as much people as possible. So, further to the development of this interface (see Fig. 23), a wizard for easily designing basic DEM problems is also created.
Although this wizard is focused on one specific constitutive model, it can be easily modified and used as input for other constitutive models as well. With the step-by-step wizard, a user is able to create and execute the following problems:
- Uniaxial compressive strength tests (UCS).
- Triaxial tests.
- Brazilian tensile strength tests (BTS).
- Hydrostatic tests.
- Uniaxial strain compaction tests (USC).
The wizard itself is divided in eight steps (see Appendix 6). Initially the user will be asked to choose the template of the experiment he wants to run which would be either a material test or cutting test. While the material test is already fully functional, the cutting test wizard also shown in 6 is currently in development stage.
In the next step, one of the several predefined standard tests (i.e. UCS, BTS, triaxial, ...) is selected. There are six different meshes predefined to run the tests and two different geometries plus and additional geometry and mesh for BTS testing. Once the experiment type and mesh have been selected, the user needs to enter the values for all the parameters of the constitutive model, although a material library with some predefined materials is available to automatically fill the required fields.
Now we only need to set the calculation time and time step, define the output variables and choose the parallelization options for the problem.
Finally, the all the problem data will be loaded into the into GiD and the calculation will begin, plotting the strain-stress graph in a real-time embedded window.
4 Examples and Results
4.1 Introduction
At this point, the main concepts on the different constitutive laws have been already presented, as well as the most relevant aspects concerning the implementation of C++ library that will give us as developers an improved structure to access each of those models within the Kratos framework.
This chapter will focus on testing and validating the implemented code, by performing some classical examples in the material testing field: the uniaxial compressive strength test, brazilian tensile strength test and specimen testing under confined conditions.
First we will analyze the results obtained with the KDEMPack model on two different materials and the confinement effects on the specimen behavior during the simulation. The objective of these experiments is to compare the numerical results with the provided experimental data, pointing out the strengths and limitations of the code and analyze the pattern of the fracture when the specimen reaches failure state.
After that, we will run a similar set of geometries applying the exponential model, for both confined and unconfined conditions, and discuss whether the outputs obtained are acceptable or not. As we have already commented, this constitutive law is still under development and has not been as largely tested as the previous one, but the examples performed will help us to improve future simulations with this model.
4.2 Numerical experiments with KDEMPack model
4.2.1 Analysis of laboratory tests on cement samples
4.2.1.1 UCS and triaxial
All the experimental data for the cement tests were provided by the oil-drilling company Weatherford Ltd. in the context of a project to develop an suitable application for simulating the behavior of a drill-bit.
The experimental procedure for the triaxial tests on cement samples performed in the laboratory is as follows:
- A cylindrical plug of 1 inch diameter and 2 inches height is cut from the sample core and its ends ground parallel each other. The specimen is tested under saturated condition with water.
- The specimen is then placed between two endcaps and a heat-shrink jacket is placed over the specimen.
- Axial strain and radial strain devices are mounted in the endcaps and on the lateral surface of the specimen, respectively.
- The specimen assembly is placed into the pressure vessel and the vessel is filled with hydraulic oil.
- Confining pressure is increased to the desired hydrostatic pressure.
- Specimen assembly is brought into contact with a loading piston.
- Increase axial load at a constant rate until the specimen fails or axial strain reaches the desired strain while confining pressure is held constant.
- Reduce axial load to the initial hydrostatic condition.
- Reduce confining pressure to zero and disassemble sample.
When simulating the triaxial testing with DEM, the confining pressure is directly applied on each sphere located on the surface of the specimen. A normal force is applied to each surface particle in the radial direction towards the center of the specimen. The value of that force is calculated as with being the particle radius and the confining pressure.
The numerical procedure is as follows,
- The confining pressure is applied up to the desired hydrostatic testing pressure.
- A prescribed axial motion is applied at the top of the specimen while confining pressure is held constant.
For the UCS test the process is similar to the above described but with zero confinement pressure.
Initially, our objective is to reproduce the structural behavior of the specimen during the axial compression stage. For this, an average Young modulus has been chosen for modelling the the hydrostatic compaction of the sample during the application of the confining pressure.
The normal stress-strain relationship for a cement material is shown in Appendix 7 - Figure 45 as appears in the USC test presented in [20]. We can observe both the initial elastic branch and a (elasto-plastic) hardening branch.
The differential stress during the USC is computed as the difference between the applied axial stress and the confinement pressure (see Appendix 7 - Figure 46). We can observe the initial linear elastic part and the subsequent non linear branch. The non linear region has a flat zone caused by the compaction of the cement material at that stress level. This is then followed by a hardening branch with a partial recovery of the material stiffness for high compaction values.
With the difference of both curves we can obtain the evolution of confinement pressure during the USC test as shown in Appendix 7 - Figure 47.
Tables 1–3 show the material properties and the KDEMPack model parameters for the cement material. While table 1 shows the basic material parameters reported in [20], the tensile strength has been deduced from the BTS test value of MPa [20] using the relationship MPa and has been taken as MPa, where is the maximum compressive stress obtained in the experimental UCS test.
| (g/cc) | (GPa) | (MPa) | (MPa) | |||
| 1.70 | 0.30 | 0.40 | 3.80 | 0.20 | 4.80 | 8.50 |
| LCS1 | LCS2 | LCS3 | YRC1 | YRC2 | YRC3 | |||
| (MPa) | (MPa) | (MPa) | ||||||
| 8.5 | 9.0 | 11 | 3 | 9 | 24 | 0.20 | 0.2 | 1.0 |
| Confining | LCS1 | LCS2 | LCS3 | YRC1 | YRC2 | YRC3 | ||
| pressure (Psi) | (MPa) | (MPa) | (MPa) | |||||
| 500 | 9.5 | 11 | 13 | 3 | 9 | 24 | 0.20 | 0.2 |
| 1000 | 10 | 11 | 14 | 3 | 9 | 24 | 0.20 | 0.2 |
| 2000 | 13 | 14 | 15 | 3 | 9 | 24 | 0.20 | 0.2 |
| 4000 | 21 | 23 | 26 | 3 | 9 | 24 | 0.20 | 0.2 |
Table 2 shows the DEM constitutive parameters for the UCS, USC and BTS tests corresponding to the values defined in Figure 19 from the previous chapter. Table 3 lists the DEM constitutive parameters for triaxial tests.
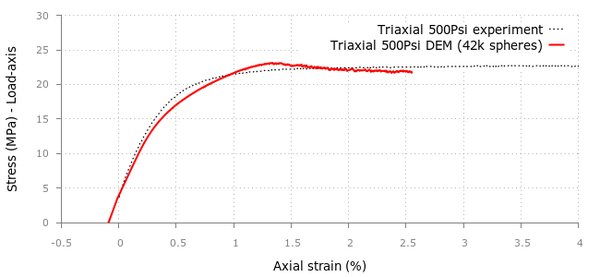
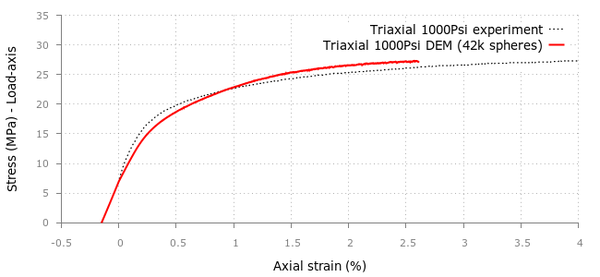
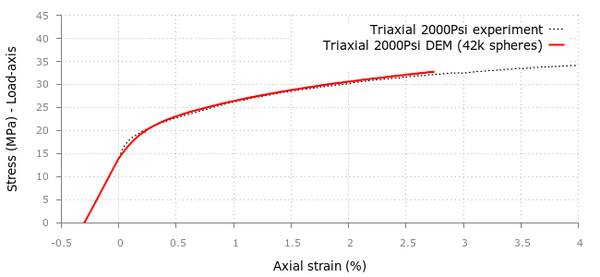
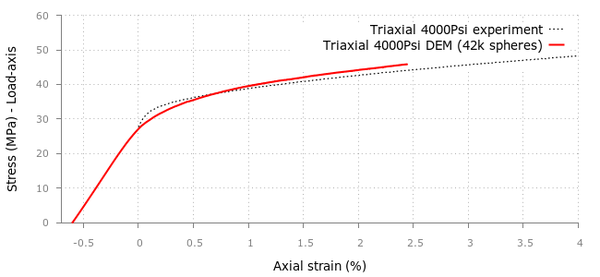
For the UCS and triaxial tests, a discretization of 42000 particles was generated and the strain-stress results for both simulations can be seen in Figures 24 and 25.
For the triaxial tests in the cement samples we applied confining pressures of 500, 1000, 2000 and 4000 psi obtaining good correlation with the experimental values provided in [20] although the curvature in the initial stage tends to differ as we increase the confinement.
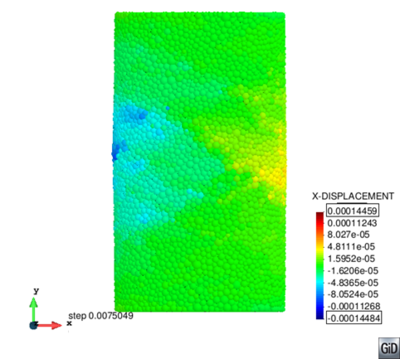
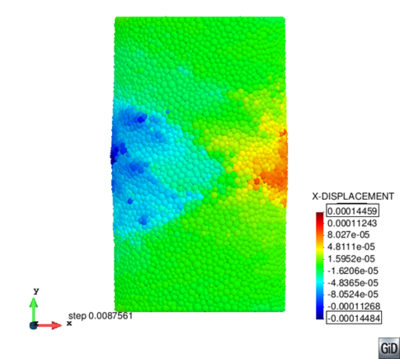
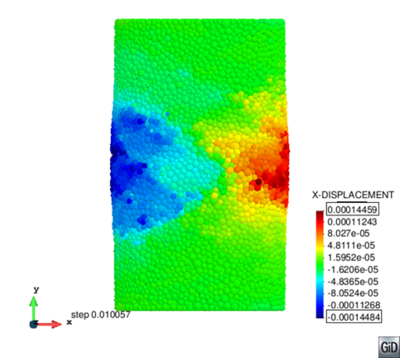
Figure 26 shows the deformation of the sample at the failure point for the UCS test where the typical cracking pattern can be seen. A similar set of results is shown in Figure 27 for the triaxial test under a confining pressure of 500 psi and different deformation levels.
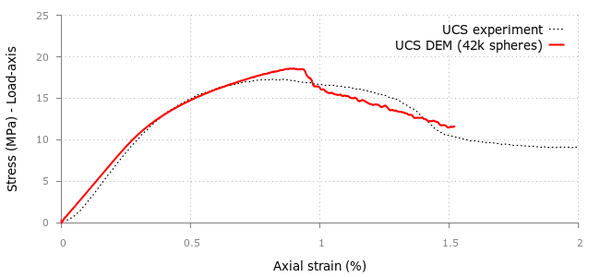
|
| Figure 24: DEM and experimental results for Uniaxial Compressive Strength (UCS) test in a cement sample. Mesh of 42000 particles. |
4.2.1.2 Uniaxial strain compaction (USC) test on cement sample
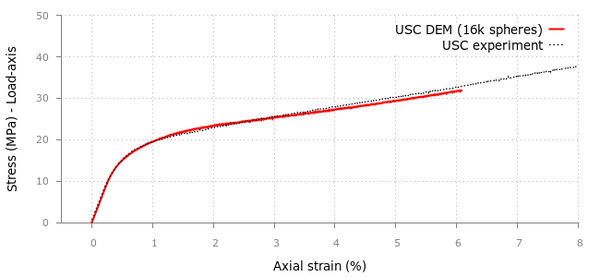
For the USC test the radial strain is constrained in the sample while the axial load is applied with a piston pressing the sample from the top. The DEM parameters are given in Tables 1 and 2.
Quite good agreement between KDEMPack and experimental results is obtained using a mesh of 16000 particles (Figure 28).
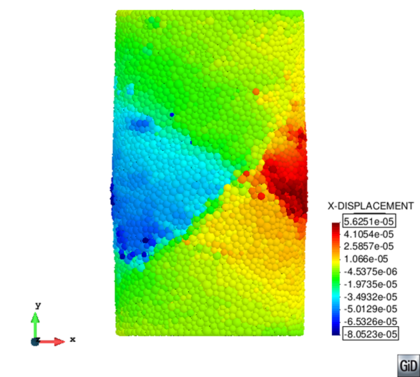
|
| Figure 26: UCS fracturing in cylindrical cement sample. |
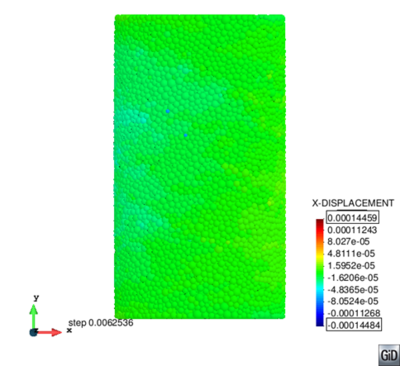
|
|
|
|
| Figure 27: Triaxial test under 500 psi confinement in cement sample at 1.28%, 1.55%, 1.80%, and 2.0% axial strain. | |
|
| Figure 28: KDEMPack results for Uniaxial Strain Compaction (USC) test on cement sample using 16000 spheres |
4.2.1.3 Brazilian tensile strength (BTS) test on cement sample
The BTS test was carried out for a sample of 1.487in diameter and 0.863in thickness. The density of the material was 1.70g/cm3 and the experimental value of the maximum load in the experimental BTS test was 847 lb which corresponds to a value of psi 2.9 MPa. Hence, Mpa (see Tables 1 and 2).
For this simulation we used a discrete mesh of 16000 spheres. The stress-displacement curve obtained with KDEMPack is displayed in Figure 29. The maximum tensile strength obtained with the simulation is 3.0 MPa so comparing it with the laboratory experimental value of 2.9MPa gives us a 3.5% relative error.
Figure 30 shows the -displacement field on the sample at failure state.
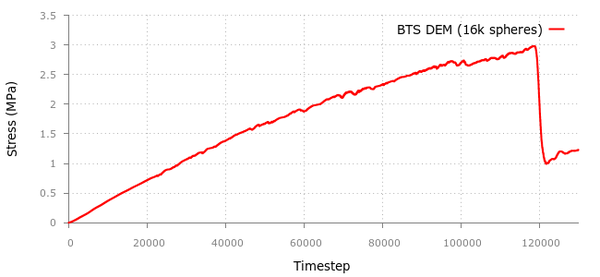
|
| Figure 29: KDEMPack results for Brazilian Strength (BTS) test in the cement sample. |
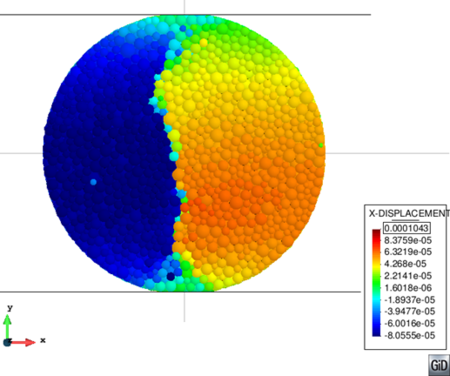
|
| Figure 30: X-displacement results for the BTS test in cement sample. |
4.2.2 Analysis of laboratory tests on concrete samples
The experimental tests were carried out at the laboratories of the Technical University of Catalonia (UPC) in Barcelona. The experimental testing procedure is similar to the one previously defined in section 4.2.1.1. The concrete used in the experimental study was designed to have a characteristic compressive strength of 32.8 at 28 days. Standard cylindrical specimens (of 150 mm diameter and 300 mm height) were cast in metal molds and demolded after 24 hours for storage in a fog room.
The triaxial tests were prepared as shown in Figure 34 with a 3-mm-thick butyl sleeve placed around the cylinder and an impermeable neoprene sleeve fitted over it. Before placing the sleeves, two pairs of strain gages were glued on the surface of the specimen at mid-height.
Steel loading platens were placed at the flat ends of the specimen and the sleeves were tightened over them with metal scraps to avoid the ingress of oil.
The tests were performed using a servo-hydraulic testing machine with a compressive load capacity of 4.5 MN and a pressure capacity of 140 MPa. The axial load from the testing machine is transmitted to the specimen by a piston that passes through the top of the cell. Further details of the test are given in [21].
Several levels of confining pressure ranging from 1.5 MPa to 60 MPa were used in order to study the brittle-ductile transition of the response. First the prescribed hydrostatic pressure was applied in the cell, and then the axial compressive load was increased at a constant displacement rate of 0.0006 mm/s.
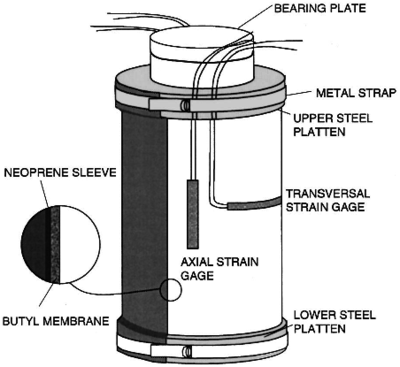
|
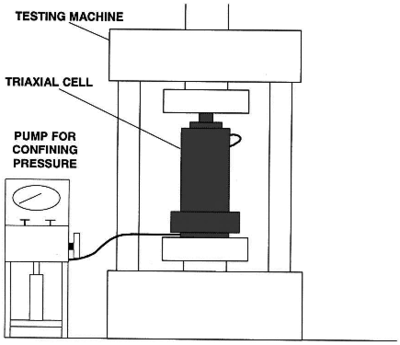
|
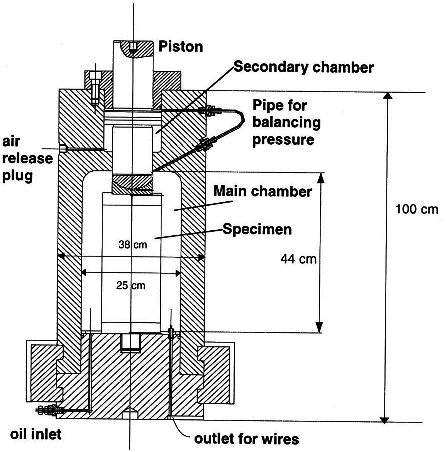
| |
| Figure 31: Sample prepared for triaxial testing of concrete | |
Two specimens were tested at each confining pressure, and all tests were performed at ages of more than 50 days to minimize the effect of aging response. In addition to the triaxial tests, uniaxial compression tests were also performed.
In this example we consider the elasto-plastic behavior to initiate at Mpa. As explained in 3.3.2.3, we estimate the shear stress as MPa. Additional damping parameters have to be included to achieve a quasi-static simulation, a global damping with a effect over the global forces and a local contact damping in the interface.
| (g/cc) | (GPa) | (MPa) | (MPa) | |||||
| 2.5 | 0.90 | 0.25 | 28 | 0.2 | 5.0 | 16 | ||
| LCS1 | LCS2 | LCS3 | YRC1 | YRC2 | YRC3 | |||
| (MPa) | (MPa) | (MPa) | ||||||
| 20 | 45 | 70 | 3 | 12 | 22 | 0.2 | 0.2 | 1.0 |
All the KDEMPack constitutive parameters required for the analysis of the concrete samples are shown in Table 4. Figures 32 and 33 show the results for the UCS and triaxial tests for confining pressures of 4.5, 9.0 and 60 MPa using a discretization of 13000 spheres. For the BTS test, the obtained results can be seen in Figure 34. Comparing with the experimental results we can conclude the obtained results are quite reasonable in most of the studied cases.
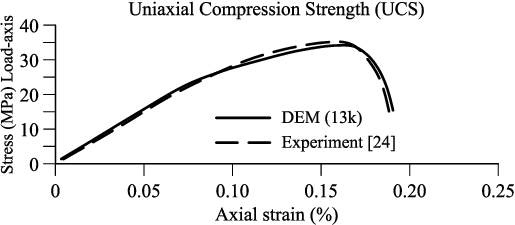
|
| Figure 32: Uniaxial compression strength (UCS) test in concrete sample. |
As a complementary test, in Figure 35 we show the effect of plasticity for different unloading-reloading paths in a triaxial test for the same concrete material and a confining pressure of 40MPa.
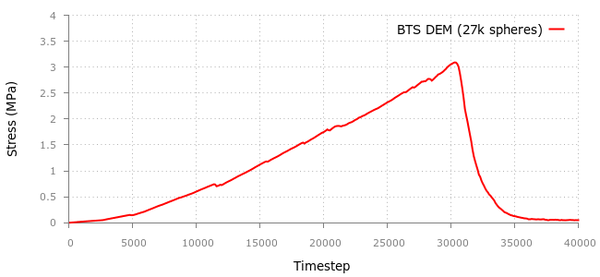
|
| Figure 34: BTS test in concrete sample. KDEMPack results for 27000 spheres. The experimental limit tensile stress is 3Mpa. |
![Triaxial test in concrete sample. KDEMPack results and experimental values [21] for a confinement pressure of 40MPa. Results show the effect of plasticity for different unloading-reloading paths.](/wd/images/thumb/3/32/Draft_Aparicio_Nogu%C3%A9_450013832-DEM-4000-spheres-40.png/600px-Draft_Aparicio_Nogu%C3%A9_450013832-DEM-4000-spheres-40.png)
|
| Figure 35: Triaxial test in concrete sample. KDEMPack results and experimental values [21] for a confinement pressure of 40MPa. Results show the effect of plasticity for different unloading-reloading paths. |
4.3 Numerical experiments with the Exponential model
We are already familiar with the difficulties of reproducing the intrinsic complexity of concrete behavior even at low confinement pressure. With the model presented in this section we will focus on the concrete behavior when submitted to extreme loading and high confinement levels.
With the exponential model defined by Donze [17] and currently being under development to be implemented within Kratos as explained in Section 3.3.3, we decided to try and reproduce the published results for high-confining pressure triaxial compressive tests on concrete specimens carried out by Gabet et al. [19]. The results of these laboratory experiments are used as reference cases to validate the model.
4.3.1 Calibration
The calibration of the model parameters is necessary prior to simulate the high-confining triaxial tests and it is conveniently done by comparing real and simulated reference tests which include, uniaxial compression-traction, a 650MPa hydrostatic test and a 50MPa triaxial test.
The uniaxial compression test is not sufficient to calibrate the full irreversible response of the model, which is also characterized by the three hardening stiffness ratios and the maximum elastic deformation (see equation 61). For this reason, the results of an experimental hydrostatic test performed at a confining pressure reaching 650MPa were used to obtain information on the compaction process of the concrete material as well as to evaluate its quantitative contribution.
The use of a pure linear elastic law (see Figure 37) would show an unrealistic linear increase of the axial stress versus the axial strain. With the local elastic-hardening constitutive law, the results of the model are closer to the experimental ones.
With the local parameters of the model calibrated we can now proceed with the rest of the triaxial tests (Table 5).
| Parameters | Values |
| 0.2 | |
| Tensile limit (MPa) | 10 |
| Cohesion C (MPa) | 13 |
| Friction angles and | 30 |
| Coefficient | 0.2 |
| Coefficient | 16 |
| Coefficient | 0.275 |
4.3.2 Strain-stress response of triaxial tests
Without changing the values of these parameters, the numerical model is now used to simulate the triaxial tests at other confining pressures. Three additional triaxial tests have been run for the following confining pressures: 100 MPa, 200 MPa, 500 MPa. We compare the results of our simulations with the data also available in the experimental tests (see Figure 38).
We can observe that in the hydrostatic stage the numerical results are quite similar to the experimental measurements. In the differential-stress phase, the simulated results are overall comparable with the experimental ones. In the experiment, for a 100 MPa test, a stagnation of the axial pressure can be observed without reaching a peak as in the 50 MPa test. Still, in the experiments, for the 200 MPa test, there is a decrease of the stiffness but without reaching a plateau as in the 100 MPa test. Then for the 500 Mpa test, the stiffness curves gradually decrease without changing slope.
The numerical curves for 50 and 100 MPa show a stress peak and just before it, a decrease of the stiffness is observed in both the model and the experimental data. The numerical and experimental results differ more in the axial stress peaks as we keep increasing the pressure.
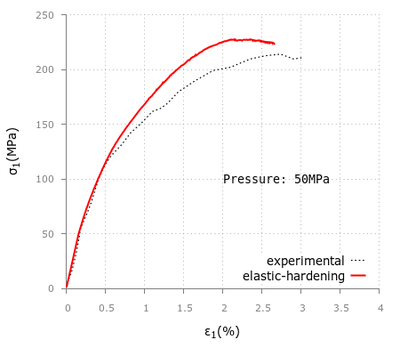
|
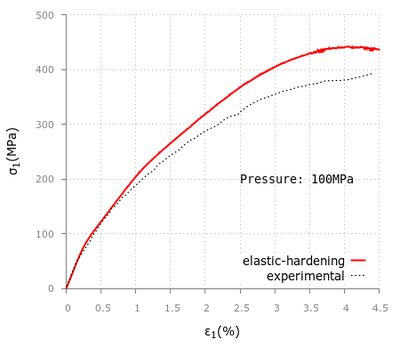
|
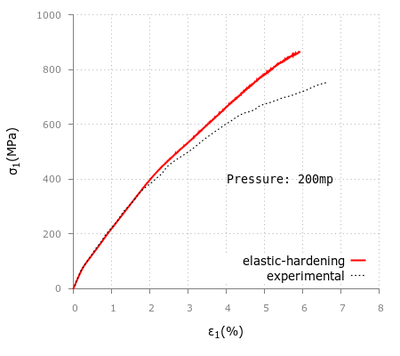
|
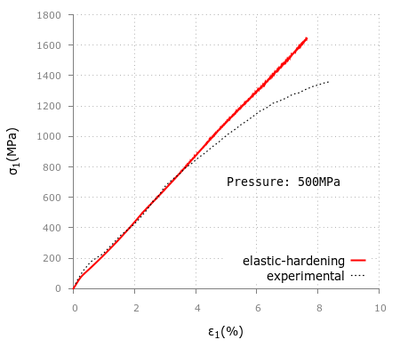
|
| Figure 38: Triaxial test numerical and experimental results at 50, 100, 200 and 500MPa. The solid line represents the numerical results and the single-dotted line represents the experimental data. | |
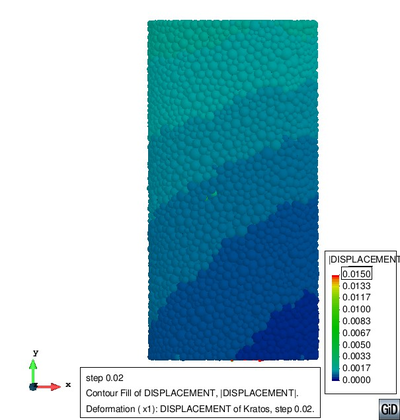
|
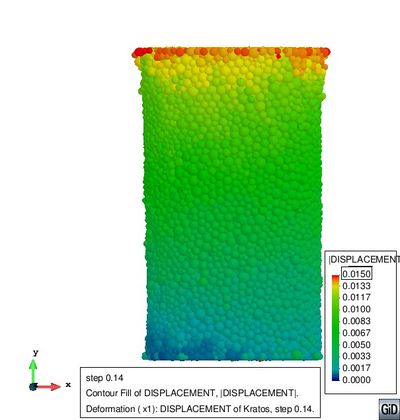
|
| Figure 39: Displacement field at and for the 100 MPa confinement triaxial test. | |
5 Conclusions and Future Research Lines
We have been working on improving our current DEM application for almost half a year with the objective of remodeling it into a more developer and user-friendly structure and now we can point out the following conclusions.
First, we have seen that the implementation of the library itself is, even in its current beta stage, a logic step into our scheme to regularize current and future constitutive model developments in independent modules. It requires to put an important amount of time and resources to fit the previous code into the new system. However, a library is the best approach to achieve an efficient and robust program to simulate different material behaviors with discrete elements without modifying the main structure of the DEM code.
With this modular approach, we also reduced the size original main function which was close to 1400 lines of code (and included all the required sub-functions for each constitutive model) to barely 300 lines with the externally located constitutive equations organized in modules. So, from now on, it will be also easier for the developer to track and fix implementation errors in his code without having a detrimental effect on the rest of the team.
On the other hand, this encapsulated object approach has also forced us to update the graphical interface of the current DEM problem-type in order to take advantage of the newly implemented constitutive model library. The advantages of this update will be specially useful for the DEM application users.
Concerning the current available models inside the library, it must be stated that the implementation of both the KDEMPack and the exponential model has shown a partial success when reproducing cement and concrete behavior. We have described the assumptions made for modelling cohesive materials with DEM using a local constitutive model and presented examples of the acceptable behavior for both models in the analysis of cement (only with KDEMPack) and concrete under a uniaxial compressive strength test, different triaxial compressive strength tests and a brazilian tensile test.
While it can be stated that the KDEMPack model works better in both cement and concrete materials as the confinement level increase, when we switch to the exponential model and increase the confining pressure even further, the results tend to differ from the experimentally obtained data. So, for this model, even if the results obtained from the 650MPa hydrostatic test can be considered pretty good, it would be necessary to run additional calibration tests in order to get more accurate results at 100, 200 and 500 MPa triaxial experiments. Furthermore, unlike the KDEMPack model, the exponential one is still under development and has not been as extensively tested as the previous one, and thus it will still take some time before considering it a reliable model.
The implemented library of constitutive models will allow a better understanding of the code for new developers but there is still work to do.
Thereby, in the near future there are various aspects on the current code that should be enhanced. First, regarding the current code calculation speed, there are several ways to further optimize the available computation resources with some modifications in the parallelized functions.
We could introduce an application benchmarking system to verify everything is working as expected on a daily basis. This measure would be also highly recommended if we plan to implement additional models and validation tests in the near future, for example the Drucker-Prager plasticity model. The benchmarking would consist in several simple problems focused on verifying the most basic functions of the application and, if possible, it would be wise to separate the main DEM application benchmarks from other library specific constitutive model benchmarking tests.
One additional feature that should be implemented would be the capability to automatically modify the wizard user interface depending on the selected constitutive model and adding new types of pre-generated tests specific for each model. Furthermore, additional post-process results may be required for specific constitutive models so the output scripting should be modified accordingly.
Finally, as other research lines of interest, we should mention the extension of the implemented library structure to include coupling problems; adding fluid to high-confinement experiments or simulating particle-fluid interaction by selecting the DEM and fluid models directly through each application library.
6 DEM wizard description
Step-by-step guide on how to use the implemented problem-type wizard for the KDEMPack model application.
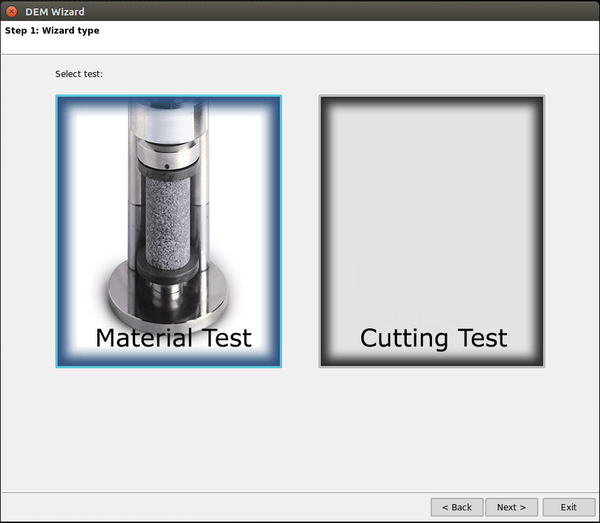
|
| Figure 40: Customized DEM wizard. Step-by-step guide. |
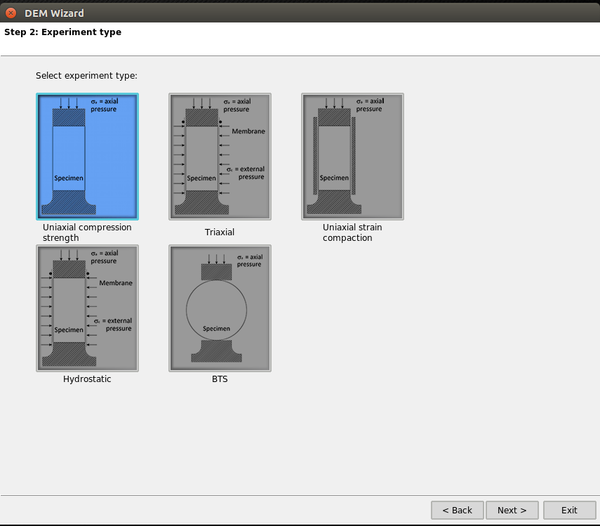
|
| Available experiment types. |
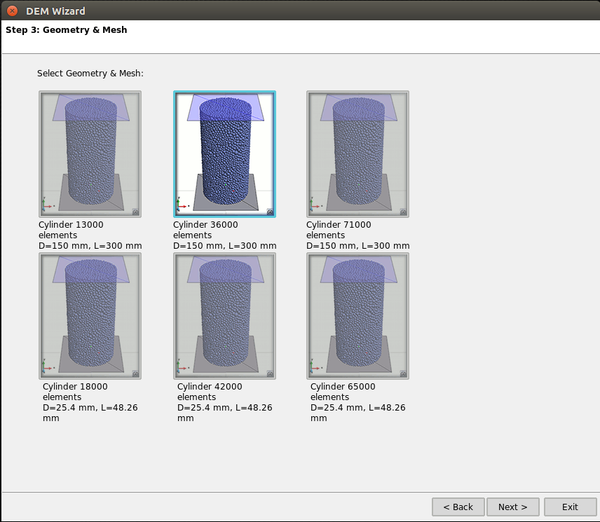
|
| Figure 41: Customized DEM wizard. Step-by-step guide. |
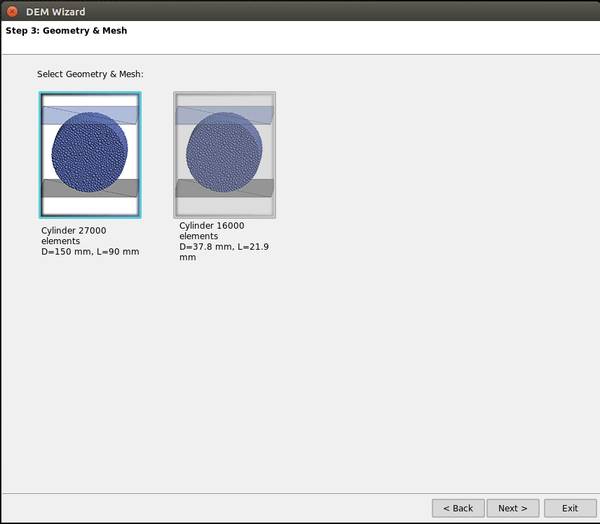
|
| Geometry and mesh selection. |
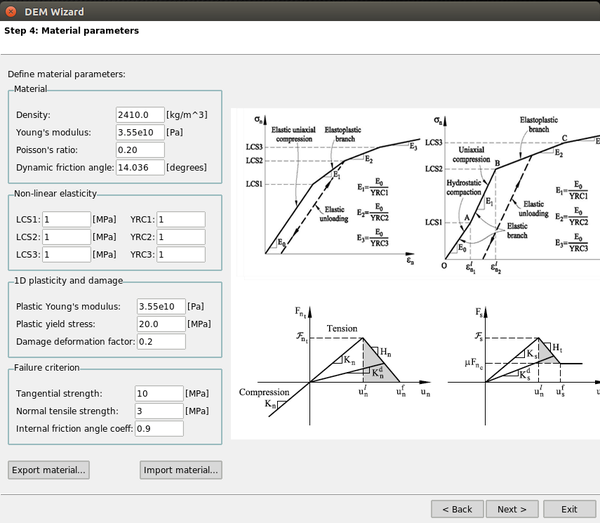
|
| Figure 42: Customized DEM wizard. Step-by-step guide. |
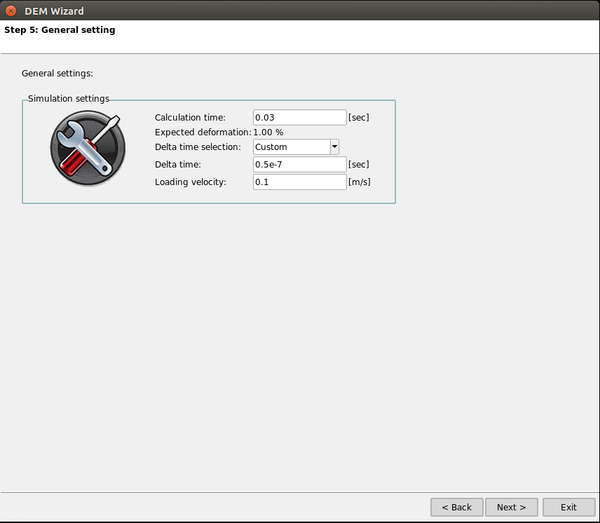
|
| Time simulation parameters. |
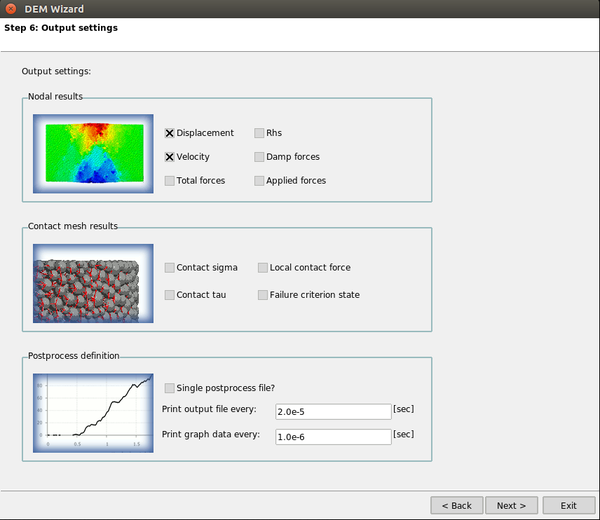
|
| Figure 43: Customized DEM wizard. Step-by-step guide. |
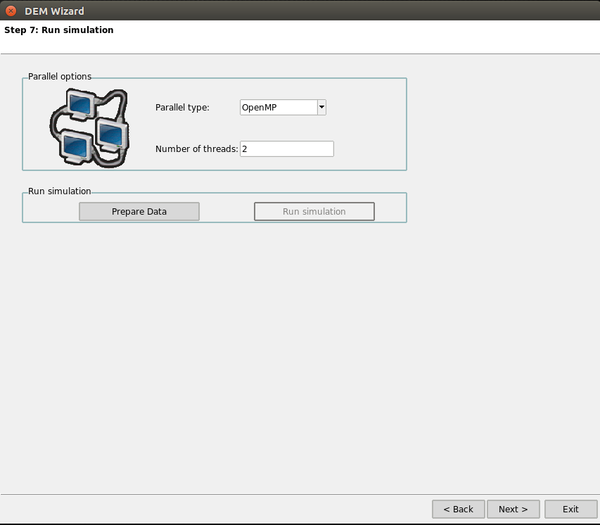
|
| Parallelization options. |
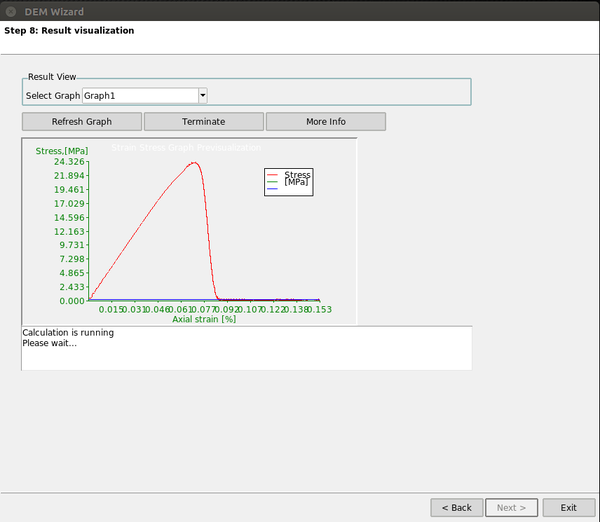
|
| Figure 44: Customized DEM wizard. Step-by-step guide. |
7 Experimental Uniaxial Strain Compaction test
We can observe both the initial elastic branch and a (elasto-plastic) hardening branch.![Uniaxial strain compaction test in cement sample [20]. Normal total compressive stress-axial strain relationship.](/wd/images/thumb/b/be/Draft_Aparicio_Nogu%C3%A9_450013832-Fig-SampleUC4.png/600px-Draft_Aparicio_Nogu%C3%A9_450013832-Fig-SampleUC4.png)
|
| Figure 45: Uniaxial strain compaction test in cement sample [20]. Normal total compressive stress-axial strain relationship. |
![Uniaxial strain compaction test in cement sample [20]. Differential stress between the applied axial stress and the confinement pressure.](/wd/images/thumb/b/ba/Draft_Aparicio_Nogu%C3%A9_450013832-Fig-SampleUC5.png/600px-Draft_Aparicio_Nogu%C3%A9_450013832-Fig-SampleUC5.png)
|
| Figure 46: Uniaxial strain compaction test in cement sample [20]. Differential stress between the applied axial stress and the confinement pressure. |
![Uniaxial strain compaction test in cement sample [20]. Confinement pressure versus axial deformation.](/wd/images/thumb/9/97/Draft_Aparicio_Nogu%C3%A9_450013832-Confinement-pressure.png/600px-Draft_Aparicio_Nogu%C3%A9_450013832-Confinement-pressure.png)
|
| Figure 47: Uniaxial strain compaction test in cement sample [20]. Confinement pressure versus axial deformation. |
References
[1] Cundall, Peter A and Strack, Otto DL. A discrete numerical model for granular assemblies, Volume 29. Thomas Telford. Geotechnique 1 47–65, 1979
[2] Agnolin, Ivana and Roux, J-N. On the elastic moduli of three-dimensional assemblies of spheres: Characterization and modeling of fluctuations in the particle displacement and rotation, Volume 45. Elsevier. International Journal of Solids and Structures 3 1101–1123, 2008
[3] Chang, Ching S and Hicher, P-Y and Yin, ZY and Kong, LR. Elastoplastic model for clay with microstructural consideration, Volume 135. American Society of Civil Engineers. Journal of engineering mechanics 9 917–931, 2009
[4] Munjiza, Antonio and Cleary, Paul W. Industrial particle flow modelling using discrete element method, Volume 26. Emerald Group Publishing Limited. Engineering Computations 6 698–743, 2009
[5] Kruyt, NP and Rothenburg, L. Kinematic and static assumptions for homogenization in micromechanics of granular materials, Volume 36. Elsevier. Mechanics of Materials 12 1157–1173, 2004
[6] Donzé, Frédéric V and Richefeu, Vincent and Magnier, Sophie-Adélaïde. Advances in discrete element method applied to soil, rock and concrete mechanics, Volume 44. State of the art of geotechnical engineering. Electronic Journal of Geotechnical Engineering 31, 2009
[7] Fakhimi, A and Villegas, T. Application of dimensional analysis in calibration of a discrete element model for rock deformation and fracture, Volume 40. Springer. Rock Mechanics and Rock Engineering 2 193–211, 2007
[8] Hentz, Sébastien and Daudeville, Laurent and Donzé, Frédéric V. Identification and validation of a discrete element model for concrete, Volume 130. American Society of Civil Engineers. Journal of engineering mechanics 6 709–719, 2004
[9] Hsieh, Yo-Ming and Li, Hung-Hui and Huang, Tsan-Hwei and Jeng, Fu-Shu. Interpretations on how the macroscopic mechanical behavior of sandstone affected by microscopic properties revealed by bonded particle model, Volume 99. Elsevier. Engineering Geology 1 1–10, 2008
[10] Labra, Carlos Andrés and de Navarra, Eugenio Oñate Ibáñez and Rojek, J. Advances in the development of the discrete element method for excavation processes. International Center for Numerical Methods in Engineering, 2012
[11] Onate, E and Rojek, J. Combination of discrete element and finite element methods for dynamic analysis of geomechanics problems, Volume 193. Elsevier. Computer methods in applied mechanics and engineering 27 3087–3128, 2004
[12] Zienkiewicz, Olek C and Taylor, Robert L. The finite element method for solid and structural mechanics. Butterworth-heinemann, 2005
[13] Labra, Carlos and Rojek, Jerzy and Oñate, Eugenio and Zarate, Francisco. Advances in discrete element modelling of underground excavations, Volume 3. Springer. Acta Geotechnica 4 317–322, 2008
[14] Burlion, Nicolas and Pijaudier-Cabot, Gilles and Dahan, Noël. Experimental analysis of compaction of concrete and mortar, Volume 25. Wiley Online Library. International journal for numerical and analytical methods in geomechanics 15 1467–1486, 2001
[15] Potyondy, DO and Cundall, PA. A bonded-particle model for rock, Volume 41. Elsevier. International journal of rock mechanics and mining sciences 8 1329–1364, 2004
[16] Oñate, E and Zarate, F and Miquel, J and Santasusana, M and Celigueta, MA and Arrufat, F and Gandikota, R and Valiullin, K and Ring, L. A local constitutive model for the discrete element method. Application to geomaterials and concrete. Springer. Computational Particle Mechanics, 2015
[17] Tran, VT and Donzé, F-V and Marin, P. A discrete element model of concrete under high triaxial loading, Volume 33. Elsevier. Cement and Concrete Composites 9 936–948, 2011
[18] Lubliner, J and Oliver, J and Oller, Sand and Onate, E. A plastic-damage model for concrete, Volume 25. Elsevier. International Journal of solids and structures 3 299–326, 1989
[19] Gabet, Thomas and Malécot, Yann and Daudeville, Laurent. Triaxial behaviour of concrete under high stresses: Influence of the loading path on compaction and limit states, Volume 38. Elsevier. Cement and Concrete Research 3 403–412, 2008
[20] Kwon, O. Rock mechanics testing analyses. Cement mechanical testing. Weatherford Laboratories RH-45733, 2010
[21] Sfer, Domingo and Carol, Ignacio and Gettu, Ravindra and Etse, Guillermo. Study of the behavior of concrete under triaxial compression, Volume 128. American Society of Civil Engineers. Journal of Engineering Mechanics 2 156–163, 2002
Document information
Published on 01/01/2015
Licence: CC BY-NC-SA license
Share this document
Keywords
claim authorship
Are you one of the authors of this document?
