1 Introducción
The main project drivers, have been CO2 emission restrictions and the potentiality of composite materials(CFRP) for saving weight and improve other characteristics like; impact energy dissipation, specific stiffness and strength and fatigue resistance [1-2].
Project challenges have been to get a competitive manufacturing process and installation that will be able to get short cycle time, good quality, repeatability and high automation level. Finally, the process should be validated with a real part; in this case, a door reinforcement.
2 RTM variants. Cost analysis comparison
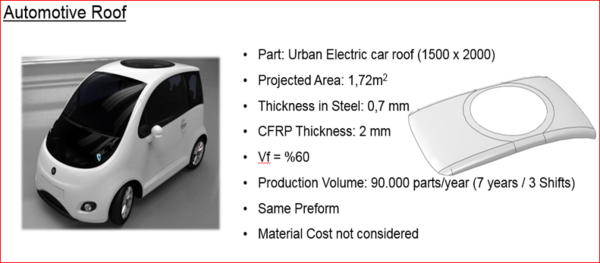
The starting point of the project was to analyze with a real case study and using simulation like tool, the cost of this process compared with other RTM variants [3].
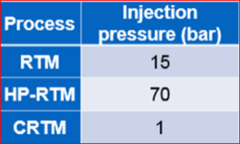
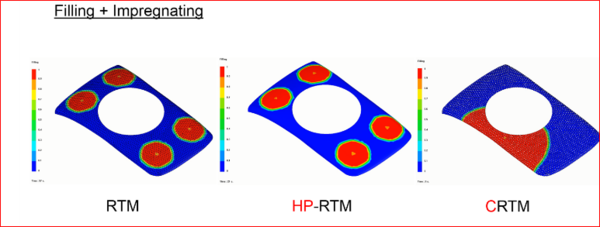
Mold filling simulations have been carried out using PAM-RTM software. The number of injection gates affects the filling time and is a key issue when optimizing the RTM process. However, as the aim was to compare the RTM variants, a single injection point for CRTM, and 4 inlet points for the RTM and HP-RTM have been set. The positions of the injection points, however, have been optimized in order to reduce the filling time as much as possible.
The cost of the presses, the injection machine, the molds, the robots and the occupied plant area are reported in the shown table. The cost of the presses for each RTM variant is calculated using the clamping force and if parallelism control is needed or not. Press speeds are considered to be the same for all processes, as there’s no influence when working with a close mould.
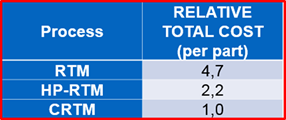
The final roof costs, with the main contributions factors, are summarized in the shown table. Taking the CRTM as reference, roof cost manufactured by HP-RTM is 2.5 times higher, and RTM one 5 times. The equipment and tooling costs, and specially the number of units, are the most relevant contributors, since they represent approximately the 90% of the total cost at the three studied RTM variants. Otherwise, the number of presses has a direct effect on the cell area, so the incidence could be stated as high as 94%. From the energy-efficient point of view CRTM is also the best, while RTM is the less competitive.
As a conclusion, we can say that:
- CRTM is the fastest process.
- Investment level is the lowest.
- Bigger Plant area for RTM and HP-RTM than for CRTM.
- Part cost considering investment payback and energy consumption in CRTM is much lower.
- CRTM has limitations for complex geometrical parts.
3 CRTM process characterization
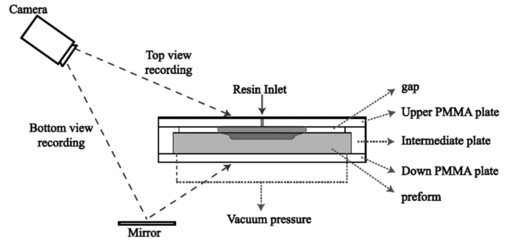
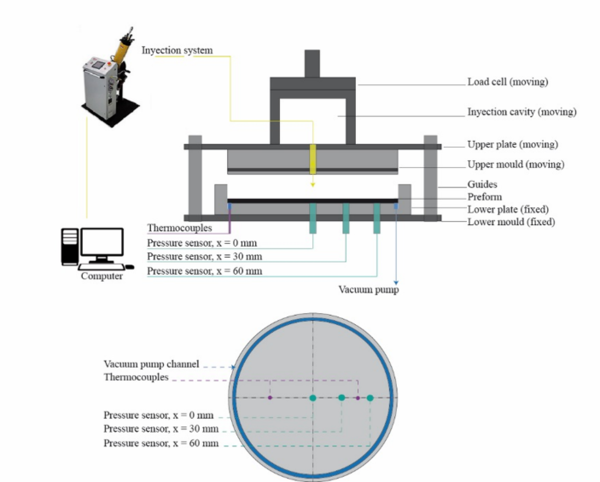
Fagor Arrasate wanted to do a depth analysis of the CRTM process and take a more fundamental knowledge of the physics of impregnation: the compression impregnation step leads to an interaction of the preform compressibility and the flow front which is usually not considered in conventional RTM. The thickness of the gap on the preform during injection or mold closure strategy during compression must be carefully selected according to the objective (minimize the filling time or reduce the closing force) [4-7]. Therefore, to develop this innovative process it is necessary to use a holistic approach encompassing both mold design and configuration of the press, an understanding of variable preform compaction by the through-thickness flow front using advanced experimental techniques (materials characterization, process control and monitoring parameters) and robust computational models [8].
The material that has been used:
-Epoxy (XB 3585 / Aradur 3475, HUNSTMAN)
-Biaxial fabric (HPT 610 C090, 50k, SGL)
-Binder (Araldite LT 3366 BD)
3.1 Injection stage
By simulation and experimental analysis there have been studied the next parameters:
-Resin viscosity
-Preform permeability
-Gap thickness
-Injection pressure
-Injection flow-rate
-Injected resin volume
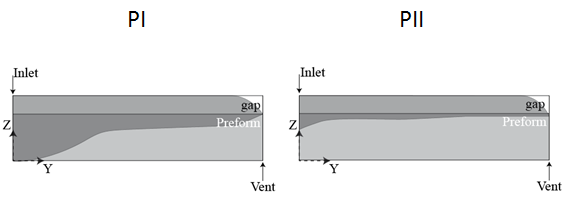
After several trials, we can say that there are two injection patterns:
At the firs one there is a bottom impregnation an at the second one there isn´t.
The main conclusion obtained from these characterization is that resin distribution depends mainly on:
-Gap thickness.
3.2 Compression stage
By simulation and experimental analysis there have been studied the next parameters:
-Initial resin distribution.
-Compression speed.
-Compression pressure.
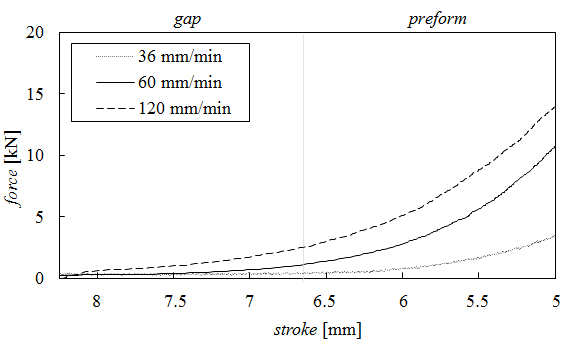
The main conclusion obtained from these characterization is that Compression time and loads depends mainly on:
-Resin volume.
-Speed control of the compression phase.
The stroke of the gap should be done us fast is it possible in order to save time but at the stroke of the preform you can´t save so much time so, as the force is bigger, not worth to go so fast.
4 Door reinforcement
An anti-intrusion bar has been designed and manufactured for the door of a car. It is a type demonstrator, not a real component, which nevertheless has almost all the geometric characteristics of an actual component of this type. The design process was carried out based on finite elements and the manufacturing process was also designed using the PAM-RTM software. In addition, a prototype was developed before launching the fabrication of the metal mold, using a mold made in 3D printing.
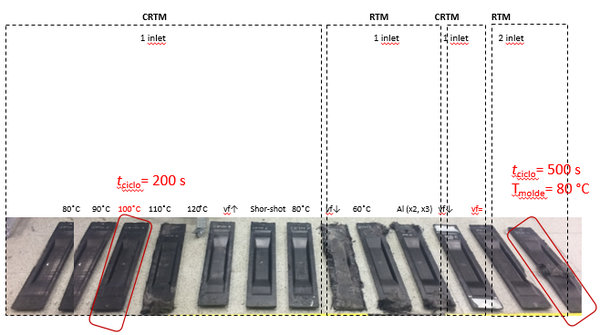
Once the mold was manufactured, different filling strategies were analyzed; both by RTM and CRTM. At the next figure, it can be seen that for this case and with the available resources, it was not possible to fill the mold using traditional RTM either because of the low permeability of the preform or because of the appearance of preferential filling paths that prevented the impregnation of certain areas of the mold. In contrast, using CRTM and using different strategies, the mold was adequately filled.
5 New press and cell for Advanced CRTM
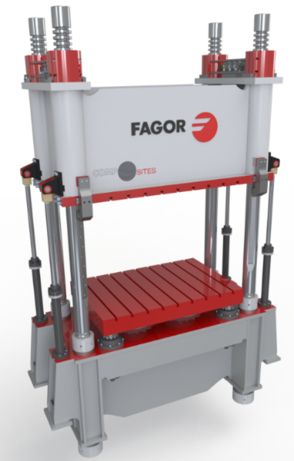
A new press architecture has been developed adjusted for composite processes and with a specific control system customized for CRTM process. Other characteristics of the press are:
-Reduced Height.
-Integrated Parallelism Control.
-Bolster Deformation Control.
-Rapid Closing Speed of the Slide.
-Short Pressure Build up Time.
-Reduced Energy Consumption.
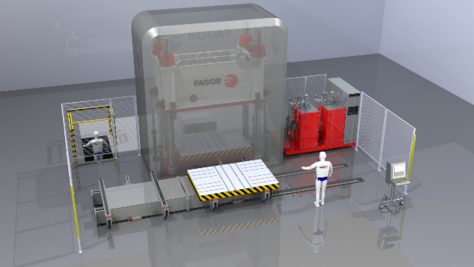
In addition, and in order to prepare a complete solution for manufacturing parts in CRTM, Fagor Arrasate has defined a manufacturing cell.
6 Conclusions
-CRTM is the most suitable manufacturing process from cost, energy consumption and cycle time point of view.
-Specific CRTM process knowledge has been developed and has been implemented in our press and cell control.
-A tight cell solution has been defined for CRTM.
References
[1] Bein T, Bös J, Mayer D, Melz T. Advanced Materials in Automotive Engineering. 2012.
[2] P Feraboli, A. Masini. Advanced composites for the body and chassis of a production high. Performance car. Int J Veh Des 2007;Volume 44.
[3] M. Baskaran, I. Ortiz de Mendibil M, Sarrionandia M, Aurrekoetxea J, Acosta J, Argarate U,Chico D. Manufacturing cost comparison of RTM, HP-RTM and CRTM for an automotive roof.16TH Eur Conf Compos Mater Seville, Spain, 22-26 June 2014 n.d.:22–6.
[4] Simacek P, Advani SG, Iobst S. Modeling Flow in Compression Resin Transfer Molding for Manufacturing of Complex Lightweight High-Performance Automotive Parts. J Compos Mater 2008;42:2523–45.
[5] Bhat P, Merotte J, Simacek P, Advani SG. Process analysis of compression resin transfer molding. Compos Part A Appl Sci Manuf 2009;40:431–41.
[6] Walbran W, Verleye B, Bickerton S, Kelly P. Reducing setup costs: tooling force prediction in resin transfer moulding ( RTM ) and compression RTM of Mechanical Engineering , 2 Department of Engineering Science , n.d.:1–18.
[7] Merotte J, Simacek P, Advani SG. Flow analysis during compression of partially impregnated fiber preform under controlled force. Compos Sci Technol 2010;70:725–33.
[8] Shojaei A. Numerical simulation of three-dimensional flow and analysis of filling process in compression resin transfer moulding. Compos Part A Appl Sci Manuf 2006;37:1434–50.
Document information
Published on 14/04/19
Accepted on 14/04/19
Submitted on 14/04/19
Volume 03 - Comunicaciones Matcomp17 (2019), Issue Núm. 2 - Aplicaciones, uniones y reparaciones de los materiales compuestos, 2019
DOI: 10.23967/r.matcomp.2019.04.008
Licence: Other
Share this document
Keywords
claim authorship
Are you one of the authors of this document?
