Abstract
In this research, steel furnace slag, fly ash and new synthesized polycarboxylate was used to replace cement in concrete composition. Concrete was made in three grades of 400, 450 and 500 using steel furnace slag, fly ash and polymer with different percentages of dry weight. Also, the amount of water to cement was selected as one of the effective parameters in concrete strength and production costs. The results showed that slag percent had a positive effect on improving samples strength. Also, increasing the percentage of polycarboxylate and decreasing the amount of water per cement ratio increased the strength of concretes. Finally, by examining the effect of several parameters on the strength of concrete, an economic evaluation was performed to manage the cost of increasing the strength of concrete. The results also indicated that with increasing percentage of resistance, the amount of costs increased in all three grades: 400, 450 and 500.
Keywords: Steel furnace slag, concrete, polycarboxylate, fly ash, economic evaluation
1. Introduction
The cement industry is an environmentally unfriendly industry due to the continuous emission of CO2 during the production of raw materials (limestone and clay) depending on the cement production process. The development of alkaline active materials and the use of polymers in the manufacture of concrete is an up-to-date study among the scientific community. Lower emission materials such as pozzolan, clay, fly ash, blast furnace slag, wastewater treatment sludg, zeolite powder, microsilica and silica fume are recommended to replace OPC [1-7]. Industrial by-products such as fly ash (FA) and blast furnace slag (GGBFS) are combined with strong alkaline activating solutions such as calcium oxide, sodium silicate, sodium hydroxide, and sodium silicate and sodium hydroxide. Polymer concrete with similar strength or higher than ordinary Portlan cement concrete (OPC) [8] The polymerization mechanism can be identified by three steps, in the first stage the dissolution of oxide materials from fly ash or slag with alkaline solution was achieved, in the second stage , Gel formation by transfer and condensation of soluble oxide ions to monomers, and in the last stage a three-dimensional network of aluminosilicate is formed as a result of polycondensation and polymerization to amorphous to aluminosilicate polymers. Polymeric materials have higher chemical and mechanical performance [9]. Polymer concrete has been the subject of much research in recent years due to its mechanical and high strength, thermal and chemical resistance, and the bond between steel reinforcements and concrete components [10]. Due to these useful properties, polymer concrete can be an alternative to ordinary Portland cement (OPC) concrete. Possible applications are polymer concrete, fiber-reinforced composites, fire-resistant coatings, and waste stabilization solutions for the chemical and nuclear industries [11]. Researchers are mostly concerned with polymer concrete production processes and the effects of production constraints on the physical and mechanical properties of polymer concrete. Limited studies have been performed on the durability of polymer concretes and the results showed that polymer concretes showed higher durability performance when exposed to different acidic environments than OPC concrete [12].
Due to the lack of cement, polymer concretes have a high potential in the concrete industry, which compared to OPC concrete (which requires a lot of energy and produces a lot of CO2), requires lower production costs and suitable energy. Compressive strength of more than 45 MPa within 24 hours and high resistance to chemical attacks make polymer concrete to be used in commercial and industrial applications [13-14]. Concrete durability has become an important issue in the future [15]. Because many structures in urban and coastal environments begin to deteriorate after 20-30 years of exposure to acid, sulfate and chloride, although their design life is at least 50 years [16]. Some studies showed that the strength of concrete used in buildings and even industry, including cylindrical silos, play an important role [17]. There are a limited number of studies examining the durability of polymer concretes under chemical attack, or a small number based on the simultaneous use of cementitious materials (fly ash, slag) with OPC concrete. Also, a small number of studies have been done, which is only on durability, without considering the performance and mechanical properties of polymer concrete. Therefore, the use of polymer concrete in structural designs is still limited due to the lack of standards in the design codes as well as the lack of knowledge, especially in terms of durability. Carboxylate concrete additive polymers are efficient and unique products based on polycarboxylate ether [18]. Polycarboxylate polymers in concrete severely reduce water mixing in concrete and improve the dispersion of cement particles. Carboxylate polymer additives are able to reduce concrete water by up to 30%, followed by reducing concrete capillary pores, reducing water absorption and permeability of concrete, and increasing the strength of concrete [19].
Cement requires an additive that can minimize the particles of cement components and, on the other hand, disperse the cement-forming particles evenly throughout the mixture. Concrete admixtures can prevent cement particles from sticking to each other by electrostatic repulsion properties and creating a space barrier in polycarboxylate ethers, thus minimizing the cement's need for water. Carboxylate polymer additive was in the focus of researchers due to its high ability to reduce water in order to prepare cement with high strength, high fluidity and self-compacting ability in cement [20]. Due to the mentioned properties that the use of carboxylate additives for concrete creates, as a result, we will see an increase in the durability and useful life of concrete structures in corrosive environments such as the Persian Gulf [21]. Carboxylate polymer additive due to its chemical basis will not have any adverse effect on setting time and other properties and characteristics of concrete. Due to the sharp decrease in water that will result from the use of carboxylate superplasticizer in concrete. It is a suitable option for temperate and tropical climates and precast concrete factories. Carboxylate polymer additive has a higher power in lubricating concrete than other similar polymer additives and therefore its consumption ratio is much lower than other concrete plasticizers [22] and as a result it will be more economical than other conventional methods. Plasticizing chemical additives in concrete reduce the water requirement for performance and application. The superplasticizer also maintains the constant consistency of the concrete for a certain period of time. The dispersion mechanism of these additives depends on two different types of thrust forces between the cement particles: the effects of electrostatic repulsion and the asteric repulsion. Clearly, electrostatic repulsion occurs due to negative charge by carboxyl groups, but steric repulsion occurs due to long polymers.
In this paper, OPC samples were first evaluated to study slump in three grades of 400, 450 and 500. For this purpose, slump was measured in different ratios of water to cement as well as in different percentages of polycarboxylate. In the following, the effect of different amounts of iron slag and fly ash as well as the percentage of polycarboxylate used on the strength of concrete was evaluated. According to the results, the economic evaluation was optimized in five parameters: grade, water ratio, carboxylate content, fly ash and iron slag. The purpose of this study was to investigate the mechanical properties, strength of polymer concretes and cost evaluation to understand the application of polymer concretes in structural design and find the optimal solution of concrete type when exposed to the Persian Gulf environment and compare the results with OPC concrete.
2. Materials and methods
Ordinary Portland cement (OPC) was manufactured by a local cement company (ABYEK). The clay was calcined at 800 °C in a semi-industrial rotary kiln with a residence time of 15 minutes. Rietveld analysis of calcined clay showed that it contained 42% calcined kaolinite (metakaolin) and the remaining kaolinite, quartz (16%) without calcium and illite, anatase and hematite (total ). The chemical composition (from X-ray fluorescence analysis) and the properties of fly ash and iron slag are listed in Table 1.
| Chemical Components | Fly Ash | Slag |
|---|---|---|
| SiO2 | 59.03 | 38.4 |
| Al2O3 | 25.8 | 10.3 |
| Fe2O3 | 5.8 | 3.6 |
| CaO | 1.1 | 35.7 |
| Na2O | 0.1 | 1.2 |
| MgO | 0.6 | 6.2 |
| K2O | 1.8 | 0.8 |
| TiO2 | 1.7 | 1.3 |
| SO3 | 0.1 | - |
| MnO | 0.1 | 1.3 |
| P2O5 | 0.7 | - |
| LOI (850 ̊C) | 5.99 | 0 |
2.1 Polymer synthesis as a superplasticiser
Combination superplasticizer was synthesized by the free radical polymerization of aqueous methacrylic acid and ω-methoxypolyethylene glycol methacrylate (MPEG macromonomer containing 40 units of ethylene oxide).
PCE was prepared in the molar ratio of methacrylic acid to MPEG 2: 1 macromonomer. The synthesis was performed as follows: 40 g of DI water was added to a five-round flask with a round bottom. The flask was equipped with a stirrer, N2 gas inlet, return condenser and thermometer. The flask was rinsed with N2 for 1 h and then heated to 80 °C. Then, two solutions were prepared. Solution I: A mixture of 18 g of methacrylic acid, 402 g of macro monomer MPEG and 2.4 g of 3-mercaptopropionic acid in 20 g of DI water, Solution II, on the other hand, contained 2.5 g of sodium sulfate (as a initiator) in 80 g of water. Both solutions are continuously fed for 4 hours (solution I) or 5 hours (solution II) using two peristaltic pumps in the reaction vessel. After addition, the polymer solution was stirred for another hour at 80 °C and cooled in medium. Finally, pH 7 was adjusted using 30 wt% NaOH to obtain a slightly yellowish polymer solution with a solid content of 31.9 wt% as the final product.
2.2 NMR and FT-IR analysis
1H and 13C NMR spectra on the AVANCE-III 400 MHz NMR spectrometer (Bruker BioSpin GmBH, Karlsruhe, Germany). registrated. Chemical changes were noted for the residual solvent signal (D2O: 1H NMR ppm). The infrared spectrum was measured on a Vertex 70 FT-IR spectrometer (broker) using a diamond ATR unit.
2.3 Steel furnace slag specifications
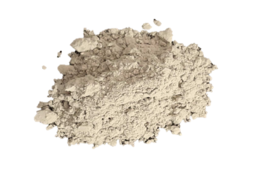
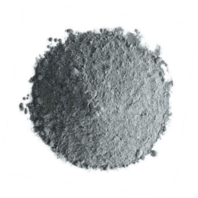
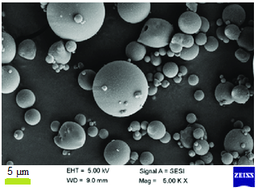
The slag used in this project was Iron Ore Production Slag (GGBFS). The initial image of the slag earned by ordinary camera and scanning electron microscope (SEM) images are shown in Figure 1 (a,b). Also, the particle sizes are classified by normal cumulative distribution method in Figure 2. Images were processed by using labview [23], and the outcome quantitative data were analyzed by MATLAB 2014a. According to the distribution curves in Figures 1 and 2 the particles size was less than 100 µm and there were no significant difference between GGBFS particles and fly ash particles in size.
|
|
| (a) | (c) |

|
|
| (b) | (d) |
| Figure 1. Ordinary camera images and scanning electron microscope (SEM) images. (a,b) GGBFS (milled). (c,d) Fly ash | |

|
| Figure 2. Cumulative particle size distribution for GGBFS and fly ash |
Ground granulated blast-furnace slag is an intermediate product produced in the steel plant. Slag is generally composed of aluminium oxide (Al2O3), lime (CaO) and Silicon dioxide (SiO2). Blast furnace slag differs from steel slag in chemical composition and physical properties. In general, blast furnace slag has fewer compositions and uniform texture, and its specific gravity was lower than conventional heavy materials. One of the main differences between blast furnace slag and steel slag is the presence of more amorphous silica (SiO2) in this slag, so blast furnace slag has more pozzolanic properties and can be used in the cement industry. Also, the constituent elements of this article are reported in Table 1. The available elements were analyzed using quantitative X-ray fluorescence analysis (XRF) and quantified. From the results of this table, we can easily see that the highest amounts of elements, including silicon and calcium. These elements are among the main elements in the pozzolanic reaction.
2.4 Fly ash specifications
Fly ash is mainly a non-crystalline and glassy coal fuel product that is produced as a waste of the coal fuel process. An image of fly ash powders is shown in Figure 1 (c,d). As well, the cumulative distribution of the fly ash particles are shown in Figure 2. Accordingly, the particles size width beginning from less than 1 µm up to 100 µm. Based on the results presented in Table 1, the fly ash contains alumina, silica and iron oxides, and cesium oxide. It is presented in two classes C and F, which is classified according to the amount of CaO: calcium oxide is more than 10% classified in class F, and calcium oxide less than 10% placed in class C. The analysis of elements in fly ash used in this project was given in Table 1. These results are the result of X-ray fluorescence (XRF) analysis. As shown in the table, the ash used contains large amounts of silica. The amount of calcium oxide in the fly ash sample was low (0.4%). In fact, the fly ash used in this project was in class F.
2.5 Density test of concretes
Density testing was performed on all samples with additives according to ASTM D1557 standard and modified method. The purpose of this experiment was to calculate the specific dry weight and optimum moisture for the samples. The results including the number of layers, number of strokes and molds and other details are given in Table 2.
| Parameter | Value |
|---|---|
| Mold Size | 941.2 cm |
| Mold Diameter | 10.2 cm |
| Mold height | 11.5 cm |
| Hammer weight | 4500 g |
| Number of layers | 5 |
| Falling height | 45 cm |
| Number of strokes per layer | 25 |
| The resulting compaction energy per unit volume | 905.2 g/cm |
2.6 Slump test to measure rheological parameters of fresh concrete
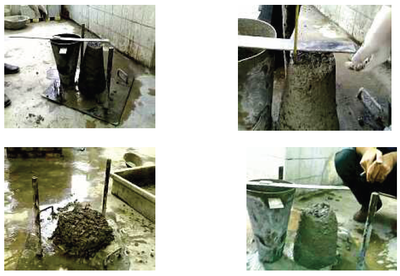
The placement quality of concrete depends on at least two physical factors: plastic viscosity and yield stress. Studies have shown that the most common and simplest practical test was the drop test and the results are related to performance stress. Therefore, in order to evaluate Bingham's two rheological parameters, performance stress and plastic viscosity, a field test method was developed in this project. For this purpose, the slump test was used according to the ASTM C143 instruction. Since the validity of this test has been confirmed in many studies, in this project it was used as a field quality control test. Some styles of the performed test is presented in Figure 3.
|
| Figure 3. Slump test for produced concretes in laboratory environment |
2.7 Compressive strength test
Compressive strength tests were performed according to BS 1881 standard. Compressive strength tests have been performed on cubic specimens measuring 150 mm. First, the cube samples were made to investigate the difference in compressive strengths in the way the cubes are placed in the compression device, so that if the results are not noticeable, the coping operation was omitted for ease of work. With a difference of 1% in the compressive strength results, the method of placing the specimens in the form of two opposite surfaces that were in contact with the upper and lower stirrups of the machine at the time of concreting was selected. By dividing this force by the cross section of the sample was obtained.
3. Results and discussion
In this section, the usability of new synthesized polycarboxylate and the experimental results of the related concretes in question are discussed. It should be noted that the characteristics of the materials used, mixing ratios and the method of the above tests are given in the Materials and Methods section. As mentioned earlier, carboxylate polymer was used to make the concrete samples. In the following samples, pozzolan was not used at first to determine the optimal carboxylate percentage. Finally, two types of pozzolans of fly ash and iron slag in different percentages have been used in the preparation of samples.
3.1 Verification of synthesized superplasticizer
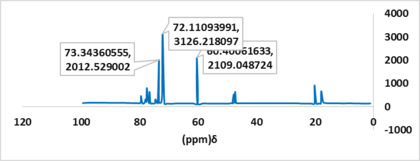
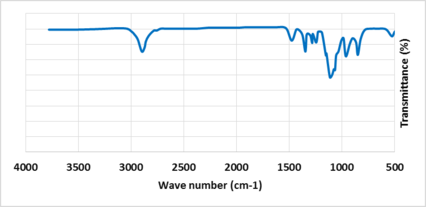
Because of the complexities in preparation methods of polymers, it was necessary to authenticate the final product by the strong approving methods. Therefore final products was analyzed by HNMR, CNMR, and FTIR spectroscopies, and the results was presented in Figures 4 and 5. The C-O ester tensile vibration absorption band disappeared at 1736 cm-1 and a new band appeared in the FT-IR spectrum at 1595 cm-1 due to the tensile vibration. The 1H/13C NMR and FT-IR spectra of the carboxylate group of poly(Et-COOH) 2 are shown in Figures 4 and 5. Thus, the analysis confirmed that the aimed compounds were successfully obtained.

| |
| (a) | |
| |
| (b) | |
| Figure 4. (a) H1NMR and (b) C13NMR pattern of the polycarboxylate used as superplasticizer | |
|
| Figure 5. FTIR pattern of the polycarboxylate used as superplasticizer |
3.2 Investigation the effect of the water content and carboxylate percentage on the concrete slump
In this paper, for the means of true investment, the slump results of three selected grades of concretes types 400, 450, and 500 (Kg/m), respectively was presented in two parameter type: water per cement content and polycarboxylate per cement content. Experimental design was according to multi factor at a time analysis. For the purpose, each of two factors including water and polycarboxylate content was arranged in 6 levels for three cement grades (Table 3). Gui-zhong et al. illustrated that the water content affecting the slump flow by 15 (cm/80% of water) [24]. According to the Gui-zhong et al. outcomes the slump was related to the salinity, and by increasing the salinity the slump decreased.
| Concrete Grade | Sample | Carboxylate content (%) | Water content (%) | Slump (mm) |
|---|---|---|---|---|
| 400 (Kg/m) | M1 | 0.3 | 0.45 | 35 |
| M2 | 0.5 | 0.44 | 45 | |
| M3 | 0.7 | 0.43 | 63 | |
| M4 | 1 | 0.41 | 97 | |
| M5 | 1.3 | 0.40 | 123 | |
| M6 | 1.6 | 0.39 | 162 | |
| 450 (Kg/m) | M7 | 0.3 | 0.39 | 31 |
| M8 | 0.5 | 0.38 | 55 | |
| M9 | 0.7 | 0.37 | 76 | |
| M10 | 1 | 0.36 | 91 | |
| M11 | 1.3 | 0.35 | 121 | |
| M12 | 1.6 | 0.34 | 147 | |
| 500 (Kg/m) | M13 | 0.3 | 0.35 | 25 |
| M14 | 0.5 | 0.34 | 37 | |
| M15 | 0.7 | 0.33 | 56 | |
| M16 | 1 | 0.32 | 87 | |
| M17 | 1.3 | 0.31 | 102 | |
| M18 | 1.6 | 0.30 | 123 |
Slump of the concrete produced with grade 400 Kg/mFailed to parse (MathML with SVG or PNG fallback (recommended for modern browsers and accessibility tools): Invalid response ("Math extension cannot connect to Restbase.") from server "https://mathoid.scipedia.com/localhost/v1/":): ^3
- Based on the results in Figures 6 and 7, slump versus changes in water to cement ratio, which have been observed for concrete samples with the grade of 400 kg/m, by increasing water to cement ratio, the slump number has decreased. More specifically, by reducing the ratio of water to cement from 0.45 to 0.39, the slump number has increased from 35 mm to 162 mm, which was a growth equal to 4.6 times.

|
| Figure 6. Effect of carboxylate content on the samples slump in three grade 400, 450, and 500 |

|
| Figure 7. Effect of water content on the samples slump in three grade 400, 450, and 500 |
As it can be indicated from Figure 7 and Table 3, the slump number increased by increasing in the percentage of polycarboxylate superplasticizer for concrete samples with a grade of 400 kg/m. Also, with increasing the percentage of superplasticizer from 0.3% to 1.6%, the amount of slump has increased from 35 mm to 162 mm. The numerical variation of the slump growth ratio to the superplasticizer percentage was equal to 0.86(mm/% superplasticizer).
Slump of the concrete produced with grade 450 Kg/m: The changes of slump number against water to cement ratio for samples (M7-M12) with a grade of 450 kg/m are shown in Figure 6, and Table 3. Based on the results, with increasing water to cement ratio, the slump number decreased. Thus, by reducing the water to cement ratio from 0.39 to 0.34, the amount of slump has increased from 31 mm to 147 mm, which was a growth equal to 4.7 times. Moreover, for concrete samples with a grade of 450 kg/m, it has been observed that with increasing the percentage of polycarboxylate superplasticizer, the amount of slump of samples increased. According to the qualitative identifications, with increasing the percentage of superplasticizer from 0.3% to 1.6%, the slump number increased from 31 mm to 147 mm, which can be said that the ratio of slump growth to the percentage of superplasticizer was equal to 0.88(mm/% superplasticizer).
Slump of the concrete produced with grade 500 Kg/m: Slump changes against water to cement ratio for concrete samples with a grade of 500 kg/m are shown in Figure 6, and Table 3. The results showed that with decreasing water to cement ratio, the slump number had an increasing trend. Thus, by reducing the ratio of water to cement from 0.35 to 0.30, the amount of slump has increased from 25 mm to 123 mm, which was a growth equal to 4.9 times. Finally, changes in the slump number against the percentage of polycarboxylate superplasticizer for samples with a grade of 500 kg/m are shown in Figure 7 and Table 3. It has been observed that with increasing the percentage of polycarboxylate superplasticizer, the slump number of samples has increased. This means that, with increasing the percentage of superplasticizer from 0.3% to 1.6%, the slump number has increased from 25 mm to 123 mm, which can be said that the ratio of slump growth to the percentage of superplasticizer growth was equal to 0.92 (mm/% superplasticizer).
Many studies tried to enhance the slump in concrete by introducing new superplasticizers. Shenoy et al. produced new organic superplasticizer from Albizia Saman pod which decreased water content in 10% in same slump [25]. By using such superplasticizer the compressive strength increased in 6%. Also, mineral admixtures such as silica fume (10%) caused 30% decrease in slump flow [26]. Based on the results represented for comparing the changes of slump against the ratio of water to cement in concretes with different grades of cement with polycarboxylate superplasticizer, it has been observed that with increasing the ratio of water to cement, the slump number has decreased in the all three grades. Also, by increasing the grade of cement in concrete in the fixed ratio of water to cement, concrete with lower cement grade (G400) had more slump number than others. It has been observed that with increasing the percentage of polycarboxylate superplasticizer, the slump number generally had an upward trend. Also, by increasing the grade of cement in concrete in the percentage of fixed polycarboxylate superplasticizer, concrete with higher grade had less slump number.
3.3. Investigation the effect of the water content and carboxylate percentage on the concrete compression strength
In this section, the compressive strength of concretes containing different percentages of polycarboxylate superplasticizer is discussed. The desired ages are 7, 14, 28 days. The results of compressive strength of samples at different ages are shown in Table 4, Figure 6 and Figure 8. The samples were kept in water before being placed under the jac
| Concrete Grade | Sample | Carboxylate content (%) |
Water content (%) |
Compressive strength | ||
|---|---|---|---|---|---|---|
| 7 day | 14 day | 28 day | ||||
| 400 (Kg/m) | M1 | 0.3 | 0.45 | 22.4 | 28.8 | 32 |
| M2 | 0.5 | 0.44 | 24.5 | 31.5 | 35 | |
| M3 | 0.7 | 0.43 | 27.3 | 35.1 | 39 | |
| M4 | 1 | 0.41 | 30.1 | 37.8 | 43 | |
| M5 | 1.3 | 0.40 | 31.5 | 40.5 | 45 | |
| M6 | 1.6 | 0.39 | 33.6 | 43.2 | 48 | |
| 450 (Kg/m) | M7 | 0.3 | 0.39 | 26.6 | 34.2 | 38 |
| M8 | 0.5 | 0.38 | 28 | 36 | 40 | |
| M9 | 0.7 | 0.37 | 31.5 | 40.5 | 45 | |
| M10 | 1 | 0.36 | 32.2 | 41.4 | 46 | |
| M11 | 1.3 | 0.35 | 33.6 | 43.2 | 48 | |
| M12 | 1.6 | 0.34 | 35.7 | 45.9 | 51 | |
| 500 (Kg/m) | M13 | 0.3 | 0.35 | 30.1 | 38.7 | 43 |
| M14 | 0.5 | 0.34 | 30.8 | 39.6 | 44 | |
| M15 | 0.7 | 0.33 | 33.6 | 43.2 | 48 | |
| M16 | 1 | 0.32 | 35 | 45 | 50 | |
| M17 | 1.3 | 0.31 | 36.4 | 46.8 | 52 | |
| M18 | 1.6 | 0.30 | 38.5 | 49.5 | 55 | |

|
| Figure 8. Compressive strength for all concrete samples in three levels (7 Day, 14 Day, and 28 Day) |
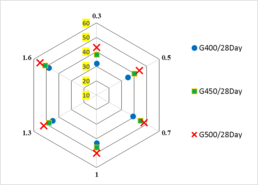
Slump of the concrete produced with grade 400 Kg/m: The changes in compressive strength against water to cement ratio in concrete samples with a grade of 400 kg/m and polycarboxylate superplasticizer is shown in Table 4, Figure 8, and Figure 9 (b). According to the results, with increasing the ratio of water to cement, the amount of compressive strength has decreased. Also, with the increase of water to cement ratio from 0.39 to 0.45, the final 28-day resistance value has reached from 48 MPa to 32 MPa, which was a decrease equal to 33%.
Slump of the concrete produced with grade 450 Kg/m: Based on the results, changes in compressive strength in concrete samples with a grade of 450 kg/m and polycarboxylate superplasticizer with increasing water to cement ratio has a decreasing trend (Table 4, Figure 8, and Figure 9 (c)). By increasing the water to cement ratio from 0.34 to 0.39, the final strength of 28 days has increased from 51 MPa to 38 MPa, which was a decrease of 25%.
Slump of the concrete produced with grade 500 Kg/m: Based on the results presented in Table 4, Figure 8 and Figure 9 (d), the changes in compressive strength in concrete samples with a grade of 500 kg/m and having polycarboxylate superplasticizer with increasing water to cement ratio was decreased. Also, by increasing in water to cement ratio from 0.3 to 0.35, the final 28-day resistance value for these samples has increased from 55 MPa to 43 MPa. Numerically, this decreasing trend was equal to 22%.
|
|
| (a) | (b) |

|
|
| (c) | (d) |
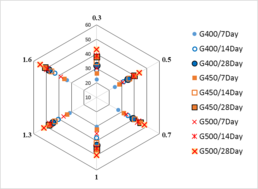
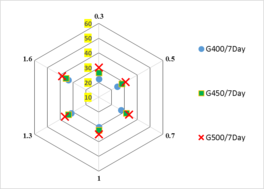
| Figure 9. Radar chart type distribution of the compressive resistance. (a) All samples in diagram. (b) 7 days compressive resistance. (c) 14 days resistance. (d) 28 days resistance | |
The results showed that by increasing the percentage of polycarboxylate superplasticizer, changes in compressive strength in concrete samples with different grades of cement the amount of compressive strength has increased, which can be due to the reduction of water to cement ratio. Also, increasing the cement grade has led to increasing the compressive strength of the samples. According to the results diagrams illustrated in Figure 8, in all levels of superplasticizer, by increasing cement grade the compressive strength increased. The samples with same carboxylate amount presented a compressive strength growing by concrete grade. Also, in the same cement grades the compressive strength increased by carboxylate percent. It can be proved by the results of Figure 9 (a), where the sample M18 with highest carboxylate and highest cement grade presented the compressive strength more than other samples in all carboxylate levels. Treating age caused improving the compressive strength. This is proved in Figure 9 (b,c,d), where the 7 days compressive strength was less than 40 MPa, the 14 days compressive strength was less than 50 MPa, and the 28 days compressive strength was less than 60 MPa.
3.4. Economical investigation of the prepared concretes
As an important principle, because of its abundant use and wide range of productivity, economic investigation of concrete production should be evaluate beside mechanical properties. To the best of our knowledge, there were less studies challenging the superplasticizer addition in concrete improvement from an economic point of view, except for cases related to the use of waste [27-29]. Therefore, in this study the economic aspect of the concrete production was evaluated. For this means, the production cost was calculated for the production of per m of concrete for all samples, and the results was shown in Tabla 5. In accordance with the results of Tabla 5, the lowest and highest price was observed for the sample M1 and M18 respectively, which had lowest and highest compressive resistance.
| Concrete Grade | M1,7,13 | M2,8,14 | M3,9,15 | M4,10,16 | M5,11,17 | M6,12,18 | |
|---|---|---|---|---|---|---|---|
| G-400 | Compressive strength | 32 | 35 | 39 | 43 | 45 | 48 |
| Cost (per m) | 6.47 | 6.78 | 7.09 | 7.55 | 8.02 | 8.49 | |
| G-450 | Compressive strength | 38 | 40 | 45 | 46 | 48 | 51 |
| Cost (per m) | 7.22 | 7.53 | 7.84 | 8.31 | 8.77 | 9.24 | |
| G-500 | Compressive strength | 43 | 44 | 48 | 50 | 52 | 55 |
| Cost (per m) | 7.97 | 8.28 | 8.59 | 9.06 | 9.52 | 10.34 | |
For the better understanding the price action in samples, two chart types are presented: the bar chart in the order of samples (Figure 10 (a)), and bar chart in the order of compressive strength (Figure 10 (b)). By taking a simple look at the Figure 10 (a) it can be realized that the production price increased with cement grades. Moreover, the production cost positively related to the superplasticizer percent. For the means of more detailed price analysis, in the Figure 10 (b) the production cost was ordered by compressive strength. As can be seen, in two compressive amounts (45 MPa, and 48 MPa) the price was differed from 7.84$ to 8.02 and from 8.49 to 8.77, respectively. As the content shows, this section is focusing on the economical evaluations. Accordingly, one purpose was to select a sample with economic justification. In the case of focusing on target by compressive strength equal to 45 MPa and 48 MPa, the samples M9 and M6 are recommended, respectively.

|
| (a) |

|
| (b) |
| Figure 10. Comparing of the product costs. (a) Considering the Sample number. (b) Considering the cost arrangement |
For a detailed understanding of the step-by-step impact of carboxylates on the samples price, the production costs is classified in three classes; 6-8$, 8-10$, and 10-12$ (Figure 11). As it illustrated in Figure 10, all G-400, and G-450 samples was classified in 6-8$, and 8-10$. Samples with cement grade of 400 except M6 were low than 8$, and the samples with cement grade of 500 were low than 10$ except M18. In according with these results, M18 had lower economic justification among the samples.

|
| Figure 11. Comparing of the product costs versus the percent of carboxylate used in concrete. (Carboxylate is used in 6 levels: 0.3, 0.5, 0.7, 1, 1.3, and 1.6) |
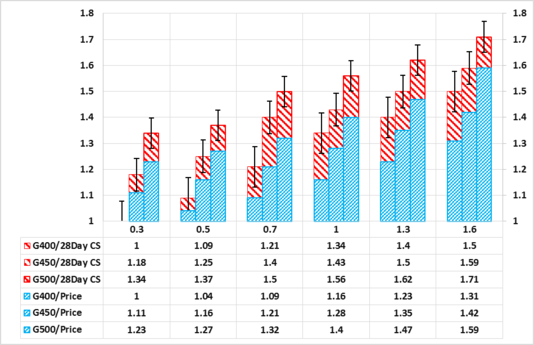
In the last section direct increment in the price was evaluated. For comparative investigation of the compressive strength enhancing price, new factor was introduced; relative compressive strength, and relative price. Also the results obtained for sample M1 was considered as the base for calculating the relative amounts of both compressive strength and price. As it shown in Figure 12, the relative price growth among all samples was 0.6 and the relative compressive strength growth among all was 0.7. For the samples with and with more than 0.7 superplasticizer, the relative price growth was almost equal to the relative compressive strength growth. Percentage growth of the compressive strength against the percentage price along the superplasticizer amount was displayed different outcome in three cement grades (Figure 13). The percent price increasing in G-500 was same as the percent compressive strength increases. Conversely, the percent compressive strength increasing in G-400 was 1.6 times higher than the percent cost increases. Therefore, it can be seen that the efficiency of increasing superplasticizer in improving the compressive strength in G-400 samples was higher than the same condition in G-500 samples.
|
| Figure 12. Investigating of two parametrical concrete cost; 28 days strength of concrete samples and the related costs |

|
| Figure 13. Economic comparison of the percentage increase in compressive strength against the percentage increase in price |
In summary, according to the economic comparison charts (Figures 10-13), the percentage of increase in compressive strength against the percentage of price increase showed that the best performance has occurred for concrete with a grade of 400 kg/m and the ratio of increase in compressive strength to price increase in this case was 1.6. The same parameter value was equal to 1.22 and 1.05 respectively for 450 kg/m and 500 kg/m concrete (Table 5). This proves that with the increase in cement grade in concrete, the economic justification for using polycarboxylate superplasticizer becomes ineffective.
4. Conclusions
The results of X-ray fluorescence analysis showed that the slag contained high amounts of silica, calcium oxide and aluminum oxide, indicating that iron ore could play an important role in pozzolanic reactions and improve the quality of concrete. The results for fly ash showed that the amounts of these chemical compounds was different. In the fly ash, despite the presence of high silica oxide, there were small amounts of calcium oxide and aluminum. By increasing the water to cement ratio, the slump rate of the samples decreased in all grades. In general, the slump number in G-500 samples were less than those of in G-450 and G 400 samples. The effect of the water to cement ratio in the size of the resulting slump was higher than the grades effect. As the percentage of new synthesized polycarboxylate superplasticizer increased, the slump number of the samples also increased in all three grades. At G-400 samples, the slump increased with a steeper slope than the other two grades. The results of compressive strength analysis in all three grades showed that the pressure resistance increased with decreasing water to cement ratio and increasing carboxylate percentage. Also, with increasing the grade of cement, the amount of resistance increased. New synthesized superplasticizer percentage also had a positive effect on the resistance obtained in all three grades. So that the overall slope of the compressive strength changes in all three grades were positive. According to the economic evaluation, the highest cost was related to the G-500 samples. On the other hand, the slope of changes in production costs versus the suoerplastisizer percent were constant in all three grades. The percentage of price increase in the samples was 25, 28 and 31 in 500, 450 and 400 grades, respectively. In contrast, the percentage of increase in compressive strength were 28, 34 and 50%, respectively. These results indicated the economic viability of increasing the resistance of concrete to additives and new synthesized polycarboxylate. The present study was investigated in the compressive resistance properties of concrete produced by new synthesized supeplastisizer. So it is recommended that the next works is better to focus on investing the other features of concretes (resistance in chemical condition and corrosion) produced by using the same suoerplastisizer.
References
[1] Kuban S. Building frames-aspects of the development of reinforced concrete in Berlin. Informes de la Construcción, 71(553):284-291, 2019.
[2] Argirova G., Ruiz M.F., Muttoni A. How simple can nonlinear finite element modelling be for structural concrete?. Informes de la Construcción, 66(1):10-3989, 2014.
[3] Zandi Y., Öztürk N., Öztürk H.T., Durmuş A. Study of utilization in cement of activated drinking water treatment sludge at various temperatures. Advances in Environmental Biology, 6(11):2958-2965, 2012.
[4] Zandi Y. Durability evaluation of concrete made of fly ash and copper slag. Pollack Periodica, 61(2):412-425, 2021.
[5] Zandi Y., Abedi M. Evaluation of the effect of magnetic water on the durability of concrete made of cast iron slag. Journal of Structural and Construction Engineering, 6(7):14-27, (2020).
[6] Zandi Y., Rezaei A. Evaluation of the effect of fly ash and zeolite powder and glass fiber on flexural behavior of structural lightweight beams made of Scoria. Journal of Structural and Construction Engineering, 7(2):51-64, 2020.
[7] Zandi Y., Alayi M. Effect of comparison of Ardabil Pozzuoli cement and type 2 Sufyan cement compressive strength viewpoints and improvement solutions. Journal of Structural and Construction Engineering, 6(4):95-110, 2019.
[8] Smirnova O. Compatibility of shungisite microfillers with polycarboxylate admixtures in cement compositions. ARPN Journal of Engineering and Applied Sciences, 14(3):600-610, 2019.
[9] Adesanya E., Perumal P., Luukkonen T., Yliniemi J., Ohenoja K., Kinnunen P., Illikainen M. Opportunities to improve sustainability of alkali activated materials: Review of side-stream based activators. Journal of Cleaner Production, 286:125558, 2020.
[10] Zhang P., Gao Z., Wang J., Guo J., Hu S., Ling Y. Properties of fresh and hardened fly ash/slag based geopolymer concrete: A review. Journal of Cleaner Production, 270:122389, 2020.
[11] Akhlaghi O., Menceloglu Y.Z., Akbulut O. Poly (carboxylate ether)-based superplasticizer achieves workability retention in calcium aluminate cement. Scientific Reports, 7(1):1-7, 2017.
[12] Huseien G.F., Joudah Z.H., Khalid N.H.A., Sam A.R.M., Tahir M.M., Lim N.H.A.S., Mirza J. Durability performance of modified concrete incorporating fly ash and effective microorganism. Construction and Building Materials, 267:120947, 2021.
[13] Parathi S., Nagarajan P., Pallikkara S.A. Ecofriendly geopolymer concrete: a comprehensive review. Clean Technologies and Environmental Policy, 21:1-13, 2021.
[14] Arel H.Ş., Aydin E. Use of industrial and agricultural wastes in construction concrete. ACI Materials Journal, 115(1):55-64, 2018.
[15] Hooton R.D. Future directions for design, specification, testing, and construction of durable concrete structures. Cement and Concrete Research, 124:105827, 2019.
[16] Li C., Wu M., Chen Q., Jiang Z. Chemical and mineralogical alterations of concrete subjected to chemical attacks in complex underground tunnel environments during 20–36 years. Cement and Concrete Composites, 86:139-159, 2018.
[17] Zandi Y., Karaca Z., Durmus A., Dogangün A., Durmus A. Investigating the comparative analysis of cylindrical silos subjected to earthquake by analytical and numerical methods. Trends in Applied Sciences Research, 7(6):407-416, 2012.
[18] Talipov L., Velichko E. Polymer additives for cement systems based on polycarboxylate ethers. In Energy Management of Municipal Transportation Facilities and Transport, Springer, Cham, 939-946, 2018.
[19] Tajbakhshian A., Saeb M.R., Jafari S.H., Najafi F., Khonakdar H.A., Ayoubi M., Asl F.H. High-performance carboxylate superplasticizers for concretes: Interplay between the polymerization temperature and properties. Journal of Applied Polymer Science, 134(23):1-9, 2017.
[20] Pang X., Kong X., Liu X., Hao T. The dispersing performances of polycarboxylate superplasticizer in cement pastes prepared with deionized water and seawater. Materials and Structures, 54(2):1-16, 2021.
[21] Abile R., Russo A., Limone C., Montagnaro F. Impact of the charge density on the behaviour of polycarboxylate ethers as cement dispersants. Construction and Building Materials, 180:477-490, 2018.
[22] Gökçe M. Determining the physical properties of polymer in different admixtures used for self-compacting cement paste by ESEM. Micron, 139:102953, 2020.
[23] Zandi Y., Akpinar M.V. Evaluation of internal resistance in asphalt concretes. International Journal of Concrete Structures and Materials, 6(4):247-250, 2012.
[24] Xu G.Z., Feng Z.Y., Yin J., Han W.X., Ahmed S., Miao Y.H. Effect of salinity on rheological behavior of cement-treated dredged clays as fills. Journal of Materials in Civil Engineering, 32(9):04020269, 2020.
[25] Shenoy A.D., Ravindra R., Satyanarayana S. Effect of rain tree pod extract as plasticizer on properties of concrete. Materials Today: Proceedings, 46(10):5182-5186, 2021.
[26] Wang H., Du T., Zhang A., Cao P., Zhang L., Gao X., He Z. Relationship between electrical resistance and rheological parameters of fresh cement slurry. Construction and Building Materials, 256:119479, 2020.
[27] Limantara A.D., Suyono J., Subiyanto B. Economic model of concrete incorporating with bamboo, coconut fiber, coconut shell, and bio-enzym. Cahaya Aktiva, 10(1):113-128, 2020.
[28] Singh M., Choudhary K., Srivastava A., Sangwan K.S., Bhunia D. A study on environmental and economic impacts of using waste marble powder in concrete. Journal of Building Engineering, 13:87-95, 2017.
[29] Khodabakhshian A., De Brito J., Ghalehnovi M., Shamsabadi E.A. Mechanical, environmental and economic performance of structural concrete containing silica fume and marble industry waste powder. Construction and Building Materials, 169:237-251, 2018.Document information
Published on 01/02/22
Accepted on 27/01/22
Submitted on 10/09/21
Volume 38, Issue 1, 2022
DOI: 10.23967/j.rimni.2022.02.001
Licence: CC BY-NC-SA license
Share this document
Keywords
claim authorship
Are you one of the authors of this document?