1 Introduction
Carbon fiber reinforced polymers (CFRP) are being increasingly used in many fields, including aeronautics and automotive among others. Their good properties in terms of ligth weight, high strength, high stiffness and fatigue resistance among others made them an optimum option where high performance is required, mainly due to the good properties of carbon fibers (CF) [1].
The desire of improving the already good properties of CFRP induces the investigation of new material modifications. Surface treatments are one of the possible strategies to improve composite properties, mainly from the mechanical point of view of load transmission. In particular, CF composites are a challenge due to the non-polar characteristics and chemical inertness of carbon [2]. To improve the load transmission between matrix and fibers several techniques have been investigated. Surface treatments are divided into oxidative, non-oxidative and plasma treatments [3]. The oxidative techniques can be classified into gas-phase, liquid-phase (wet chemical or electrochemical) and catalytic methods. Non-oxidative techniques imply the deposition of active forms of carbon.
Computational analysis of CFRPs allows predicting the composite behavior while reducing experimental work. Representative volume elements (RVE) are used in Finite Element (FE) analysis to reproduce periodic composite structures and to estimate global properties of composites. Homogenization allows to obtain effective properties from a material description at microscopic level to apply them at the macroscopic level. To obtain homogenized properties of CFRPs periodic boundary conditions (PBC) are frequently used [4, 5]. For example, Garoz et al. [4] studied extendedly the application of PBC with different implementations including implicit and explicit methods for predicting damage in composites.
In this work the improvement of mechanical properties of polymer composite materials achieved throught enhancements of the CF/epoxy interphases is analyzed. Finite element models of RVE of unidirectional (UD) carbon fiber epoxy matrix materials have been used to estimate composite mechanical properties. First, a sensibility analysis of the effect of the interphase thickness and its mechanical characteristics on the elastic properties of the UD composite is performed. To obtain the homogenized properties of the RVE, periodic conditions and six load cases (three normal and three shear) are applied. Then, a model that accounts for the matrix and the fibers is used to characterize the linear elastic behaviour of the composite applying the same approach. Second, the CF-matrix interphase is added considering different superficial treatments/conditions. Cohesive elements are used to simulate the strength properties of the interphases and the overall strength of the material is evaluated considering four failure criteria. Combining both analyses the complete mechanical behavior of the UD-CFRP can be chatacterized.
2 Materials and models
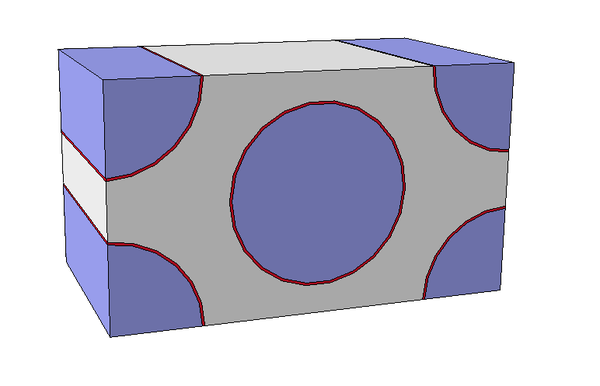
A Finite Element model of a Representative Volume Element for a UD composite with hexagonally arrayed fibers has been studied in this work.
Several volumetric fractions (VF) of the fibers in relation to the RVE total volume have been studied. The required parameters to define the RVE were the volumetric fraction of fibers and their diameter (Øfib). The RVE length (L), height (H) and depth (D) are calculated depending on the fiber diameter and the volumetric fraction of fibers (Figure 1). Moreover the interphase thickness (thif) was also fixed during the modeling process. The RVE geometry was generated in Abaqus/CAE (Simulia, 2016) [6] divided in three parts, one for each phase, and merged creating a new part in which the nodes are shared. After that, material properties of each phase and boundary conditions are defined. A volumetric fraction of 0.5 was used for the first interphase sensibility analysis. Then, in the estimation of the RVE homogenized properties, two volumetric fractions of carbon fibers (0.6 and 0.885) have been studied. The first value has been selected to be representative of the volume fraction achievable in prepregs or RTM UD composites. The later value has been chosen as the one that allows obtaining the highest global volume fraction of CF through a hexagonal closed package arrangement of CFs but ensuring that there is no contact between the fibers (including the interphases), that can be used for example to define the behavior of yarns in fabric reinforced composites.
2.1 Materials.
The polymer matrix is simulated as an elasto-plastic material in which a maximum stress equal to 80 MPa has been considered taking into account information found in the literature for this resin [7] [8]. The values of its elastic parameters are included in Table 1.
| Ematrix (GPa) | νmatrix |
| 3.35 | 0.35 |
The carbon fibers (CFs) behavior was defined as transversely isotropic (orthotropic) through the engineering constants based on values reported in the literature [9] [10]. The three elastic moduli E1, E2 and E3, the Poisson’s ratios ν12, ν13 and ν23 and the shear moduli G12, G13 and G23 are defined according to the orientation shown in Figure 1.
| E1 (GPa) | E2 = E3 (GPa) | ν12 = ν13 | ν23 | G12 = G13 (GPa) | G23 (GPa) | Density (g/cm3) |
| 240 | 15 | 0.2 | 0.25 | 15 | 6 | 1.77 |
First, a sensitivity analysis of the interphase’s thickness and properties was done for a VF=0.5. Five interphase thicknesses (50, 100, 200, 1000 and 10000Å) and two elastic moduli (35 and 80 GPa) were analyzed and compared with a model without interphase. The first values have been chosen trying to cover a wide range of possible thicknesses. The values proposed for the elastic modulus have been selected taking into account that comparing with the ones of the pure resin higher properties could be expected for the CF/polymer interphase through the superficial treatments. Then, this analysis allows to study what effects could be expected in the composite elastic properties if high interphase elastic properties are obtained with some of the techniques mentioned.
For the strength predictions RVE with VF=0.6 and VF=0.885 were analyzed. Considering the results obtained from the elastic sensibility analysis, the elastic constants for this VF were calculated without interphase. For the strength predictions the interphase between the polymer and the fibers is modelled using cohesive elements to reproduce each superficial treatment, which allows defining the resistance of the interphase in terms of fracture energies and maximum stresses (assuming a bi-linear constitutive law). The fibers were analyzed without treatment (as received, AR) and with two different treatments, PMAA (Electropolymerization with methacrylic acid) and ASP2 (Active screen plasma treatment with Ar+H2). The cohesive parameters for each surface treatment have been obtained from CF push-out tests that have been treated through a numerical/experimental method defined and implemented in MODCOMP (Table 3).
Table 3. Fracture energies and maximum stresses of the cohesive models used to simulate the interphase with several superficial treatments
| Treatment | GIc (N/mm) | GIIc (N/mm) | Sn (Mpa) | St (Mpa) |
| AR | 0.019 | 0.0379 | 46.56 | 65.85 |
| ASP2 | 0.0124 | 0.0249 | 48.52 | 68.62 |
| PMAA | 0.0262 | 0.0524 | 66.57 | 94.15 |
2.2 Loads and boundary conditions
Periodic boundary conditions were imposed to the RVE to guarantee that it is representative of a higher volume. Boundary conditions can be manually implemented or introduced by the micromechanics plug-in for Abaqus [11]. The plug-in imposes a relationship on the boundary nodes of the RVE through the use of equation constraints. A reference node in which the load is applied is defined and parallel faces of the RVE are related to the load through the equations. Periodic boundary conditions require nodes to be positioned periodically to impose the periodic equations.
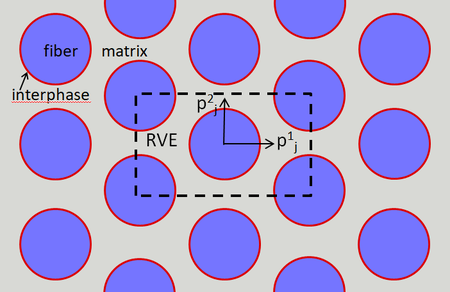
A solution field, φ, with periodic response exhibits the form presented in Equation (1)
where is the coordinate, is the vector of periodicity (Figure 2), and is the far-field gradient of the solution field (in this case, the far-field displacement gradient).
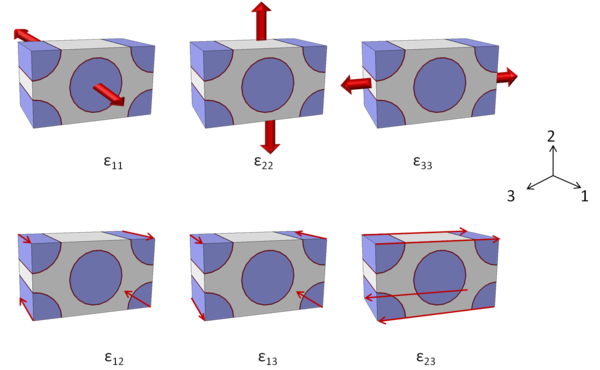
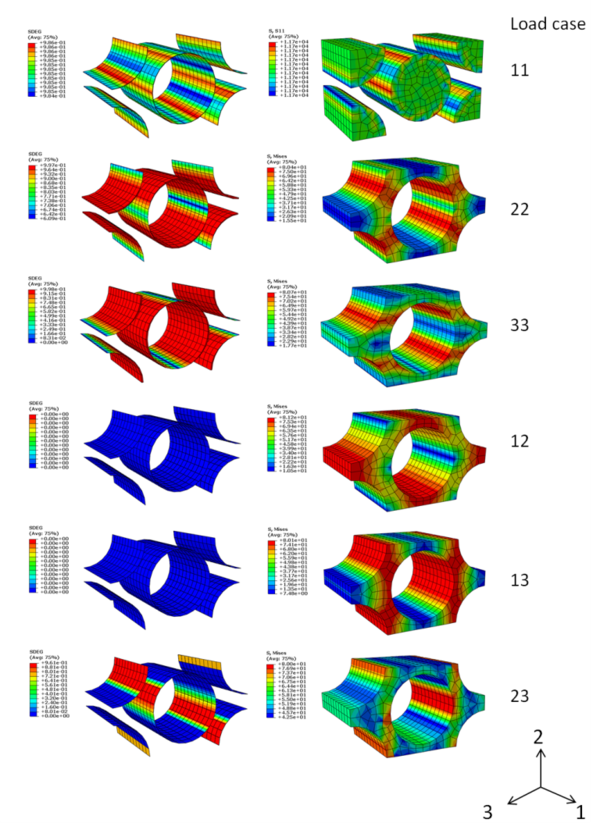
Loads are defined using six load cases corresponding to six imposed deformation modes, according to the normal and shear directions (Figure 3). After that, the analysis was solved with Abaqus Standard. The six load cases (normal and shear) ran one after another so the complete range of deformations was covered.
2.3 Elasticity and strength analyses
To estimate the equivalent mechanical properties of the RVE composite it is necessary to perform a homogenization analysis.
The homogenized elastic properties of the composite were obtained using the Micromechanics Plug-in for Abaqus/CAE.
The homogenization process had three steps. In the first step, the model was set up and the loads and boundary conditions were defined using the Micromechanics Plug-in.
In the second step, the mechanical properties of the material systems selected for modeling in Section 2.1 have been studied with two different objectives: i) determination of the elastic behavior (full set of engineering constants) and ii) obtain reference values in terms of strengths (normal directions and shear).
The last step consisted on the post-processing of the results with the Micromechanics Plug-in to obtain the homogenized material response. It is possible to select the desired material type that better suits the homogenized material. In the analysis here presented the composite material has been considered orthotropic (transversely isotropic) defined by the Engineering Constants, which imply the estimation of E1, E2, E3, ν12, ν13, ν23, G12, G13, G23.
In the analysis of the elastic properties the estimation of the engineering constants is automatically performed by the Micromechanics Plugin.
In the strength analysis of the CF UD arrangement, the interphase between the matrix and the fibers has been simulated with cohesive elements, allowing investigating the influence of different surface treatments studied in MODCOMP. To estimate some strength parameters four different failure mechanisms were defined and when one of them appears it is considered that the material has failed. First, matrix failure is considered when the Von Mises stress reaches the limit tensile strength. Second, damage in the cohesive elements of the interphase is evaluated through Abaqus variable SDEG and when a value of 1 is reached complete failure is considered. Additionally, interphase failure is also evaluated representing the force-displacement curve of the RVE, so when it begins to decrease it is considered that the resistance of the material is decreasing and the material has begun to fail. Finally, fiber failure is evaluated through the fiber strength in the fiber direction. It is considered that a fiber fails when the tensile stress in the fiber direction is higher than its limit (4100MPa) [10]. To find the failure mechanism each load case was individually analyzed as the Micromechanics plug-in do not analyze failure. It must be considered that the models developed do not consider damage processes in the fibers, so the numerical predictions should be considered as reference strength values that allow comparing the effect of the surface treatments analyzed.
3 Results and discussion
3.1 Elastic properties
As mentioned, the elastic properties of the composites were estimated using the Post-processing homogenization module of the Micromechanics Plug-in for Abaqus/CAE previously introduced.
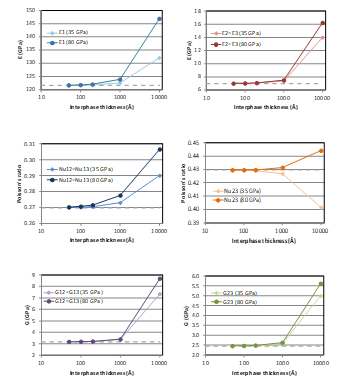
First a sensibility analysis of the interphase thickness and elastic properties was performed. The engineering constants of the RVE were estimated considering five different interphase thicknesses (50, 100,200, 1000 and 10000 Å) and two elastic moduli (35 and 80 GPa), resulting into ten study cases. The results were compared with a reference case that corresponds to a RVE without interphase (Figure 4). It is observed that the thickness effect is not appreciable when the interphase is thin (thif ≤ 0,1µm (1000 Å), which corresponds to an interphase VF ≤ 0.029) independently of the elastic modulus of the interphase. No relevant differences are found for small thicknesses due to the small VF of the interphase in the RVE. For thicker interphases (thif > 0.1µm) the VF of the interphase increases and its contribution to the RVE homogenized properties is more notable. Nevertheless, the superficial treatments studied in this work offered values generally below this limit.
Although this analysis was made for a carbon fiber VF=0.5 the same trend should be followed for other VF.
Then, taking into account the previous results, the effect of the volumetric fraction of carbon fibers in the RVE was studied for two different VF (0.6 and 0.885) without interphase.
The engineering constants that define the homogenized material are presented in Table 4.
It can be observed that the elastic modulus varies proportionally to the fiber VF as expected. Shear modulus increases highly when the VF is increased while the Poisson’s ratios decrease.
| VF | E1 (GPa) | E2 (GPa) | E3 (GPa) | ν12 | ν13 | ν23 | G12 (GPa) | G13 (GPa) | G23 (GPa) | Density (gr/cm3) |
| 0.6 | 145.283 | 7.821 | 7.816 | 0.255 | 0.255 | 0.401 | 3.818 | 3.817 | 2.790 | 1.582 |
| 0.885 | 212.684 | 12.300 | 12.286 | 0.214 | 0.214 | 0.301 | 9.773 | 9.769 | 4.724 | 1.716 |
3.2 Strength properties
As in the elastic analyses, six load cases have been studied for each material. Nevertheless, the post-processing of the results in the strength analyses is done case by case due to the failure mechanism must be particularly identified/determined. The strengths predicted for VF=0.6 and VF=0.885 for the different surface treatments studied are included in
Table 5. The failure modes are also identified.
As indicated, the normal strengths reported are for tensile loads (-t). The strengths in compression are usually different and have not been analyzed with these models. In most cases material failure is due to the damage of the matrix. Nevertheless, when the load is applied in the fiber direction rupture is due to fiber failure. In this case improvements of approx. 25% and 30% are observed for the transverse strengths (S22-tand S33-t) for the PMAA treatment. For the shear strengths S12and S13the influence is less notorious. The effect in the strength in the fiber direction (S11) is almost negligible for this treatment. On the other hand, no relevant improvement of properties is observed for the ASP2 treatment.
The strength of the UD arrangement with a VF of 0.885 and the elastic-plastic material properties has been also analyzed for the three surface treatments (Table 5).
| VF =0.6 | VF = 0.885 | ||||
| Surface treatment | Component | Failure mode | Strength (MPa) | Failure mode | Strength (MPa) |
| AR (as received)
|
S11 | Smax fiber | 2442.030 | Smax fiber | 3624.38 |
| S22-t = S33-t | Smax matrix | 62.663 | Smax matrix | 53.731 | |
| S12 = S13 | Smax matrix | 85.627 | Smax matrix | 60.675 | |
| S23 | Smax matrix | 77.462 | Smax matrix | 76.619 | |
| ASP2
|
S11 | Smax fiber | 2442.734 | Smax fiber | 3619.57 |
| S22-t = S33-t | Interphase failure | 60.867 | Interphase failure | 55.557 | |
| S12= S13 | Smax matrix | 85.627 | Smax matrix | 60.397 | |
| S23 | Smax matrix | 78.012 | Smax matrix | 77 | |
| PMAA | S11 | Smax fiber | 2446.885 | Smax fiber | 3624.38 |
| S22-t = S33-t | Smax matrix | 81.277 | Smax matrix | 75.230 | |
| S12= S13 | Smax matrix | 87.659 | Smax matrix | 61.650 | |
| S23 | Smax matrix | 83.052 | Smax matrix | 76.234 | |
In this case an improvement of approx. 40% is observed for the transverse strengths (S22-tand S33-t) for the PMAA treatment. No significant improvements are observed in the other strengths. Again, no relevant improvement of properties is observed for the ASP2 treatment. In most cases failure is due to the maximum stress reached in the matrix and not in the interphase. It has been observed that in some cases the maximum force in the material is reached before the matrix failure.
It must be taken into account the relationship between interphase degradation and the stresses distribution in the failure moment. In Figure 5 it is seen that the matrix zones with higher stress correspond to the paths between the most degraded interphases zones. Moreover, in the first load case when load is applied in the fiber direction and failure is first found on the fibers, it is seen that the damaged in the interphase is homogeneous as the load is applied in the longitudinal direction and the section is evenly loaded.
4 Conclusions
A complete methodology to characterize the mechanical properties of CF polymer matrix composites has been presented in this work. Different superficial treatments have been analyzed in order to determine the strength of the composite in function of the CF-matrix interphase. The strength of each modified CF surface has been modeled using cohesive elements. The elastic properties were evaluated using a unique model without including the interphase. This assumption can be made within a range of interphase’s thicknesses as found in the sensibility analysis performed. It showed that the interphase’s elastic properties are not highly relevant for thin interphases when the corresponding VF of the interphase is very small.
The strength of the composite with each superficial treatment was evaluated according to different failure mechanisms: failure of the matrix, failure of the fibres and failure of the interphase. Two superficial treatments were applied which was translated into different cohesive properties in the finite element model. It is observed that in most cases the material failure is due to the damage of the matrix although it is conditioned by the interphase failure. Conversely, when the load is applied in the fiber direction, the failure is due to fiber failure.
Acknowledgements
This work has partially received funding from the European Union’s Horizon 2020 Research and Innovation Programme MODCOMP under grant agreement No. 685844.
ITAINNOVA acknowledge MODCOMP project partners dealing with the carbon fiber treatments and their characterization that have given the experimental data that allowed adjusting the parameters needed to feed the models presented, particularly Prof. Hashan Dong and Xiaoying Li.
References
[1] B. A. Newcomb, “Processing, structure, and properties of carbon fibers,” Compos. Part A Appl. Sci. Manuf., vol. 91, pp. 262–282, 2016.
[2] D. Semitekolos, P. Kainourgios, C. Jones, A. Rana, E. P. Koumoulos, and C. A. Charitidis, “Advanced carbon fi bre composites via poly methacrylic acid surface treatment ; surface analysis and mechanical properties investigation,” Compos. Part B, vol. 155, no. August, pp. 237–243, 2018.
[3] S. Tiwari and J. Bijwe, “Surface Treatment of Carbon Fibers - A Review,” Procedia Technol., vol. 14, pp. 505–512, 2014.
[4] D. Garoz et al., “Consistent application of periodic boundary conditions in implicit and explicit finite element simulations of damage in composites,” Compos. Part B, vol. 168, no. November 2018, pp. 254–266, 2019.
[5] S. Sádaba, M. Herráez, F. Naya, C. González, J. Llorca, and C. S. Lopes, “Special-purpose elements to impose Periodic Boundary Conditions for multiscale computational homogenization of composite materials with the explicit Finite Element Method,” Compos. Struct., vol. 208, no. August 2018, pp. 434–441, 2019.
[6] Simulia, Abaqus 2016 Online Documentation. Dassault Systèmes.
[7] N. K. Naik, P. J. Shankar, V. R. Kavala, G. Ravikumar, J. R. Pothnis, and H. Arya, “High strain rate mechanical behavior of epoxy under compressive loading: Experimental and modeling studies,” Mater. Sci. Eng. A, vol. 528, no. 3, pp. 846–854, 2011.
[8] P. D. Soden, M. J. Hinton, and A. S. Kaddour, “LAMINA PROPERTIES , LAY-UP CONFIGURATIONS AND LOADING CONDITIONS FOR A RANGE OF FIBRE-REINFORCED COMPOSITE LAMINATES,” vol. 58, 1998.
[9] M. W. E. Toledo, L. G. Nallim, and B. M. Luccioni, “A micro-macromechanical approach for composite laminates,” Mech. Mater., vol. 40, no. 11, pp. 885–906, 2008.
[10] “Product Data Sheet ( EU ),” 2017.
[11] F. A. Cae, “Micromechanics Plugin,” 2017.
Document information
Published on 14/07/22
Accepted on 14/07/22
Submitted on 14/07/22
Volume 04 - Comunicaciones Matcomp19 (2020), Issue Núm. 4 - Aplicaciones de los materiales compuestos. Nuevos procesos de fabricación y materiales compuestos avanzados., 2022
DOI: 10.23967/r.matcomp.2022.07.033
Licence: Other
Share this document
Keywords
claim authorship
Are you one of the authors of this document?
