m (Cinmemj moved page Frontera et al 2020a to Frontera et al 2020b) |
|||
| (19 intermediate revisions by the same user not shown) | |||
| Line 291: | Line 291: | ||
<div id='img-1.3'></div> | <div id='img-1.3'></div> | ||
{| class="floating_imageSCP" style="text-align: center; border: 1px solid #BBB; margin: 1em auto; width: auto;max-width: auto;" | {| class="floating_imageSCP" style="text-align: center; border: 1px solid #BBB; margin: 1em auto; width: auto;max-width: auto;" | ||
| − | |-style="padding:10px;" | + | |- |
| − | |[[Image:Draft_Samper_691820313-monograph-Campbell_example.png|450px|]] | + | |style="padding:10px;"| [[Image:Draft_Samper_691820313-monograph-Campbell_example.png|450px|]] |
|- style="text-align: center; font-size: 75%;" | |- style="text-align: center; font-size: 75%;" | ||
| − | | colspan="1" | '''Figure 1.3:''' Example of Campbell diagram <span id='citeF-6'></span>[[#cite-6|[6]]] | + | | colspan="1" style="padding-bottom:10px;" | '''Figure 1.3:''' Example of Campbell diagram <span id='citeF-6'></span>[[#cite-6|[6]]] |
|} | |} | ||
| Line 300: | Line 300: | ||
To illustrate a little bit this section, Figure [[#img-1.3|1.3]] shows the Campbell diagram of a compressor rotor blade. Bold curves represent natural frequencies of the structure, while the straight lines show the exciting frequencies. Each intersection between them is a resonance point. Here, rotation introduces an '''stiffening''' effect: natural frequencies increase with the spin speed. | To illustrate a little bit this section, Figure [[#img-1.3|1.3]] shows the Campbell diagram of a compressor rotor blade. Bold curves represent natural frequencies of the structure, while the straight lines show the exciting frequencies. Each intersection between them is a resonance point. Here, rotation introduces an '''stiffening''' effect: natural frequencies increase with the spin speed. | ||
| − | It is important to remember that the concept of critical speeds and the Campbell diagram only apply to linear systems, although a more arbitrary definition of these speeds can be used in the case of nonlinear systems, referring the speed at which greater amplitudes are found. | + | It is important to remember that the concept of critical speeds and the Campbell diagram only apply to linear systems, although a more arbitrary definition of these speeds can be used in the case of nonlinear systems, referring the speed at which greater amplitudes are found. |
====Frequency and time domains==== | ====Frequency and time domains==== | ||
| Line 2,756: | Line 2,756: | ||
{| class="floating_imageSCP" style="text-align: center; border: 1px solid #BBB; margin: 1em auto; width: auto;" | {| class="floating_imageSCP" style="text-align: center; border: 1px solid #BBB; margin: 1em auto; width: auto;" | ||
|- | |- | ||
| − | + | |[[Image:Draft_Samper_691820313-monograph-campbellnew.png|588px|Campbell diagram: comparison between modal prediction and SVD results.]] | |
|- style="text-align: center; font-size: 75%;" | |- style="text-align: center; font-size: 75%;" | ||
| − | | colspan="1" style="padding:10px;"| '''Figure 6.2:''' Campbell diagram: comparison between modal prediction and SVD results. | + | | colspan="1" style="padding-bottom:10px;"| '''Figure 6.2:''' Campbell diagram: comparison between modal prediction and SVD results. |
|} | |} | ||
| Line 2,764: | Line 2,764: | ||
Recall that the obtained results shown in [[#D.1.2 Constant angular velocity|D.1.2]] are just '''predominant''' patterns of the dynamic response. Thus, the RSVs representing reigning vibrations are no longer pure harmonics, but mostly the result of a certain combination of natural frequencies. In most cases, they match almost perfectly to a sine or cosine function, and hence the predominant frequency is easy to determine. That is not the case of the RSVs associated to axial vibrations (natural modes 2 and 7 from Figure [[#D.1.1 Natural modes and frequencies|D.1.1]]), which are the result of more than one predominant frequency. For instance, the pure axial motion has a <math display="inline">0</math> Hz frequency associated to it, caused by the offset in displacements the centrifugal force induces. To visualise the frequencies involved in the vibration phenomena, Figure [[#img-D.11|D.11]] displays the '''power spectral density''' estimation of the sum of the right side vectors. | Recall that the obtained results shown in [[#D.1.2 Constant angular velocity|D.1.2]] are just '''predominant''' patterns of the dynamic response. Thus, the RSVs representing reigning vibrations are no longer pure harmonics, but mostly the result of a certain combination of natural frequencies. In most cases, they match almost perfectly to a sine or cosine function, and hence the predominant frequency is easy to determine. That is not the case of the RSVs associated to axial vibrations (natural modes 2 and 7 from Figure [[#D.1.1 Natural modes and frequencies|D.1.1]]), which are the result of more than one predominant frequency. For instance, the pure axial motion has a <math display="inline">0</math> Hz frequency associated to it, caused by the offset in displacements the centrifugal force induces. To visualise the frequencies involved in the vibration phenomena, Figure [[#img-D.11|D.11]] displays the '''power spectral density''' estimation of the sum of the right side vectors. | ||
| − | |||
====Singular values==== | ====Singular values==== | ||
| Line 4,292: | Line 4,291: | ||
<div id='img-D.8'></div> | <div id='img-D.8'></div> | ||
| − | {| class="floating_imageSCP" style="text-align: center; border: 1px solid #BBB; margin: 1em auto; width: | + | {| class="floating_imageSCP" style="text-align: center; border: 1px solid #BBB; margin: 1em auto; width: 60%;" |
|- | |- | ||
|style="padding:10px;"|[[Image:Draft_Samper_691820313-monograph-nsv_freq.png|400px|Mode intensities for increasing values of Ω]] | |style="padding:10px;"|[[Image:Draft_Samper_691820313-monograph-nsv_freq.png|400px|Mode intensities for increasing values of Ω]] | ||
| Line 4,300: | Line 4,299: | ||
<div id='img-D.9'></div> | <div id='img-D.9'></div> | ||
| − | {| class="floating_imageSCP" style="text-align: center; border: 1px solid #BBB; margin: 1em auto; width: | + | {| class="floating_imageSCP" style="text-align: center; border: 1px solid #BBB; margin: 1em auto; width: 60%;" |
|- | |- | ||
|style="padding:10px;"| [[Image:Draft_Samper_691820313-monograph-React_comparison.png|400px|Reaction torque for increasing values of Ω]] | |style="padding:10px;"| [[Image:Draft_Samper_691820313-monograph-React_comparison.png|400px|Reaction torque for increasing values of Ω]] | ||
| Line 4,308: | Line 4,307: | ||
<div id='img-D.10'></div> | <div id='img-D.10'></div> | ||
| − | {| class="floating_imageSCP" style="text-align: center; border: 1px solid #BBB; margin: 1em auto; width: | + | {| class="floating_imageSCP" style="text-align: center; border: 1px solid #BBB; margin: 1em auto; width: 60%;" |
|- | |- | ||
| − | |style="padding:10px;" | [[ | + | |style="padding:10px;" |[[File:Draft_Samper_691820313_8123_ydisp.png|800px]] |
|- style="text-align: center; font-size: 75%;" | |- style="text-align: center; font-size: 75%;" | ||
| colspan="1" style="padding:10px;" | '''Figure D.10:''' Local transverse displacements at the tip of the beam for different values of <math>\Omega </math>. Numeric results and its SVD approximation are compared. | | colspan="1" style="padding:10px;" | '''Figure D.10:''' Local transverse displacements at the tip of the beam for different values of <math>\Omega </math>. Numeric results and its SVD approximation are compared. | ||
| Line 4,557: | Line 4,556: | ||
|style="padding:10px;"|[[Image:Draft_Samper_691820313-monograph-ydisp3d.png|420px|Temporal evolution of ϱ displacements at the tip of a cantilever beam under constant angular velocity.]] | |style="padding:10px;"|[[Image:Draft_Samper_691820313-monograph-ydisp3d.png|420px|Temporal evolution of ϱ displacements at the tip of a cantilever beam under constant angular velocity.]] | ||
|- style="text-align: center; font-size: 75%;" | |- style="text-align: center; font-size: 75%;" | ||
| − | | colspan="1" style="padding-bottom:10px;"| '''Figure D.30:''' Temporal evolution of <math>\varrho </math> displacements at the tip of a cantilever beam under constant angular velocity. | + | | colspan="1" style="padding-bottom:10px;padding-left:10px;padding-rigth:10px;"| '''Figure D.30:''' Temporal evolution of <math>\varrho </math> displacements at the tip of a cantilever beam under constant angular velocity. |
|} | |} | ||
| Line 4,566: | Line 4,565: | ||
|style="padding:10px;"|[[Image:Draft_Samper_691820313-monograph-zdisp3d.png|480px|Temporal evolution of z displacements at the tip of a cantilever beam under constant angular velocity.]] | |style="padding:10px;"|[[Image:Draft_Samper_691820313-monograph-zdisp3d.png|480px|Temporal evolution of z displacements at the tip of a cantilever beam under constant angular velocity.]] | ||
|- style="text-align: center; font-size: 75%;" | |- style="text-align: center; font-size: 75%;" | ||
| − | | colspan="1" style="padding-bottom:10px;"| '''Figure D.31:''' Temporal evolution of <math>z</math> displacements at the tip of a cantilever beam under constant angular velocity. | + | | colspan="1" style="padding-bottom:10px;padding-left:10px;padding-rigth:10px;"| '''Figure D.31:''' Temporal evolution of <math>z</math> displacements at the tip of a cantilever beam under constant angular velocity. |
|} | |} | ||
| Line 4,577: | Line 4,576: | ||
| colspan="1" style="padding-bottom:10px;"| '''Figure D.32:''' Reaction torque for increasing values of <math>\Omega </math>. | | colspan="1" style="padding-bottom:10px;"| '''Figure D.32:''' Reaction torque for increasing values of <math>\Omega </math>. | ||
|} | |} | ||
| − | |||
====<span id='lb-D.2.2.6'></span>Deformed shapes and stress distribution for Ω = 50 rad/s ==== | ====<span id='lb-D.2.2.6'></span>Deformed shapes and stress distribution for Ω = 50 rad/s ==== | ||
<div id='img-D.33'></div> | <div id='img-D.33'></div> | ||
| − | {| class="floating_imageSCP" style="text-align: center; border: 1px solid #BBB; margin: 1em auto; width: | + | {| class="floating_imageSCP" style="text-align: center; border: 1px solid #BBB; margin: 1em auto; width: 60%;" |
|- | |- | ||
|style="padding:10px;"|[[Image:Draft_Samper_691820313-monograph-3dstress.png|383px|Deformed shape (×500) and σ<sub>ςς</sub> distribution (colour map, in KPa) at Ω₀ = 50 rad/s. Time from 0 to 17 ms (up-down, left-right). ]] | |style="padding:10px;"|[[Image:Draft_Samper_691820313-monograph-3dstress.png|383px|Deformed shape (×500) and σ<sub>ςς</sub> distribution (colour map, in KPa) at Ω₀ = 50 rad/s. Time from 0 to 17 ms (up-down, left-right). ]] | ||
|- style="text-align: center; font-size: 75%;" | |- style="text-align: center; font-size: 75%;" | ||
| − | | colspan="1" style="padding-bottom:10px;"| '''Figure D.33:''' Deformed shape (<math>\times 500</math>) and <math>\sigma _{\varsigma \varsigma }</math> distribution (colour map, in KPa) at <math>\Omega _0</math> = 50 rad/s. Time from 0 to 17 ms (up-down, left-right). | + | | colspan="1" style="padding-bottom:10px;padding-left:10px;padding-rigth:10px;"| '''Figure D.33:''' Deformed shape (<math>\times 500</math>) and <math>\sigma _{\varsigma \varsigma }</math> distribution (colour map, in KPa) at <math>\Omega _0</math> = 50 rad/s. Time from 0 to 17 ms (up-down, left-right). |
|} | |} | ||
| Line 4,592: | Line 4,590: | ||
<div id='img-D.34'></div> | <div id='img-D.34'></div> | ||
| − | {| class="floating_imageSCP" style="text-align: center; border: 1px solid #BBB; margin: 1em auto; width: | + | {| class="floating_imageSCP" style="text-align: center; border: 1px solid #BBB; margin: 1em auto; width: 60%;" |
|- | |- | ||
| − | |[[Image:Draft_Samper_691820313-monograph-xvel.png| | + | |[[Image:Draft_Samper_691820313-monograph-xvel.png|700px|Temporal evolution of the angular speed and the local axial displacements at the tip.]] |
|- style="text-align: center; font-size: 75%;" | |- style="text-align: center; font-size: 75%;" | ||
| − | | colspan="1" | '''Figure D.34:''' Temporal evolution of the angular speed and the local axial displacements at the tip. | + | | colspan="1" style="padding-bottom:10px;padding-top:10px;"| '''Figure D.34:''' Temporal evolution of the angular speed and the local axial displacements at the tip. |
|} | |} | ||
<div id='img-D.35'></div> | <div id='img-D.35'></div> | ||
| − | {| class="floating_imageSCP" style="text-align: center; border: 1px solid #BBB; margin: 1em auto; width: | + | {| class="floating_imageSCP" style="text-align: center; border: 1px solid #BBB; margin: 1em auto; width: 60%;" |
|- | |- | ||
|[[Image:Draft_Samper_691820313-monograph-reactacc.png|600px|Temporal evolution of the angular acceleration and elastic reaction torque.]] | |[[Image:Draft_Samper_691820313-monograph-reactacc.png|600px|Temporal evolution of the angular acceleration and elastic reaction torque.]] | ||
|- style="text-align: center; font-size: 75%;" | |- style="text-align: center; font-size: 75%;" | ||
| − | | colspan="1" | '''Figure D.35:''' Temporal evolution of the angular acceleration and elastic reaction torque. | + | | colspan="1" style="padding-bottom:10px;padding-top:10px;"| '''Figure D.35:''' Temporal evolution of the angular acceleration and elastic reaction torque. |
|} | |} | ||
<div id='img-D.36'></div> | <div id='img-D.36'></div> | ||
| − | {| class="floating_imageSCP" style="text-align: center; border: 1px solid #BBB; margin: 1em auto; width: | + | {| class="floating_imageSCP" style="text-align: center; border: 1px solid #BBB; margin: 1em auto; width: 60%;" |
|- | |- | ||
|[[Image:Draft_Samper_691820313-monograph-stress_blade.png|600px|Temporal evolution of the maximum values of stress.]] | |[[Image:Draft_Samper_691820313-monograph-stress_blade.png|600px|Temporal evolution of the maximum values of stress.]] | ||
|- style="text-align: center; font-size: 75%;" | |- style="text-align: center; font-size: 75%;" | ||
| − | | colspan="1" | '''Figure D.36:''' Temporal evolution of the maximum values of stress. | + | | colspan="1" style="padding-bottom:10px;"| '''Figure D.36:''' Temporal evolution of the maximum values of stress. |
|} | |} | ||
<div id='img-D.37'></div> | <div id='img-D.37'></div> | ||
| − | {| class="floating_imageSCP" style="text-align: center; border: 1px solid #BBB; margin: 1em auto; width: | + | {| class="floating_imageSCP" style="text-align: center; border: 1px solid #BBB; margin: 1em auto; width: 60%;" |
|- | |- | ||
|[[Image:Draft_Samper_691820313-monograph-rsvblade.png|600px|Right side vectors of the four most predominant oscillations.]] | |[[Image:Draft_Samper_691820313-monograph-rsvblade.png|600px|Right side vectors of the four most predominant oscillations.]] | ||
|- style="text-align: center; font-size: 75%;" | |- style="text-align: center; font-size: 75%;" | ||
| − | | colspan="1" | '''Figure D.37:''' Right side vectors of the four most predominant oscillations. | + | | colspan="1" style="padding-bottom:10px;padding-top:10px;"| '''Figure D.37:''' Right side vectors of the four most predominant oscillations. |
|} | |} | ||
| − | = | + | =Bibliography= |
<div id="cite-1"></div> | <div id="cite-1"></div> | ||
| − | + | [[#citeF-1|[1]]] Rao, J. S. (2011) "History of rotating machinery dynamics". Springer 358 | |
<div id="cite-2"></div> | <div id="cite-2"></div> | ||
| − | + | [[#citeF-2|[2]]] Genta, Giancarlo. (2005) "Dynamics of Rotating Systems". Springer-Verlag New York | |
<div id="cite-3"></div> | <div id="cite-3"></div> | ||
| − | + | [[#citeF-3|[3]]] Genta, Giancarlo, Silvagni, Mario. (2013) "On Centrifugal Softening in Finite Element Method Rotordynamics". Volume 81, Journal of Applied Mechanics | |
<div id="cite-4"></div> | <div id="cite-4"></div> | ||
| − | + | [[#citeF-4|[4]]] Bentley, John R. (2007) "Aeolipile - Hero's Ball: A Replica of the World's First Rotating Steam Engine" http://modelengines.info/aeolipile/ | |
<div id="cite-5"></div> | <div id="cite-5"></div> | ||
| − | + | [[#citeF-5|[5]]] Volkov, Dale. (2016) "Heinkel He.178" http://www.airwar.ru/enc/xplane/he178.html | |
<div id="cite-6"></div> | <div id="cite-6"></div> | ||
| − | + | [[#citeF-6|[6]]] Gao, Haifeng, Bai, Guangchen. (2015) "Reliability analysis on resonance for low-pressure compressor rotor blade". Advances in Mechanical Engineering http://journals.sagepub.com/doi/10.1177/1687814015578351 | |
<div id="cite-7"></div> | <div id="cite-7"></div> | ||
| − | + | [[#citeF-7|[7]]] Roylance, David "Beam Displacements". Department of Materials Science and Engineering, Massachusetts Institute of Technology | |
<div id="cite-8"></div> | <div id="cite-8"></div> | ||
| − | + | [[#citeF-8|[8]]] González, José A., Abascal, Ramón, Park, K.C. (2014) "Partitioned analysis of flexible multibody systems using filtered linear finite element deformational modes". International Journal for Numeric Methods in Engineering, 102–128 | |
<div id="cite-9"></div> | <div id="cite-9"></div> | ||
| − | + | [[#citeF-9|[9]]] UPC ETSEIB "Numerical Factory - Finite Elements: a first course" https://numfactory.upc.edu/web/FiniteElements.html | |
<div id="cite-10"></div> | <div id="cite-10"></div> | ||
| − | + | [[#citeF-10|[10]]] Tulloch Andrew. (2014) "Fast Randomized SVD - Facebook Research" https://research.fb.com/fast-randomized-svd/ | |
<div id="cite-11"></div> | <div id="cite-11"></div> | ||
| − | + | [[#citeF-11|[11]]] Inman, Daniel J. (2014) "Engineering Vibration". Pearson | |
<div id="cite-12"></div> | <div id="cite-12"></div> | ||
| − | + | [[#citeF-12|[12]]] Belytschko, Ted, Lin, Wing Kam, Moran, Brian, Wiley, John. (2000) "Nonlinear finite elements for continua and structures". John Wiley & Sons | |
<div id="cite-13"></div> | <div id="cite-13"></div> | ||
| − | + | [[#citeF-13|[13]]] Hernández, J.A., Oliver, J., Huespe, A.E. (2014) "Computational Homogenization of Inelastic Materials using Model Order Reduction". Monograph Nº M141, CIMNE | |
<div id="cite-14"></div> | <div id="cite-14"></div> | ||
| − | + | [[#citeF-14|[14]]] D. Callister, William, Rethwisch, David. (1985) "Materials Science and Engineering: An Introduction". John Wiley and Sons | |
<div id="cite-15"></div> | <div id="cite-15"></div> | ||
| − | + | [[#citeF-15|[15]]] "Airfoiltools - Airofil Database" http://airfoiltools.com | |
<div id="cite-16"></div> | <div id="cite-16"></div> | ||
| − | + | [[#citeF-16|[16]]] V. Hutton, David. (2004) "Fundamentals of Finite Element Analysis". Mc Graw Hill | |
<div id="cite-17"></div> | <div id="cite-17"></div> | ||
| − | + | [17] Matsushita, Osami, Tanaka, Masato, Kanki, Hiroshi, Kobayashi, Masao, Keogh, Patrick. (2017) "Vibrations of Rotating Machinery - Basic Rotordynamics: Introduction to Practical Vibration Analysis", Volume 1 360 | |
<div id="cite-18"></div> | <div id="cite-18"></div> | ||
| − | + | [18] Géradin, Michel, Cardona, Alberto. (2001) "Flexible Multibody Dynamics - A finite elements approach". John Wiley & Sons | |
<div id="cite-19"></div> | <div id="cite-19"></div> | ||
| − | + | [19] Japhet, Caroline, Cuvelier, Francois, Scarella, Gilles. (2015) "An efficient way to perform the assembly of finite element matrices - <hal-00931066v2>" | |
<div id="cite-20"></div> | <div id="cite-20"></div> | ||
| − | + | [20] Shabana, Ahmed A. (1997) "Flexible Multibody Dynamics: Review of Past and Recent Developments". Multibody System Dynamics 189-222 | |
<div id="cite-21"></div> | <div id="cite-21"></div> | ||
| − | + | [21] GUWAHATI, NPTEL - IIT. (2014) "Theory of Rotor Dynamics" https://nptel.ac.in/courses/112103024/23 | |
Latest revision as of 16:05, 5 February 2020
Abstract
The physics lying behind rotordynamics is complex to model, so that in many cases numerical processing is the only feasible approach. Being rotordynamics a field of great interest in the aerospace industry, the efforts devoted to its understanding are increasing day by day. Following this tendency, the aim of the present study is to develop a simplified elastodynamic model for the case of rotating structures such that can be addressed through numerical tools, built using the finite element method. For the purpose of analysing the vibration phenomena, modal decomposition and numerical integration have been taken advantage from. In this context, it has been found that the singular value decomposition could be applied in structural analysis to extract dominant displacement fluctuations, allowing the unfolding of global properties of the dynamic response. In the present report, the singular value decomposition has been applied to cantilever beams undergoing a single rotation, giving rise to reasonably satisfactory results.
Keywords: Blades, FEM, rotordynamics, SVD, vibration
List of Symbols
The next list describes several symbols that will be later used within the body of the document.
Abbreviations
- Computer Aided Design
- Degree Of Freedom
- Finite Element Method
- Singular Value Decomposition
- Right Side Vector
- Left Side Vector
Mathematical notation
- Imaginary unit
- Identity matrix
- Lagrangian
- Outward normal unit vector
- Set of real numbers
- Domain
- Boundary
- Null space
- Symmetric gradient
- Spin of a vector
- Transpose
- First temporal derivative
- Second temporal derivative
- Elemental variable
- Variable expressed in the frame
General variables
- Area
- Density
- Force
- Inertia tensor
- Mass
- Moment
- Power
- Radius
- Time
- Torque
Coordinate systems
- Inertial frame
- Corotational frame
- Parent domain
Kinematics
- Linear acceleration
- Angular acceleration
- Angular position
- Angular velocity
- Position
- Rotation matrix
- Rotation tensor
- Total displacements
- Velocity
Elasticity
- 1D stiffness
- Elastic displacements in
- Elastic reactions
- Elasticity tensor
- \mathfrak{u} Generic elastic displacement
- Poisson's coefficient
- Prescribed tractions
- Rayleigh damping parameters
- Reaction torque
- Second moment of area
- Strain tensor
- Stress tensor
- Young's modulus
- Viscoelasticity tensor
Finite element method
- Assembly operator
- Circulatory matrix
- Connectivity matrix
- Damping matrix
- Elemental Jacobian
- Force vector
- Gauss point
- Gauss weight
- Global displacements vector
- Global variations vector
- Gyroscopic matrix
- Mass matrix
- Matrix of shape functions
- Matrix of the gradient of
- Nodes of the element e
- Number of elements
- Number of nodes
- Problem dimension
- Rigid body modes
- Set of unconstrained DOFs
- Set of constrained DOFs
- Stiffness matrix
- Test functions
- Trial functions
Modal analysis
- Damping ratio
- Eigenvalue
- Generalised coordinates
- Natural frequency
- Natural mode
Numeric integration and SVD
- Explicit character parameter
- Matrix of left side vectors
- Matrix of right side vectors
- Matrix of singular values
- Numerical viscosity
- Timestep
1. Introduction
The aim of this section is to briefly introduce the reader to the field of rotordynamics and outline the main models used nowadays to tackle these kind of problems. An overview of the report structuring will also be presented, as well as a review on the actual possibilities to develop the present work. This introduction follows the key concepts presented in [1], [2] and [3] .
1.1 Historical frame and background
Since the invention of the potter's wheel, almost 6000 years from now, humanity has relied on rotating machinery for a wide range of activities and processes. This idea of a symmetrical object turning on an axis is the key behind complex inventions such as mills, water wheels and even engines and jet turbines.
Behind those great inventions lies a great understanding of the physics describing this rotational motion. Greeks were the first who tackled machinery in a systematic and even mathematical point of view, bringing new inventions such as Archimedes' screw and Hero's aelopile, the first reaction turbine — which unfortunately could not produce useful work.

|
| Figure 1.1: Replica of Hero's aelopile [4] |
Water wheels became an important source of energy in ancient Chinese civilisation, and later on in the Roman empire as a substitute for manual and animal work. It was used for a wide range of applications, including iron casting and grain grinding. Wind mills took longer to appear, the first practical wind-powered machines dating from the century in Persia, and reaching Europe three centuries later. These kind of rotating machinery were, however, quite basic, and needed from better scientific background in order to be meaningfully developed.
The world had to wait until the Renaissance Period to see substantial contributions to this field. Leonardo da Vinci is credited for some fundamental contributions to solid mechanics, which were improved by Galileo and later on by Euler and Bernoulli, who formulated the correct equations for simple bending. In the zenith of scientific revolution, Newton's development of calculus unfold a new range of applications of mathematical methods to engineering. It was thanks to the latter that Daniel Bernoulli could formulate the differential equation of motion for a vibrating beam, to be later accepted by Euler when investigating beams under different loading conditions.
The Euler-Bernoulli beam theory was improved by Rayleigh (1877) and later on by Timoshenko (1921), adding the effect of shear. This beam theory, valid even today in the century, is the backbone of all rotor analysis. The two-dimensional study of structures was carried by Germain and Kirchhoff (1850), and lucid discussions about vibrations of elastic systems were carried by Lord Rayleigh.
Thanks to the contribution of these and many other scientist and mathematicians,the fundamentals of the Theory of Elasticity could be established during the scientific revolution. These deformable bodies were referred as structures by engineers. As the industrial revolution began and the first steam and internal combustion engines appeared, engineers needed from approximate methods, based on energy principles, to carry out accurate studies for solid structures with intricate geometry.
By then, as the required speed of the machinery was rather slow, reciprocating machinery could be used instead of rotating devices. In fact, little was known about the mechanical behaviour of beams under rotating forces. A first study on the topic was carried by Rankine (1869), proposing that a critical speed exists above which rotation becomes impossible. This was later denied by De Laval (1883), a pioneer in the design of steam turbines.
Once the physics of rotordynamics were well understood and steam could be used as motive force, there was a great improvement in the capacity of power generation. The first reaction turbine came up in 1884 at the hands of Charles Parsons. Later on, great development was achieved in the field of rotordynamics due to the invention of the Dynamo in 1878, which led to an outstanding expansion of the steam turbine.
Little time had to pass for rotating machinery to be used as source of propulsion. The first turbojet-powered aircraft was the Heinkel HE-178, dating from 1939. Since then, high-speed complex rotating machinery has taken an important role in many industrial and aeronautical fields. However, they require from precise estimation to work properly, as they are submitted to high thermal and stress loads. Elasticity theories and energy methods are relatively easy to apply to bars, beams, discs, plates and even membranes, but when it comes of complex three-dimensional structures, no analytical solution exists.
In this context, numerical analysis arose. Until the half of the past century, analysis of complex structures was already been carried in a numerical approach using the matrix method. However, even tough it gave good results for simple structures under static conditions, the emergence of aeronautics uncovered some of its main drawbacks, such as the impossibility to describe the flutter phenomena.
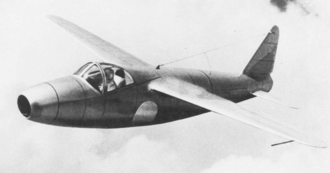
|
| Figure 1.2: Picture of the Heinkel HE-178 [5] |
With the release of by the end of the sixties and further publications pointing its mathematical basis, the finite element method gained popularity among physicists and engineers for its wide range of application. Nowadays, its main drawback is the computational cost, as the computation time increases with the number of elements to simulate.
This problem has already been addressed by applying modal decomposition analysis, which provides great results with less computation cost for dynamics systems under harmonic excitations. Unfortunately, physics describing the vibration phenomena in rotating structures are highly nonlinear, and thus alternative paths are to be sought. The singular value decomposition seems to be a good candidate that, in combination with modal analysis and numerical integration, could unfold predominant patters of the structure. If applied to rotordynamics, some phenomena of aeronautical interest could be studied, including the vibrations generated in helicopters’ and wind turbines’ blades. Other effects caused by the rotation conditions could also be addressed, such as the centrifugal stiffening and resonance phenomena. The latter is, in fact, one of the fields of investigation that lead to the foundation of the finite element method.
1.2 State of the art
This section reviews some of the basic topics of rotordynamics and introduces the reader to some essential but important concepts and models related with the dynamics of rotating structures.
1.2.1 Introduction to rotordynamics
Rotordynamics is the branch of applied mechanics dealing with devices in which at least one part, the rotor, rotates with significant angular momentum. Although the definition of rotor states that a set of hinges or bearings constrain the position of the rotation axis, there are some cases in which the rotor is not restricted at all. These are known as free rotors, with a spin speed governed by conservation of angular momentum. Examples of free rotors are spinning projectiles, space vehicles and even celestial bodies such as spinning neutron stars.
The aim of this report is, however, to study the so-called fixed rotors, in which the spin axis is somehow fixed and the spin speed imposed by a driving device. First rotordynamic studies date from the late century, when many methods to deal with rotatory machinery were developed (see A.2). One of the simplest models that described the behaviour of rotatory structures was the Jeffcott rotor, which can qualitatively explain many important features of real-life rotors. However, this simple model fails in computing precise values and in modelling complex machinery, as cannot predict some phenomena such as the dependence of the natural frequencies on the rotational speed.
As time passed by, higher power density, lower weight and faster machinery were demanded. As a consequence, correct quantitative prediction became particularly important. Torque is usually the critical factor when sizing the machine, so in applications related with power generation higher rotation speed is a must. With the increase in speed, power devices became lighter by using stronger but lighter materials. However, stronger doesn't always mean stiffer, an these lighter structures were more prone to vibrate.
Another field that demanded high performing features was propulsion, which needed from high thermodynamic efficiency and power density. That meant that the same amount of heat had to be generated in a smaller volume, and hence with lower thermal capacity. Rotating machines working under these conditions not only have to handle high temperatures, but also stresses due to the thermal gradient.
Although there has been an outstanding progress in the field of rotordynamics during the recent years, it is still a field of very active research. Attitude control of space vehicles, design of wind turbines, industrial rotating machinery, turbojets, electric motors, power generators, helicopter's rotors and space launchers (rockets) are only a few of all the engineering fields that could benefit from those investigations in the near future.
1.2.2 Linear rotordynamics
Rigid body equations
Imagine a rigid body rotating and moving around, with mass and principal moments of inertia referred to a frame fixed to the body and coincident with its principal axes of inertia. The equations describing its motion are quite complex, with non-linearities in the rotational degrees of freedom. Being the inertial frame of reference, the equations of motion under the effect of a moment and force are:
|
|
(1.1) |
Which correspond to Newton's second law and Euler's equation for rigid body dynamics, being the angular velocity of the body and its linear acceleration. Splitting into components, yields to:
|
|
(1.2) |
As can be spotted, Euler equations are nonlinear in the angular velocity. Moreover, the previous equations only describe the behaviour of a rigid body and elasticity plays no role whatsoever. Thus, one can state that the equations describing the behaviour of an structure under rotational conditions will be highly nonlinear.
However, a linearised model describing the basic features of rotating systems can be obtained embracing some simplifications :
- The rotor has a rotation axis that coincides with one of its baricentrical principal axes of inertia (the rotor is perfectly balanced).
- The deviations from the previous condition are assumed to be small.
- Displacements and velocities (linear and angular) are assumed to be small, with the exception of the rotation angle and angular velocity about the spin axis, which in many cases will be imposed by the driving system.
Equation of motion
If the previous simplifications are taken into account, a rotor with constant spin velocity can be modelled discreetly by using the adequate elastic model, and the following dynamic equilibrium equation is obtained:
|
|
(1.3) |
In the previous equation, some of the present terms may look familiar to the reader: , and stand for the symmetric mass, stiffness and damping matrices, while is a vector containing the generalised coordinates referred to the inertial frame and a time-dependant vector that accounts for the effect of external forces. However, in the context of rotordynamics, new matrices appear: and are the skew-symmetric gyroscopic and circulatory matrices, respectively.
The gyroscopic matrix contains inertial and conservative terms, linked with the gyroscopic moments that act on the rotating elements of the structure. If the equations are referred to the rotating and thus noninertial frame of reference, the Coriolis effect is included in the gyroscopic matrix. The circulatory matrix, on the other hand, contains the nonconservative effects related with internal damping of the rotating parts and, in some cases, accounts for the effect of the surrounding fluids. In many cases, it is found that in the field of rotordynamics, both and are proportional to the spin velocity , and when the latter tends to zero, the gyroscopic and circulatory skew-symmetric elements vanish and the system reduces to that of a static structure.
It is important to notice that in this context, and may not have the same expression they had in the case of still strictures. In fact, they can be split into two matrices: one corresponding to static structure and another which depends on the rotating speed, often on .
Complex coordinates
In some cases, the simplifications made in the previous page cannot be assumed, and the study of the rotor becomes very complicated. In this situations, however, an model resembling equation 1.3 can be obtained, although with reference to a noninertial frame. Moreover, most flexible rotors can be assumed to behave as beams. With these hypotheses, the lateral behaviour of the rotor can be uncoupled from its axial and torsional, simplifying thereby the resulting equations. Mathematically, this is done by using complex coordinates.
If the problem can be reduced into two-dimensional, that is, spinning around the axis and displacements only in the plane, the latter can be expressed in terms of a complex number , where stands for the imaginary unit . This formulation is equivalent to representing displacements in vectorial form, but allows a more convenient analytical form to solve the rotor equation of motion (eq. 1.3).
The key of this method is that symmetric matrices are real when the equations are written in terms of complex coordinates, whereas skew-symmetric matrices become symmetric but with imaginary terms. Using the complex number formulation, the equation of motion for a axisymmetrical rotor results in:
|
|
(1.4) |
Separating real from imaginary parts:
|
|
(1.5) |
The solution of the previous system can be written in terms of the complex frequency : the imaginary part stands for the frequency of the free motion (whirl frequency) while the real part is the decay rate changed in sign.
The main advantage of this method is that allows the system to be analysed using modal decomposition, which in conventional coordinates required from all the matrices to be square and symmetrical. Further details on the modal analysis and computation of eigenvectors and eigenvalues can be found in section 5.1.
The Campbell diagram
As has been seen, the spin speed of the structure can appear explicitly in the equation of motion. Thus, a dependence of the natural frequencies on this speed is expected. If that is the case, it is quite common to plot the natural frequencies as functions of . In many cases, frequencies characterising exciting forces also depend on and so are reported in the same graph, which is commonly known as Campbell diagram. Clearly, it is symmetrical for both and axis, so only the first quadrant is represented. The intersections with the axis correspond to the natural frequencies at standstill of the system ( = 0). It is important to note that the Campbell diagram can only be graphed if the equation of motion is linearised, because only in this case the concept of natural frequencies applies.
If the exciting forces are time-dependent with an harmonic time story, they can be plotted in the Campbell diagram. For instance, that is the case of the forces resulting from the unbalance of the rotor, which can be modelled with frequency equal to the rotation speed . If the shape of the force function is less regular, it can be split into harmonic terms using Fourier decomposition. The complete response of the system will be the sum of the responses of the system under those harmonic components.
Quite often, the relation between the frequency of the forcing function and is of simple proportionality, and thus can be represented in the Campbell diagram by a straight line. If the proportion is one to one, the line is graphed, and the excitation is said to be synchronous. The spin speeds at which a forcing function has a frequency coinciding with a natural frequency of the system at that same are known as critical speeds. They can be found in the diagram by looking for the intersections between natural and forcing frequencies.
As one may suspect, the critical speeds bring up resonance, and thus may be avoided as great displacements may be encountered. If that is the case, the rotor cannot operate near this speed without encountering strong vibrations and even catastrophic failure. However, not all critical speeds are equally dangerous, and that will depend on the main modes of the structure. Flexural critical speed are those linked with the flexural natural frequencies, and use to be particularly dangerous. They can be detected in the Campbell diagram by looking for the intersection with the line . In addition to these flexural speeds, torsional critical speeds can also be very dangerous.
The range starting from zero to the first critical speed is referred as subcritical range, and above it, supercritical range starts. In the past, it was thought that operation above the first critical speed was impossible, but it was later denied by De Laval, Stodola and many other rotordynamists. It is easy to mix up natural and critical speeds, mostly due that in many cases their value coincides. Even if that happens, the two physical phenomena are very different, particularly concerning the stressing of the rotor.
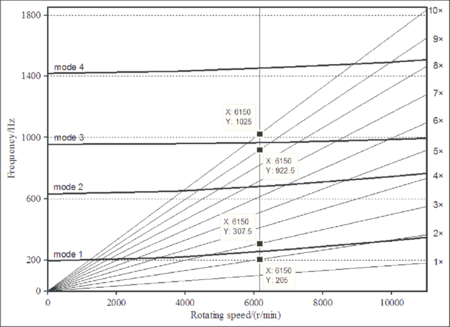
|
| Figure 1.3: Example of Campbell diagram [6] |
To illustrate a little bit this section, Figure 1.3 shows the Campbell diagram of a compressor rotor blade. Bold curves represent natural frequencies of the structure, while the straight lines show the exciting frequencies. Each intersection between them is a resonance point. Here, rotation introduces an stiffening effect: natural frequencies increase with the spin speed.
It is important to remember that the concept of critical speeds and the Campbell diagram only apply to linear systems, although a more arbitrary definition of these speeds can be used in the case of nonlinear systems, referring the speed at which greater amplitudes are found.
Frequency and time domains
Linear rotordynamics can be analysed in the frequency domain, a widely used approach that brings up an insight on how the rotor behaves under different conditions. These kind of solutions allow the engineers to perform parametric design and optimization studies, as natural frequencies and vibration modes are easily obtained using this frame of analysis. When the system is linear and operating in steady-state condition, the most popular tool to analyse its behaviour is modal decomposition, which reduces the system of equations to an eigenvalue problem.
This is achieved, however, when the rotating structure is idealised. If the system is studied in the transient state, no frequency analysis can be achieved and only numerical integration in time is possible. Although integrating numerically the equations of motion is a widely used method nowadays to tackle complex problems, it only allows to solve very particular cases without bringing up an overall insight on the phenomena. Moreover, there is a high computational cost associated to this kind of numerical methods which is not present when performing a frequency analysis.
1.2.3 Nonlinear and nonstationary rotordynamics
The previous section presented a linearised model for a rotating structure. This is, however, only an idealisation as real rotors always deviate from the lineal model. Rotors are often designed to behave linearly in their nominal conditions. However, some sources of nonlinearity such as bearings, dampers and seals may disturb the system from its ideal behaviour. Typical approaches are to consider those elements as rigid bodies, or to linearise its behaviour, in order to simplify the resulting equations. This, however, leads to unsatisfactory approximations.
If the structure is highly nonlinear, sub- and super-harmonics play an important role, as well as chaotic oscillations. Chaos has been spotted in nonlinear rotor models, and numerical results indicate that they are present in turbojet engines. If the whirl amplitude grows in time, nonlinearities emerge until the system reaches a limit cycle.
As is to expect from nonlinear systems, sudden jumps from an equilibrium configuration to another may happen. Moreover, hysteresis may appear, making the spin-up of the system different from the deceleration, even if the speeds are the same. When the system to study becomes that complex, the only way to solve the equation is by means of numerical integration.
The previous linear analysis required from constant spin velocity to be valid. It is, in fact, a common simplification in rotordynamics analysis. This model do not explains, however, the accelerating and decelerating transient states, or quick changes in the forcing functions. Even if the rotor is assumed to be linear, angular accelerations may introduce new terms in the matrices of equation 1.3 which will also become time-dependant. As a consequence, the system becomes complicated and the equations of motion are no longer solvable analytically. As an integrating numerical scheme will be required to solve the nonstationary system, there is little advantage in previously linearising the equation of motion.
1.2.4 The Jeffcott rotor
The analytical study of rotors dates back to the late nineteenth century, when Föppl, Stodola and Belluzzo described the behaviour of a simplified rotor. This model was deeply studied by Jeffcott (1919), and thus received its name. The model consists of a point mass attached to a massless shaft, being one of the simplest models used to describe the flexural behaviour of rotors. Yet, this is an oversimplification and one has to understand its limitations, although it may bring up qualitative insight into important phenomena of rotordynamics.
The model covered in this section considers an axisymmetrical fixed-free rotor, in which damping plays no role whatsoever. The restoring force is provided by an overall stiffness , which will be considered the stiffness of the shaft. Let's consider an inertial frame and rotating noninertial frame . In addition, small displacements are assumed, and the point mass is always to be contained in the plane. As in classic rotordynamics, the spin speed is assumed to be constant.
Previously to the study of the Jeffcott rotor, let's consider an even simpler model consisting in a point mass constrained to move only in the axial direction . This is the kind of model Rankine used to develop his rotor analysis. The Lagrangian to the system yields to:
|
|
(1.6) |
And the equation of motion results in
|
|
(1.7) |
This equations shows a decrease in the stiffness known as centrifugal softening, as the term multiplying the displacement is , which is clearly smaller than . Moreover, this system becomes unstable above the critical speed , prohibiting operation in the supercritical range.
![Rankine rotor model [3]](/wd/images/thumb/4/42/Draft_Samper_691820313-monograph-rankine.png/300px-Draft_Samper_691820313-monograph-rankine.png)
|
| Figure 1.4: Rankine rotor model [3] |
If the guide is removed, displacement in the transversal direction becomes possible, and a Jeffcott rotor is obtained. The equation of motion in the rotating coordinates results in
|
|
(1.8) |
This model now takes into consideration Coriolis forces, which push the mass out of is axis, allowing self-centring and thus operation in the supercritical range. The equation of motion can be written in the inertial frame using a simple change of coordinates consisting in a rotation of angle . The equation of motion of the Jeffcott rotor in the inertial frame reads as
|
|
(1.9) |
The equation above predicts no softening effect nor instability in the inertial frame, and a whirl frequency , equal to the flexural critical speed . For the case of a simply supported shaft, transverse stiffness is equal to [7], where stands for the Young’s modulus, for the second moment of area of the shaft cross-section and for the span of the shaft. The above equation predicts that, if the initial conditions are such that the mass moves into circular orbits, the system is not affected by any kind of vibration but describes whirling motion instead. In the inertial frame, angular frequency may not be constant, but the period will be equal to .
The natural frequency of the Jeffcott rotor does not depend on , and thus the Campbell diagram consists in horizontal straight lines. This is the simplest way of tackling the Jeffcott rotor, although more realistic variations of the model are widely used, taking into account forcing functions, damping, shaft bow, unbalance and out-of-plane displacements.
1.2.5 Gyroscopic effect
In the previous section, the Jeffcott model considered a rotor consisting in a point mass, and consequently, its moments of inertia were not taken into account. This is, however, a huge simplification. In reality, Campbell diagrams are not horizontal lines, but natural frequencies of bending modes depend on the spin speed. If one aims to account for this behaviour, has to consider the influence of inertia moments. Strictly speaking, the system has six degrees of freedom, and so six generalised coordinates should be defined in order to study its dynamic behaviour.
This behaviour was first noticed by Rayleigh, who identified the effect of the rotatory inertia of a disk mounted on a shaft. Stodola also considered this effect, and identified it as the responsible of giving rise to the split of natural frequencies. The study of critical speeds under the gyroscopic effect was carried by Green, and later studied using energy methods by Carnegie.
One of the simplest models follows the main assumptions of the Jeffcott rotor, but with a rigid body with nonvanishing moments of inertia instead of a point mass. In the undeformed position, one of the principal axes of inertia coincides with . Principals moments of inertia will be referred as polar moment of inertia , about the rotation axis, and transversal moment of inertia , about any axes in the rotation plane. In matrix form:
|
|
(1.10) |

|
| Figure 1.5: Massless shaft modes (lumped mass and disk models) |
In order to illustrate the problem, imagine a beam and its two first structural modes (Figure 1.5). The first mode introduces a kinetic energy term, as the mass and the disk have been displaced by the deflection of the shaft. However, if the shaft is massless, there is no kinetic energy associated to the second mode, as the point mass has not changed its position. On the contrary, if the disk rotation given by the slope is taken into account, kinetic energy associated to the angular velocity emerges and has the following expression:
|
|
(1.11) |
The above value of rotation energy is clearly zero if the beam is considered to be a point mass with no inertia, but when dealing with disks and rigid bodies, the inertia term cannot be neglected and neither can the rotation energy associated. This was a very known problem in static structures, known as rotatory inertia of beams. However, when the shaft rotates, the body acts like a spin top and gyroscope, having a significant effect in rotordynamics.
To understand the physics behind this phenomena, one has to remember Euler's equation for rigid bodies, which are clearly nonlinear with the angular velocities (see equation 1.2). Imagine a freely spinning disk (for instance, Figure 1.6) with angular velocity , rotating around an axis perpendicular to its non-deformed symmetry plane. Consider now that a whirling motion is introduced now around the axis, due to any kind of perturbation or imbalance.
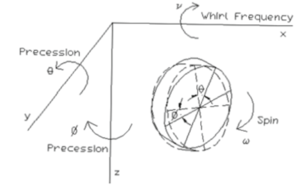
|
| Figure 1.6: Free spinning disk [1] |
Because of whirling, precessional motions linked to the shaft slopes at the disk centre are introduced. The disk then moves similar to a spin top, and the gyroscopic effect is introduced. Moreover, precession can happen in both and planes, leading to two different gyroscopic torques at which inertia torques ( and ) are added. In this context, the moment relations across the disc are written as
|
|
(1.12) |
This relations have to be taken into account when modelling the dynamics of the system. In the model seen in equation 1.3, these effects are included in the gyroscopic matrix . A further simplification can be achieved, uncoupling rotational and translational motions, leading only to four degrees of freedom. If that is the case, one can define the non-dimensional term , and study the behaviour of the rotor as a function of .
The Jeffcott model, for instance, corresponds to , in which case curves in the Campbell diagram are horizontal lines. If , the rotor is disk-like, and as there is no intersection of the curves in the Campbell diagram with the line , no critical speed exist. On the contrary, if , the rotor is considered to be very long, and a critical speed linked with conical motion exists. Finally, if is exactly one, the rotor is spherical and although there is no intersection with the line , it tends asymptotically to it as increases. Regarding the frequency of whirling, it decreases in absolute value as increases for the case of backward whirling, and increases with an inclined asymptote in the case of forward whirling.
1.2.6 Centrifugal softening and stiffening
In previous sections, the concepts of centrifugal softening and stiffening have been used to refer the decrease and increase, respectively, of the natural frequencies of a rotating structure, compared with the natural frequencies of the same structure but standstill. While centrifugal stiffening is a very well-known effect, centrifugal softening is "an alleged and elusive phenomena, and some doubts can be cast on the mathematical models causing it to appear" [3]. A model of this type is used for instance in [1] (see page 285), trying to account for the softening effect in a solid rotor. The resulting equation is:
|
|
(1.13) |
There is a term proportional to the mass matrix and to the square of the spin velocity, which is subtracted from and thus natural frequencies wane. However, when flexibility and inertia of the disks and blades are accounted for, centrifugal stiffening plays a crucial role. It can be explained as the result of the stressing caused by tensile forces, which produces a virtual increase of stiffness proportional to the centrifugal force and thus to . The simplest way to model a system accounting for both softening and stiffening effects is to use a 1 dimensional approach, which consists in modelling shafts as beams and using axisymmetrical elements. The linearised homogeneous equation of motion [3] for the free vibration, taking into account axial, torsional, out-of-plane and in-plane bending behaviour reads as
|
|
(1.14) |
, and are the mass, gyroscopic and stiffness matrices. is the centrifugal stiffening matrix, a geometric matrix whose effects are proportional to . On the other hand, is the centrifugal softening matrix, responsible for causing a decrease of the natural frequencies. The key is to assess whether natural frequencies actually decrease or not as increases. To check that, it must be known whether the effect of is stronger than or not.
The effect of - is dual: a stiffening effect due to tensile stresses caused by rotation and a softening due to the effects of the noninertial frame in which the equations are written. It can be demonstrated (see [3]) that that matrix is positive defined, and thus the overall net effect is of stiffening. The only models that, for its simplicity, are not able to capture the stiffening effect are the Rankine and Jeffcott rotors, which neither account for the gyroscopic effect. Moreover, the Rankine model is the only one that predicts a strong softening effect, which is known to lead to incorrect results.
1.3 Report outline
As presented in the previous section, the dynamic behaviour of rotormachinery is complex and the reigning equations can easily become convoluted, leading to a set of equations whose solving is far out of the scope of this report. Hence, instead of modelling the structure with complex and accurate equations, simpler models will be considered. The goal is not to get credible results, but to study on the methods used to solve the equations. For the cases where is not constant, the equations cannot be solved in terms of modal decomposition and only numerical integration is possible. These numerical schemes take a lot of time and computation cost, and give only particular solutions of the system. The key of this approach is to develop a numeric method based on the SVD that has the advantage of the modal analysis of capturing global properties of the system —such as vibration modes and natural frequencies— when applied to rotors with angular acceleration and other nonlinearities.
Regarding the written organization of the document, it is worth noting that an appendix is included at the end of the report (sections enumerated with capital Latin letters). Particular topics that could be from interest to the reader are presented there, as well as some figures related with the simulations carried out in chapters 6 and 7.
Focusing on the report, the chapters into which is divided are:
Chapter 2. The elastic model that describes the vibration behaviour of rotors is formulated. The strong form of the elastodynamic equation is obtained and analytically solved for the 1D stationary case.
Chapter 3. The weak form of the elastodynamic equations is obtained, posed in terms of the finite element method and formulated in the elemental frame. General concepts regarding the FEM methods are reviewed in this section.
Chapter 4. The general steps of every FEM simulation — preprocessing, solver and postprocessing — are reviewed. The 1D stationary case is solved using the FEM.
Chapter 5. Different methods to tackle the dynamic case are compared: modal decomposition analysis, numerical integration and singular value decomposition.
Chapter 6. The methods reviewed in chapter 5 are used to perform the structural analysis of rotating beams. In particular, the chapter focuses on the application of the SVD to recover predominant information of rotating structures.
Chapter 7. The dynamic model is further generalised, including aerodynamic forces and rigid-elastic coupling. The numeric solver is used to simulate the starting of an helicopter rotor.
Chapter 8. The developed work is reviewed and final conclusions are stated.
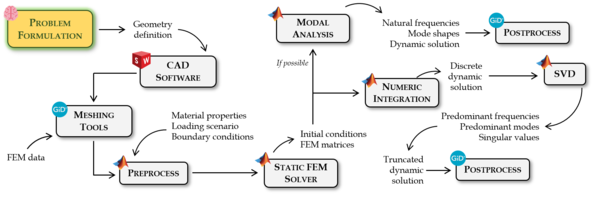
The presented outline may seem confusing for those with little experience in numerical methods. If that is the case, the reader should keep in mind the following scheme that encompasses the different parts of the numerical tool that is to be developed, as well as its chronological order (Figure 1.7).
|
| Figure 1.7: Overall numeric scheme 2 |
(1)
(2) The used software is property of the following trademarks: . 2019. Version 2018 SP4. Dassault Systèmes , Vélizy-Villacoublay, France.
. 2019. Official version 14.0.2. CIMNE , Barcelona, Spain.
. 2019. Version R2018a. The MathWorks, Inc., Natick, MA, USA.
2. Rotor modelling
The first step in the study of vibrations in rotating structures is to define an adequate model that describes its behaviour. In section 1.3, a justification on why a simple model is preferable to more accurate but complex equations is presented. The aim of this section is to keep going with this justification, presenting the chosen model and its limitations. The equations of motion will also be presented latter in this chapter.
2.1 Problem formulation and hypotheses
As it has already been stated in section 1.2, the study of rotordynamics can easily become complicated, as the understanding of the whole phenomena of rotating structures requires from a deep knowledge in several fields. However, an accurate study of rotatory structures is far from the scope of this project. Instead, more emphasis will be given to the methods used to solve the resulting equations, rather than on the modelling and simulation of the rotor. That is why the model will be defined under the following conditions and hypotheses:
- The axis of rotation of the rotor is known and fixed. Angular velocity and acceleration are known and given by the driving device.
- The problem is restricted to small displacements but great rotations induced by the driving device. Hence, it can be modelled using the linear elastic equations (A.1).
- The rotor will be modelled in terms of the finite element method using solid elements, being nodal displacements the degrees of freedom.
- The inertia of the rotor will not be taken into consideration, and thus no gyroscopic effect is expected.
The first point gives an important hint about the nature of the problem. In the inertial frame, rotating velocities and accelerations will be known. In other words, the inertial kinematic variables are not the unknown, which in fact is the torque needed to deliver the required power to maintain the given angular conditions. One has to take into account that, although the driving engine may introduce large rotations, strains will still be small in a rotating frame of reference static with respect the rotor.
The strongest limitation of the model is given by the forth point: no gyroscopic effect will be taken into consideration. This limits the correctness of the model when applied to structures with non-negligible inertia. The gyroscopic effect would induce rotations in different axes, breaking the first hypothesis. With this type of formulation, great part of the phenomena description is lost, as complex models such as the one of equation A.2 are difficult to model using classical formulations.
The above hypotheses will make the model inherently inaccurate. The resulting simulations will not describe the vibration behaviour of real rotor blades, although it is a great first step into the actual rotordynamic problem. The key of this approach is to make equations easy to pose, and thus expedite the programming of the model in terms of the FEM. Hopefully enough, this will allow a deeper study on the methods used to solve the dynamic system.
2.2 Frames of reference and rotation matrix
Previous to the posing of the equations describing the kinematics of the system, it is convenient to define the different frames of references that will be used: an inertial frame , fixed to a static point ; and a noninertial rotating frame fixed to the rotor — thus sharing its angular velocity and acceleration . The planes defined by and are meant to be coincident, and thus and will be the same axis (since both basis are positive definite). From now on, they both will be referred as , the rotation axis.
|
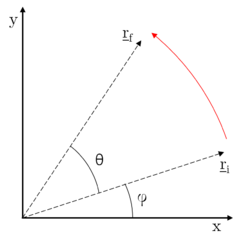
| Figure 2.1: Vector rotation in the plane xy |
To change from one coordinate system to another, one can define a rotation matrix, taking advantage of the fact that the angular displacement is known for every value of time. Following Euler's definition of rotation, it is stated that rotation in space can always be described by a rotation along a certain axis over a certain angle. In this case, the axis of rotation is . One can, for instance, represent the rotation in a two-dimensional space, being and the vectors describing initial and final positions, respectively, of a given point. The rotation is represented in Figure 2.1:
|
|
(2.1) |
Where stands for the rotation matrix, and it is satisfied that .
It will be interesting, when posing the kinetic equations, to consider the cross product or spin of a vector , represented with and defined as the linear operator:
|
|
(2.2) |
Using this operator, the rotation can be expressed in terms of the Rodrigues formula [8]:
|
|
(2.3) |
Which for the case gives the same result as in equation 2.1. What is interesting about the spin operator is the easiness to represent matrices derivatives. Defining the temporal derivative of a function as , one can compute the temporal derivative of the three-dimensional rotation matrix using the spin operator:
|
|
(2.4) |
The above expression can be generalised to compute matrix derivatives of order :
|
|
(2.5) |
2.3 Kinematic equations
The kinematic description of the rotor is going to be quite simple. Imagine a particle of the rotor, represented by a point mass with no inertia associated. This point mass is subjected to a rotation given by the driving device. If the body were perfectly rigid, displacements in the rotating frame would be zero, and positions in the plane would be given by the driving device. This is, however, not the case. Displacements in all , and even directions may occur.
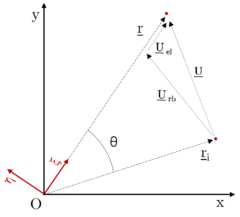
To illustrate this effect, imagine a two-dimensional case in which elastic displacements are only possible in . Imagine the mass point starting from an initial position , which after a certain time holds a generic position . The total displacement can be split in terms of rigid body and elastic displacements:
|
| Figure 2.2: Displacement as composition of rotation and deformation |
The equations describing this motion are easy to deduce. For simplicity, given a vector , let's denote as the vector described in inertial coordinates, and the same vector but in the corotational coordinates. For instance, and . It can be easily deduced from equation 2.2:
|
|
(2.6) |
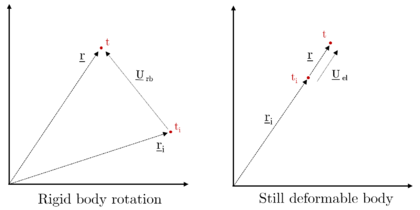
Figure 2.3 helps on visualising the different displacements affecting the point mass, starting from a given time until a generic . The total displacement results from the combination of both motions. Note that, for simplification, only axial elastic deformations are represented.
|
| Figure 2.3: Representation of the rigid body rotation and axial elastic deformation |
Using the rotation matrix obtained in equation 2.1, one can develop the following relations regarding the displacements of the particle:
|
|
(2.7) |
For the sake of notational simplification, let's simply denote the total displacement in the inertial frame as , and the elastic deformations in the corotating frame as . With this notation, the equations describing the particle's position, velocity and acceleration are:
|
|
(2.8) |
|
|
(2.9) |
|
|
(2.10) |
Where stands the angular acceleration set by the driving device. Although until now, the figures accounted only for axial elastic deformations — that is, — the fact is that the previous equations can be used to describe a general deformation in three dimensions: . From the previous equations, and are imposed by the driving device, while only depends on the initial condition. The elastic kinematic unknowns are, then, , and .
2.4 Elasticity notation
Previous to the posing of the equilibrium equations, some definitions regarding the used notation should be clarified. Let denote the number of space dimensions of the problem under consideration, and let be an open set with piecewise smooth boundary . A general point, denoted by , is identified with its position vector emanating from the origin. Tensors and vectors will be described in terms of Cartesian components. In indicial notation, differentiation is denoted by:
|
|
(2.11) |
This time, a general form of the elastic problem is to be developed. The displacement field, referred as , pretends to represent displacement in a generic case, and should not be confused with the elastic deformations in the corotational frame , presented in the previous section. Regarding the domain boundary, we shall assume that it does not change it time and admits the following decomposition:
|
|
(2.12) |
With the previous decomposition, two different boundary conditions can be stated. Regarding the prescribed displacements, the Dirichlet boundary conditions are defined on . Note that prescribed displacements may change in time, thus , where is the open time interval of length . On the other hand, regarding the prescribed tractions, the Neumann boundary conditions are defined on , where again .
To complete the definition of the boundary value problem, initial conditions shall be given. Since the governing equation will involve accelerations and thus be second order in time, both initial displacements and velocities must be specified:
|
|
(2.13) |
As stated in the previous section, the key is to find the displacements, which are represented by a vector field . Using infinitesimal theory (see A.1), the deformation state at a given point is characterised by the infinitesimal strain tensor, which is defined to be the symmetric part of the displacement gradients:
|
|
(2.14) |
For linear elastostatic systems, the relationship between the Cauchy stress tensor and the strain tensor is given in equation A.6. In the dynamic case, however, the stress at a given time is not only proportional to the strain but also to its derivative (linear viscoelasticity). In indicial form:
|
|
(2.15) |
Where is the tensor of viscoelasticity coefficients. It is often assumed to be proportional to the elasticity tensor, . For the dynamic case, inertia forces — proportional to acceleration — have to be taken into account, and will be treated as body forces per unit volume. Additionally, a damping term proportional to velocity is also to be included:
|
|
(2.16) |
Where stands for the material density, and is a damping parameter usually defined as , where is known as damping coefficients, often considered to be constant.
2.5 Strong form of the elastodynamic equation
Supposing the rotor as perfectly elastic, the equation describing the dynamic behaviour is given by Newton's second law for continuum media, which in indicial notation reads as:
|
|
(2.17) |
But to solve the previous equation, the boundary conditions and the elastic model defined in the previous section are required. The strong form of the elastodynamic boundary value problem is then formulated as:
|
|
(2.18) |
Given and , find such that
in
on
on
and with
where
The previous system has no closed form solution, and an analytical solution is only found for simple domains . For more complex geometries and boundary conditions, approximate methods have to be used. There is no need to point out that the effect of rotation does nothing but adds complexity to the equations. In the inertial frame, equation 2.17 yields to the following expression when accounting for the acceleration induced by rotation:
|
|
(2.19) |
2.5.1 Transformation of coordinates
One of the problems of the above equation is that the stress field is difficult to pose in terms of the inertial frame, as the elasticity tensor is only known in the corotating coordinates. Using the rotation matrix, stresses can be transformed from one basis to another:
|
|
(2.20) |
Upon some manipulations, the above expression can be rephrased in Voigt's notation as follows:
|
|
(2.21) |
Notice that .
Then, the relation between the stresses in the inertial and in the corotational frame , and strains in the inertial and in the corotational frame in Voigt notation is given by:
|
|
(2.22) |
An analogous expression can be deduced regarding the elasticity tensor:
|
|
(2.23) |
Having defined these relations, equation 2.19 can be rewritten in terms of the known elasticity matrix :
|
|
(2.24) |
If the dynamics of the system are studied in the noninertial frame, the above equation reduces to
|
|
(2.25) |
2.5.2 One-dimensional stationary solution
One of the simplest cases that can be tackled analytically is a one-dimensional stationary approach. In other words, it means that elastic deformations are only present in the axial direction , while the rotation is considered to be stationary with constant angular velocity . Moreover, no vibration phenomena is taken into consideration, and so and are neglected. That is to imagine the rotor as a sequence of one-dimensional bars, which can only experience pure traction and compression. For this case where , neglecting damping and external forces, equation 2.25 yields to
|
|
(2.26) |
Identifying the coefficient as the Young's Modulus, considered independent on the axial position, and considering constant section , the above equation can be rewritten as:
|
|
(2.27) |
Where stands for the density of the material and is the Young's Modulus. The above equation describes the rotation of a 1D structure under constant angular velocity. In the corotational frame, the deformation can be interpreted as the result of applying an axially distributed force, whose modulus is proportional to the radial position (Figure 2.4). Note that the displacement field will not depend on the area of the beam.
The resulting equation can be identified as a second order ordinary differential equation (ODE). Thus, two boundary conditions will be required. Supposing a fixed-free structure, the displacement at the root is to be zero, and the same happens with the stress at the free end, where :
|
|
(2.28) |
To simplify the solution, let's denote .

|
| Figure 2.4: 1D static problem interpreted as an axially loaded static bar in the rotating frame |
The solutions of the ODE are:
|
|
(2.29) |
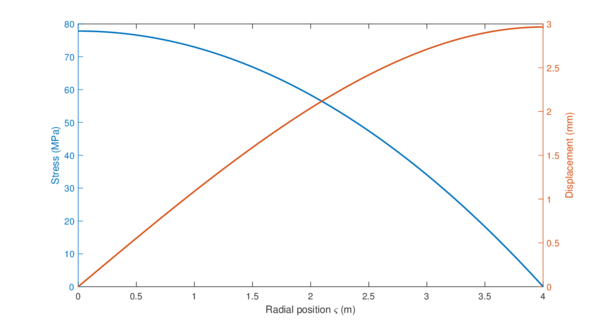
Imagine now an helicopter's rotor, with a constant cross-section and radius rotating at . Let's be idealistic, and suppose that the blade can only deform in the axial direction. Moreover, let's imagine that the conditions are perfectly ideal and no source of vibration exists. In that case, the previous equations could be used to compute the deformations and stresses across the beam. For an aluminium beam ( , ), the obtained results are showed in Figure 2.5, displaying an overall elongation of the blade of :
|
| Figure 2.5: Analytic solution for an axially loaded bar due to centrifugal forces |
For sure, this model cannot be applied to real rotors. However, it is an exact solution to equation 2.25, and will be used latter on this report to validate the developed approximated methods.
3. FEM model
Once the strong form of the elastodynamic equation has been posed, is now time to transform it in terms of the finite element method, in such a way that it can be solved using this computation technique. The aim of the present chapter is to pose the weak form of the equation and give a glimpse on how to solve it. It is taken for granted that the reader has basic notions on the topic of FEM, and thus this chapter will not explain the very basics of the method.
3.1 Weak form of the elastodynamic equation
For the sake of simplicity, let's take advantage of the formulation presented in the previous chapter while developing the strong form of the problem. To start with, the test and trial functions will be defined. Those are continuous with square-integrable derivative functions, defined over the problem boundary , with specific boundary values:
|
|
(3.1) |
Denoting as a function, the Gauss' divergence theorem reads as:
|
|
(3.2) |
The weak form is obtained by integrating over the domain the product of the balance equation (see eq. 2.17) in with the test functions, and by employing the Divergence Theorem to shift the derivatives on the stresses to the test functions . For simplicity, let's denote as .
|
|
(3.3) |
Integrating by parts and applying equation 3.2 to the first term:
|
|
(3.4) |
The first term on the right side of the preceding equation can be expressed as the sum of the integrals over . Taking into account that , and on :
|
|
(3.5) |
Introducing the latter into equation 3.3:
|
|
(3.6) |
As , the derivatives of the test function can be expressed in terms of the symmetric gradient operator: . It will be convenient to express the problem in Voigt's notation (see A.1.2). Thus, the latter expression transforms into .
Taking into account the initial conditions defined in the previous chapter, the weak form of the elastodynamic problem using Voigt's notation is written as:
|
|
(3.7) |
Given and , find such that
|
|
|
|
on
and with
The above expression is known as the variational form of the elastodynamic problem, and can be seen as the balance of internal and external virtual works, an equilibrium between stresses and inertia, viscous, body and traction forces. The term can be thought as virtual strains, while as virtual displacements. The major difference with the strong formulation is that the weaker form of the problem demands less smoothness of the solution, involving only firsts derivatives of the test functions.
The formulation of the weak form of the elastodynamic problem is only the first step for the finite element method to be fully developed. The following sections will introduce the required formulation to tackle the problem in terms of the FEM, allowing its programming.
3.2 Global formulation
The key concept of the FEM lies in the domain decomposition into a certain number of elements, finite-sized subdomains. Each element has a given number of nodes, which will depend on the element type. The important fact here is to know that the FEM only computes values of the variable at the nodes. Then, the values of non-nodal points are approximated by interpolation of the nodal values. The FEM equations are formulated in such a way that continuity of the field variables is ensured. However, interelement continuity of the gradients of the variable does not often exist. The latter is a problem affecting some variables of interest such as strains and stresses, and is solved by increasing the number of elements used.
Following with the concept of domain decomposition, it is said that the domain is discretised into element domains . The geometric shape resulting from the domain division is known as mesh. If the domain can be thought as a polygon, and is the total number of elements in which the domain is split, the decomposition can be written as
|
|
(3.8) |
If is the total number of nodes of the domain, then the FEM has to compute the field variable (in this case, displacement) in each of those nodes. For dimensions, each nodal displacement will be a -sized vector. We can define a global vector of displacements d and variations c :
|
|
(3.9) |
It is important to notice that not all the components of the previous vectors are unknown: is defined as the set of constrained degrees of freedom (DOF), along which displacement is known. Thus, and . On the other hand, is known as the set of unconstrained degrees of freedom, the global DOFs along which displacement is unknown.
As it has been stated in the first paragraph of this section, the solution along non-nodal points is interpolated using the nodal values. The interpolation functions are known as shape functions, and in the Galerkin method the same functions are used to interpolate both shape and trial functions. Let's define the continuous and with piecewise continuous derivative scalar shape function , where .
In the FEM, nodal shape functions are defined in such a way that their value is at node , and at every other node. In problems tackling with vector fields, a matrix of nodal shape functions is defined. Using the same function to interpolate displacements in all dimensions, the nodal matrix of shape functions for a three-dimensional case is:
|
|
(3.10) |
A global matrix of shape functions N can be defined, involving all the nodal matrices: . In the same line, a global matrix involving the gradient of the shape functions is defined: .
The next step is to construct finite-dimensional approximations of the test and trial functions, denoted as and , respectively. If one thinks of these approximations as subsets of and , and if and , then the approximated functions will meet the boundary conditions defined in 3.1. The finite dimensional space of test and trial functions is defined as the space including all the functions of the form
|
|
(3.11) |
In a similar way, velocity and acceleration are approximated as and , respectively. With all the previous definitions being formulated, the approximated weak form of the problem can be posed:
|
|
(3.12) |
Given and , find such that
|
|
|
|
on
and with
3.2.1 Approximated rotating elastodynamic model
Until now, rotation has not been taken into account when modelling the weak form of the elastodynamic problem. Introducing the kinematic equations obtained in section 2.3, substituting the approximations presented in equation 3.11 and using the algebraic property , the above expression can be written in the noninertial frame as
|
|
|
|
|
|
(3.13) |
In compact form:
|
|
|
|
(3.14) |
Where the subscript "static" refers to those matrices that are general in the FEM when applied to static structures, whereas those matrices with the subscript "rot" are particular of this specific case of rotating structure. Recall that in the above equation, d stands for the approximate elastic displacement in the rotative frame — .
The obtained matrices are very common in physical systems. is known as mass matrix, as damping matrix, as stiffness matrix and as force vector. Quite often, and are not known. A common approach is to suppose that the system is governed by the Rayleigh damping, which assumes and , where and are assumed to be constant parameters. Thus, the static damping matrix in the noninertial frame can be expressed as:
|
|
(3.15) |
It is important to notice that, in the case where the angular velocity is constant, the stiffness and damping matrices and the force vector due to rotation can be written as:
|
|
|
|
|
|
(3.16) |
In this case, all the above expressions are constant in time. The key fact here is that, for the two-dimensional case, is proportional to the mass matrix by a factor of . Then:
|
|
(3.17) |
This is a softening effect induced by the non-inertial character of the frame reference where the equations are posed. This behaviour has already been reviewed in the introductory part of this report (see section 1.2.6). This softening causes a reduction in the natural frequencies of the structure, compared to those of the static case. However, this effect is rarely seen in actual rotors. In reality, softening is a phenomena eclipsed by the so-called stiffening effect. The problem is that simple rotor models do not account for the latter, and thus the overall effect is of softening [3].
For sure, equation 3.14 can be posed in the inertial frame of reference using the rotation matrix and applying the transformation of stresses from equation 2.23:
|
|
|
|
|
|
|
|
(3.18) |
3.2.2 Block matrix decomposition
The above equations cannot be solved unless boundary values of displacement are specified. Moreover, the involved matrices do not admit inverse, so the only way to tackle the system is to break the presented matrices into block matrices. Remember that stands for the set of DOFs where displacement is prescribed, whereas holds for the set of DOFs where the displacement field is to be computed. Hence, naming the matrix made-up by the elements forming the intersection of the rows and columns of , equation 3.14 is split into:
|
|
(3.19) |
Where stands for the elastic reactions at the nodes with prescribed displacement, which are unknown. The above expression can be thought as a system of two equations:
|
|
(3.20) |
The above equations are fulfilled for all if and only if the terms multiplying both and vanish. Solving for the unknown displacements and reactions, and substituting , and by the corresponding boundary values , and , respectively, the resulting equations are:
|
|
(3.21) |
3.2.3 Reaction computation
Notice that the reactions can only be found once the displacements in the unconstrained degrees of freedom are known. If the equations are posed in the noninertial frame of reference, the obtained value of reaction is the expected from a static structure under the effect of a certain deformation. To account for the total reaction, the rigid body moment associated to the rotation motion is to be known:
|
|
(3.22) |
Where stands for the reaction torque associated to the rigid body motion, is the inertia moment around the rotation axis and is the angular acceleration. If this reaction torque is added to the torque generated by the elastic reactions in the noninertial frame , the overall torque is obtained. In order to find the value of , it will be necessary to compute , which fortunately can be posed in terms of the FEM. Defining the rigid body modes in three dimensions:
|
|
(3.23) |
Where is a matrix with 6 columns, corresponding to the rigid body degrees of freedom: three translations and three rotations. In the above expressions, the first three columns are the translation modes, and can be represented by the identity matrix I. On the other hand, the last three columns are the rotation modes, and are computed as the spin of the distance with respect to the rotation axis . The rigid body modes matrix has as many rows as degrees of freedom, which means that the sequence presented above is repeated for each node. In two-dimensional problems, only one rotational and two translational modes exist.
The key fact is that can be used to normalise the mass matrix in such a way that information about the structure is obtained. For a generic two-dimensional case it is found that:
|
|
(3.24) |
Where m stands for the total mass of the structure, and is the inertia moment around the rotation axis. These properties may seem to be trivial to compute, but determining either the mass or the inertia can be a difficult task if the structure is not defined by a simple geometry. Moreover, when the geometry is simple and those values can be computed analytically, they can be used to asses whether has been computed correctly by comparing the analytic values of mass and inertia with those obtained using the above numerical expression.
Once the inertia is known, the torque associated to the rigid body motion can be computed. Then, the reaction torque due to elastic reactions is to be computed by multiplying each term of by the distance with respect to the rotation axis. For a generic case, the elastic reaction torque is computed in terms of each of the components of :
|
|
(3.25) |
The total reaction torque is an vector computed by adding the contributions of for every spatial direction. Finally, the total torque is:
|
|
(3.26) |
When the kinematics of the problem are known — which is the case — one of the the most important unknowns to determine are the total forces and moments acting on the structure. The value of gives a hint on how much work needs to be injected into the blade to ensure rotation at the given angular speed and acceleration.
3.3 Local formulation
The integrals presented in the previous sections cannot be computed at once unless the geometry of the domain is tremendously simple, which is not the case. The grace of the FEM is that breaks the domain into smaller elements with well defined geometric properties, where the previous integrals are approximated using Gauss Quadrature, allowing computer implementation . In order to achieve this goal, a new local frame within a single element is defined. Let's assume the model consists of elements, and take as the variable index for the elements .
Let's introduce , the vector of global or physical coordinates in the local frame, containing the coordinates of a given element . Following this local approach, let's define as the vector of local or element coordinates in the parent domain. In order to visualise the mapping from the parent domain to the physical domain using isoparametric linear elements, let's consider a simple 1D case. The transformation from one domain to another is represented in Figure 3.1.

|
| Figure 3.1: Representation of the mapping from the physical to the parent domain for a linear 1D element |
The same concept can be applied to 2D and 3D elements. For a generic case, the mapping is constructed using the same shape functions employed in the interpolation of (isoparametric elements). Defining as the number of nodes of the element , the mapping is expressed as:
|
|
(3.27) |
Were stands for the nodal coordinates in the physical domain, and is the matrix of shape functions for scalar valued fields. In a similar way, one may define the matrix of shape functions for vector valued fields , where is the identity matrix.
The mapping can be interpreted as a change of coordinates, and thus it is a transformation with an associated Jacobian matrix . It allows the differential mapping between physical and parent domain, and vice versa:
|
|
(3.28) |
Taking a closer look to the elemental Jacobian matrix, one founds that it can be expressed as
|
|
(3.29) |
Where is the gradient operator for scalar-valued functions in element coordinates and is the matrix of the gradient of for scalar-valued functions in the parent domain. The gradient operator for scalar-valued functions in both parent and physical domains ( and ) are linked through the transpose of the inverse of the Jacobian matrix:
|
|
(3.30) |
In the above expression, is the matrix of gradient of shape functions for scalar valued functions in global coordinates. In a 3D problem:
|
|
(3.31) |
However, the displacement field to be computed is a vector field, so a matrix of symmetric gradient of shape functions for vector-valued functions in the physical domain is to be defined. For a 3D problem:
|
|
(3.32) |
In order to illustrate this section, which may seem a little bit abstract to the reader, let's return to the example presented in Figure 3.1. Imagine a 1D problem, where the domain has been split into smaller straight lines (elements). Each element has at least two nodes where the displacements have to be computed. It is not the only possible case: one can compute the displacements at more than two points by increasing the number of nodes of the element. In 1D, an element with two nodes is called linear; if it has three nodes, quadratic; if four, cubic; and so on. These names refer to the order of the polynomial that has to be used as shape function in each case.
The key is that no matter the length of the element in the physical domain. When mapped to the parent domain, the element boundaries go from to . Is in this parent domain where the shape functions are defined: as the element length is normalised, the shape functions can be the same for all elements. Recall that in the FEM, a shape function is restricted to have a value of at node , and at every other node. Notice that in order to accomplish the latter, there will be as many shape functions as nodes. With all these properties in mind, the Figures 3.2 (a), (b) y (c) represent shape functions of different order for a 1D element defined in the parent domain.
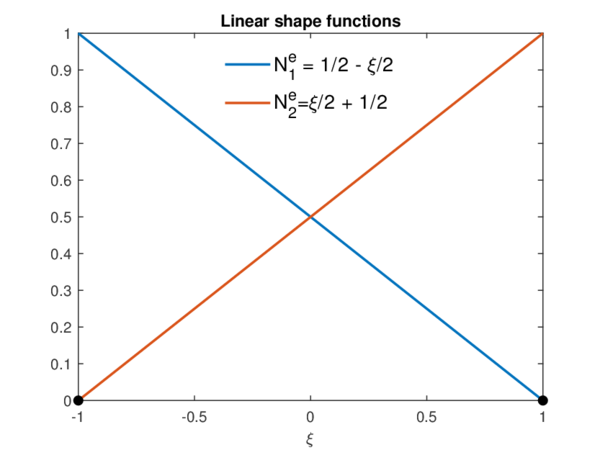
|
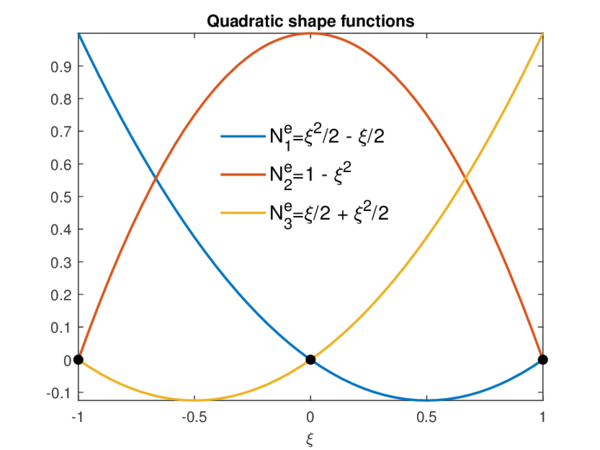
|
| (a) | (b) |
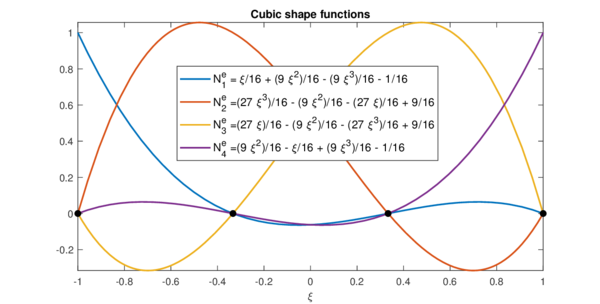
| |
| (c) | |
| Figure 3.2: 1D shape functions for linear (a), quadratic (b) and cubic (c) isoparametric elements. | |
The same reasoning that has been followed for a 1D element can be developed for 2D and 3D elements. In those cases, many different types of elements can be defined, depending on their geometric properties and number of nodes. The shape functions will then have two or three spatial variables, and are to be defined for each type of element. For instance, in order to complete the previous example, let's consider the case of a linear triangular element (Figure 3.3).
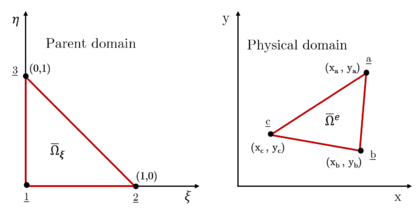
|
| Figure 3.3: Representation of a triangular linear element in both parent and physical domains |
In the parent domain, the nodes are always listed in counter-clockwise direction. As can be seen, no matter the shape of the triangle in the physical domain, once it is mapped into the parent space all the elements are geometrically identical. The matrix of shape functions of the above element and its gradient in the parent domain are, then:
|
|
(3.33) |
3.3.1 The Gauss Quadrature integration method
Although the domain has been divided into smaller elements, the integrals presented earlier are still difficult to compute, as those elements have a wide variety of different boundaries. If the geometry of the element is sort of complex (nothing unusual in 3D), the integrals would have to be evaluated along those boundaries, which also change from one element to another. The solution to this problem has been presented in the previous section: if the element is mapped into the parent domain, its geometric properties are kind of normalised. The integrals can then be evaluated in the parent domain, and later on be transformed into global coordinates by using the Jacobian matrix (recall equation 3.30).
Now the question lies in which method use to evaluate those integrals. For sure, the analytic solution is discarded as it would take too much time. From among all the numeric integration methods, one of the most widespread is Gauss Quadrature. It is a fast and simple method, that give great approximations with few operations. Basically, it reduces the integral to a summation of function values at specific points (Gauss points), multiplied by a certain factor called weight. The great advantage of this method is that as all the elements of the same type are mapped equally in the parent domain, the values of the weights and gauss points will be the same for all elements.
Imagine that the integral to evaluate is of some function over the physical domain. First, the integral has to be mapped into the parent domain through a change of variable, accomplished by using the Jacobian matrix of the transformation :
|
|
(3.34) |
Where stands for the determinant of the Jacobian. In 3D, . As Gaussian rules for integrals in several dimension are constructed by using 1D Gaussian rules on each coordinate separately, hereinafter only the one-dimensional Gauss Quadrature will be considered. The goal of the method is to find a set of Gauss points and weights such that:
|
|
(3.35) |
The above expression give exact results only if is a polynomial. If not, only approximate results are obtained, whose accuracy improves as more Gauss points are used. Supposing that the integrand is a polynomial of order :
|
|
(3.36) |
The values of the Gauss points and weights are obtained by exactly evaluating each monomial , with :
|
|
(3.37) |
The previous expressions lead to a linear system of equations with unknowns. If results to be a polynomial, the exact integration requires from points. Gauss points and weights will be different depending on the number of points used. The values of the Gauss points and weights up to 5 points are presented in Table 3.1.
4. FEM programming
Now that the elastodynamic model for rotating structures has been formulated in terms of the FEM, it is time to tackle its programming. This section covers the different processes involved in the simulation and how the solver works. In this chapter, only the static case is to be addressed, as the methods used to solve the dynamic problem will be reviewed later in the report.
4.1 Preprocessing
All the finite element simulations, carried out or not by commercial codes, start with the model definition, a critical phase widely known as preprocessing. This first step begins with the definition of the geometric domain of the problem: in this case, the structure. Nowadays, the most widespread method to define the geometry is by using computer-aided design (CAD) software. Examples of commercial CAD programs are CATIA, Rhino and SolidWorks.
Once the geometry is defined, it is exported to what is known as mesh generation software. The final goal of the latter is to create a mesh: a subdivision of the geometry into discrete cells known as elements. As it has been commented in the previous chapter, many different types of elements exist, so its type, length, area and other properties are to be defined. Notice that meshing is not a trivial process as geometries can be quite intricate. In order to accurately capture the input domain geometry, the mesh generation is often aided by computer algorithms. In this step, the domain boundary is also to be defined. Once the mesh has been generated, the software computes what is known as connectivity matrix, which contains all the information about the mesh and defines the relations between elements and nodes (see for instance the numbers printed in Figure 4.1a).
The connectivity matrix , also known as element connectivity array, stores all the element definitions. It is an array of integers numbers where the cell contains the global number of the node of element . It is an essential matrix as it stores all the information regarding the mesh, and it is crucial when transforming from global to local coordinates.
Quite often, commercial programs allow both designing and meshing. This is in fact the case of GiD, the pre and postprocessing tool used during this project. However, its designing tools are quite basic, and so it admits the importation of models from other CAD softwares. Nonetheless, those tools are quite useful when editing an imported geometry in order to simplify the meshing procedure. Figure 4.1 illustrates the meshing of a 2D figure with GiD, using triangular and quadrilateral elements. In some cases, the mesh can be very simple (for instance a grid in Figure 4.1a), whereas other geometries require from more complex meshes.
The next step is to define, for each element, material properties (density, elastic coefficients, heat conductivity, etc.) and loadings (volumetric forces, internal heat sources, etc.). The final part of the preprocessing phase consists in defining boundary conditions, which in our case is to prescribe displacements and tractions along the boundary. Commercial softwares usually include a wide library of material properties and loading scenarios to carry out these last steps.

|
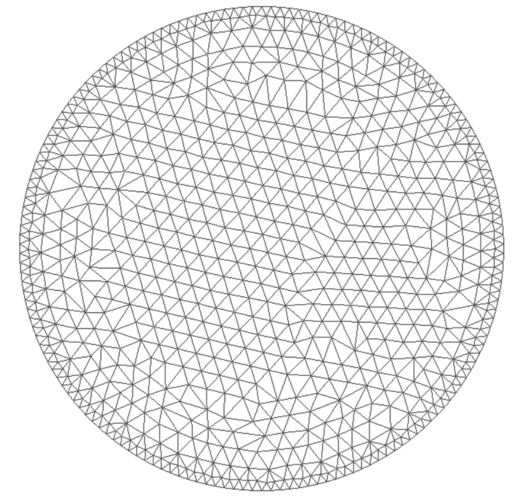
|
| (a) | (b) |
| Figure 4.1: Mesh representation using quadrilateral (a) and triangular (b) elements. In the case of the circle, the mesh has been generated using in-built algorithms. | |
As GiD does not implement this capability, this last part of the preprocessing is carried out with . Once the mesh is created, GiD exports a raw file (.msh extension) including the connectivity matrix, the nodal coordinates, the element typology and boundary information. Those are later recovered and imported to . Material properties are manually assigned to each element, as well as the nodal values of body forces and prescribed boundary displacements and tractions.
4.2 Solver
Once the formulation of the problem is completed and all the information regarding structure's geometry, material properties, loads and boundary conditions is gathered in a file, it is time to solve the elastostatic equations. In fact, the equations to be solved correspond to the approximated weak form of the problem stated in terms of the FEM (see equation 3.21). In this chapter, only the static form of the problem is to be tackled — that is, :
|
|
(4.1) |
It is a first step in the understanding of the whole phenomena, and the developed code is going to be re-used later on when studying the dynamic case. The code is developed in , with its main working algorithm schematised in Figure 4.2.

|
| Figure 4.2: main code scheme for elastostatic problems |
As it can be suspected from the previous figure, the main task of the solver is to compute the matrix and vector from equation 3.13. Using the local formulation presented in the previous chapter, the computation of the latter can be split into a simpler problem, regarding only elemental matrices and vectors . Once they are obtained for all the elements of the domain, the elemental matrices are joined together into a global stiffness matrix and force vector through a process called assembly. When and are known, equation 4.1 results in a linear system of algebraic equations, easily handled with native functions. A further explanation regarding elemental matrix computation and assembly can be found in Annex B.
Once the displacement field is known, the final step of the solver consists in finding the reactions and the strain field. Computation of elastic reactions is straightforward, as they are obtained from equation 3.21. On the other hand, the strain field is to be computed in the local frame, element by element. Strains are defined as the spatial derivative of displacements (see equation A.7), which can be written in terms of the FEM as:
|
|
(4.2) |
Where represents the assembly operator. As is approximated through Gauss Quadrature, strains and stresses are only computed at the Gauss points .
4.2.1 Efficient assembly
In the FEM, computation of global matrices is never done in a single step. Instead, elemental matrices are computed element by element, and then joined together through a process called assembly, constructing this way the global matrix. The intuitive method to perform the assembly is quite simple to program: elemental matrices are computed one by one, and then allocated into a bigger, global matrix using the connectivity array. The connectivity array links the local numeration of the degrees of freedom with the global one, specifying the row and column of the global matrix where each component of the elemental matrix has to be placed. For a one-dimensional case, the classical assembly of a matrix can be programmed as follows:
for e = 1 : n_el %Loop over all the elements
   M_e = Compute_Me(. . .); %Function that computes the elemental matrix
   for a = 1 : n_e %Loop over the nodes of the element e
       for b = 1 : n_e
          A = CN(e,a); B = CN(e,b); %Transformation from local to global
          M_glo(A,B) = M_glo(A,B)+M_e(a,b); %Allocate M_e into the global matrix
       end
   end
end
The previous algorithm has two main drawbacks. The first one is related with the memory large matrices take up. Each cell of a matrix is defined as double, a type of variable that uses 8 bytes of memory. Using the traditional approach, a 3D system with 30000 nodes would involve matrices with a size bigger than 7.5 gigabytes, which is clearly infeasible. But if one takes closer look to the matrices involved in the FEM, will discover that most of the cells are filled with zeros. Matrices in which most of the elements are zero are known as sparse matrices Figure 4.3.
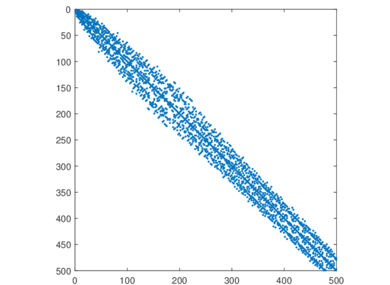
|
| Figure 4.3: Representation of a sparse matrix. Blue squares are non-zero values. |
For sure, storing the zeros of a sparse matrix as double variables is a waste of memory. That is why most of the programming languages have in-built algorithms to store sparse matrices in more efficient ways. The key is to store only the non-zero values and their position in the matrix. Using this approach, systems with a large number of degrees of freedom can be tackled without memory problems.
The second disadvantage of the classical assembly method is related with its computational cost. A closer look to the presented algorithm reveals three nested loops. A local matrix has to be computed for each element, and then placed into the global matrix cell by cell. In , this iteration is rather slow. For the static case, where matrices are computed once, it is not a big deal. But when dealing with the dynamic case, global matrices are to be computed repeatedly, increasing considerably the running time of the solver. This problem is solved by using a vectorised version of the assembly algorithm.
The key of the vectorised algorithm is that computes and assembles all the elemental matrices at once, avoiding iterations [10]. It is more difficult to program than the classical algorithm, but its advantages are considerable. For instance, Figure 4.4 reveals an outstanding decrease of the computation time for 2D systems. As it can be spotted, although for few degrees of freedom the classical algorithm is quicker, the vectorised algorithm proves to be the most efficient solution as the size of the system grows.
The vectorised assembly algorithm has been adapted for the rotating case from a set of codes given by prof. Hernández J., which were used in the context of composite materials. An exemplification of the vectorised assembly for a simple mesh can be found in Annex C.
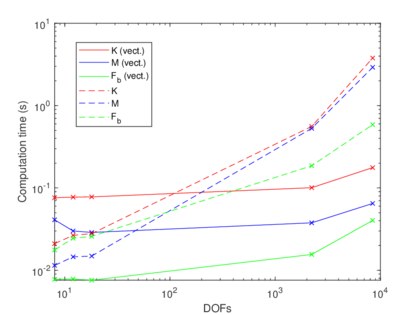
|
| Figure 4.4: Comparison of the computation time of , and using the classical and vectorised assembly (logarithmic scale). |
4.2.2 Approximated one-dimensional stationary solution
To conclude the solver section, let's exemplify the explained concepts approximating the solution of the system presented in 2.26. It is the simplest case to tackle: a 1D blade rotating at constant speed with no vibration at all. It can be interpreted as a static elastic problem in the rotational frame, where deformations can only occur in the axial direction . The goal is to find the approximated solution using the FEM, and assess its validity by comparing it with the analytic result obtained in 2.5.2. Recall the differential equation to solve:
|
|
(4.3) |
Using the FEM formulation, an approximated weak form of the equation can be written:
|
|
(4.4) |
By replacing the test and trial function with its approximations in terms of the shape functions, the above equation yields to:
|
|
(4.5) |
Taking into account that displacements are prescribed along the set and unknown in , the above equation can be split into block matrices:
|
|
(4.6) |
Previous to the solving of the above system of algebraic linear equations, global matrices and are to be known. As it has been discussed, the best choice is to decompose the latter into elemental matrices:
|
|
(4.7) |
Elemental matrices are to be calculated using the approach reviewed in Annex B. The first step is to define the type of element in the parent domain. For simplicity, let's assume linear elements. Recall the shape functions in the parent domain for a linear 1D element from Figure 3.2(a):
|
|
(4.8) |
To compute , the Jacobian of the transformation is to be found:
|
|
(4.9) |
Where represents the length of the element. Then:
|
|
(4.10) |
With all, the computation of the elemental stiffness matrix is reduced to:
|
|
|
|
|
|
(4.11) |
Recall that for the calculation of the elemental stiffness matrix, integrals are evaluated exactly. This is not the case of the force vector, which is approximated trough Gauss Quadrature. Replacing by :
|
|
|
|
(4.12) |
As is linear in and is also linear in , three Gauss points () will suffice to evaluate the above integral exactly. The values of Gauss points and weights can be found in table 3.1. Once the elemental stiffness matrix and force vector are known, they are computed for each element of the domain and assembled into global matrix and vector . The last step before finding displacement field is to solve the system of equations stated in 4.6.
In order to compare the results with the exact solution, let's consider the same conditions as in the analytic case. The structure of study will be a blade with constant cross-section and radius, rotating at . For an aluminium bar (, ), the results are displayed in Figure 4.5 and compared with the exact solution. Recall that computation of stresses once nodal displacements are known is achieved using expression 4.2.
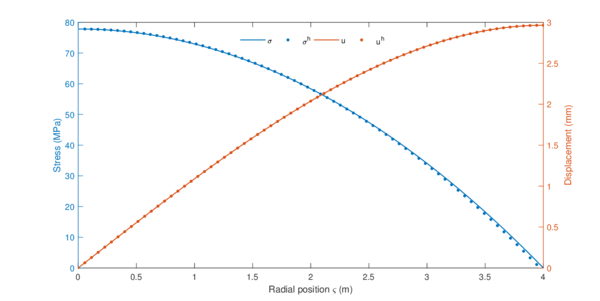
|
| Figure 4.5: Approximated solution of equation 2.26 using 70 elements, compared with the exact result. |
In the FEM, another input parameter to define is the number of elements into which the domain is divided. Theoretically, the approximated solution converges into the exact one as the number of elements increases. In order to assess this convergence, let's define the error associated to the approximated solution using the L2 norm of the distance between and :
|
|
(4.13) |
In a similar way, one can define the error associated to the derivative of , which in this case is linked with stresses. In order to evaluate those integrals, the domain is again split into elements where Gauss Quadrature is applied. As quite often the exact solution is not a polynomial, high order Gauss rules are needed. In general, the logarithm of the error varies linearly with the element size, and its slope depends on the order of the element:
|
|
(4.14) |
Where is known as the rate of convergence of the element, while is an arbitrary constant and the element length (assumed constant). The parameter is equal to , where is the order of the used shape function. For the derivative of the error, the slope of convergence is one order lower. Recall that if obtaining the analytic exact solution were impossible, the computation of the error in the way that has been developed would not be practicable. In that case, in order to check the convergence of the method, relative error should be computed. That is, to compare the error of the function obtained using elements, with a previous function obtained with elements.
4.3 Postprocessing
The last step of every FEM simulation is analysis and evaluation of the solution results, often referred as postprocessing. Once the solution of the problem is computed, it is exported to a postprocess program that interprets, prints and plots the results. Among many other operations, these programs are used to draw the deformed structural shape, produce colour-coded plots (representing displacements, strains and stresses) and animate the dynamic behaviour of the system, if that were the case. Equilibrium check (assessing if reactions counteract external forces, for example) is also part of the postprocess stage.
In the previous example, results were graphed in a simple plot. This approach is unattainable for multidimensional problems with non-trivial geometry, and thus external programs are to be used. In this project, the postprocessing is carried out by GiD, the same program used for the mesh definition. To illustrate GiD capabilities, let's consider a fixed-free cantilever beam under the effect of a distributed load along its upper side. The beam is shaped as a long rectangle () and meshed using 1000 linear quadrilateral elements. Figure 4.6 represents its deformed configuration, and stresses along the beam are represented using colours:

|
| Figure 4.6: Deformed shape () and stress () colour map of a 2D beam under the effect of a distributed load on its upper side. |
The colour legend has not been displayed as it is not from interest in this example. Remember that although displacement is continuous along the domain, its derivatives (stress and strains) are only computed at Gauss points. Modern postprocessing programs have in-built tools that blur the latter in order to hide discontinuities. The engineer has to be aware that misuse of blurring tools can induce notable errors.
To both asses the accuracy and validate the 2D solver, FEM results can be contrasted with the analytic solution obtained from beam theory. In particular, vertical displacement along the mean line of the beam is the variable that is being compared in Figure 4.7. Analytic results are those of a beam with squared cross section, whose deflection can be expressed as:
|
|
(4.15) |
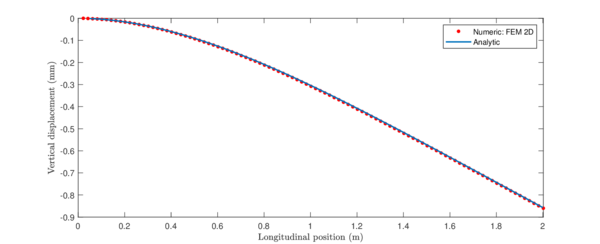
|
| Figure 4.7: Comparison of the approximated and theoretical vertical displacement of a beam under the effect of a distributed load. |
5. Dynamic response
So far, the problem regarding static deformations in the noninertial frame is fully settled. However, although it can be used to determine initial conditions, the developed model is unable to account for time-dependant variables such as velocity or acceleration in the rotating frame. In other words: it cannot capture the phenomena of vibration. In order to study the dynamic response of the system, new approaches are to be considered. Hence, this chapter will review two main methodologies to tackle time-dependant problems: modal decomposition analysis and numerical time integration. A brief description regarding the singular value decomposition (SVD) will be presented at the end of this chapter, presenting a promising method to handle nonlinear dynamic systems.
5.1 Modal decomposition analysis
Modal analysis is one of the most widespread techniques to tackle structural vibration problems, for both discrete and continuous systems. The key of this method is that it studies the problem in the frequency domain, rather than in the temporal one. To start with, recall the equation describing a rotating structure in the noninertial frame of reference:
|
|
(5.1) |
Where , and are the sum of two contributions: a first one typical of static conditions, and a particular second one accounting for the effect of rotation. For the sake of notational simplicity, on now on let's assume the following redefinitions:
|
|
(5.2) |
The advantage of the presented reformulation is that allows equation 5.1 to be expressed as:
|
|
(5.3) |
With and subject to initial conditions and . The previous expression can be thought as a second order ordinary linear differential equation. From calculus, it is known that the solution of this kind of ODE is the sum of a particular and homogeneous solution:
|
|
(5.4) |
The homogeneous solution of the system is found by making , whereas the particular solution is to be computed for the specific case of study. One of the main drawbacks of the modal analysis is that, as it works in the frequency domain, forcing functions need to be harmonic: . This is not the case of the system of study, where forces due to rotation are either constant or increasing in time, and external forces can adopt any arbitrary shape. One way of tackling this problem is to decompose into the sum of harmonic functions through the Fourier transform. As the system of study is linear, its response can be expressed as the sum of the responses due to each of the obtained harmonic forcing functions.
If is difficult to pose in terms of harmonic functions, another approach consists in splitting into the sum of impulses. The response of the system to an impulse is identical to the free response with certain initial conditions [11]. Again, the system is studied under the effect of each of those individual impulses, and taking advantage of the linearity of the system, the solution is expressed as the sum of the latter individual responses. As modal study of structures under a generic forcing function can easily become complicated, the present section will only cover the homogeneous solution of equation 5.3.
5.1.1 Undamped free vibrations
In order to introduce the basics of the modal analysis, let's consider the simplest case to handle: a system where both and are zero, so damping and external forces play no role whatsoever. With this assumption, equation 5.3 reduces to:
|
|
(5.5) |
The modal analysis starts supposing a solution with the following form:
|
|
(5.6) |
Where is a known solution for homogeneous second order differential equations. Since , the above equation can be written as:
|
|
(5.7) |
The preceding equation is known as the eigenvalue problem. The trivial solution is not from interest, whereas the non-trivial solution is given by a set of eigenvalues , where represents the diagonal matrix of natural or resonant vibration frequencies. For a system with degrees of freedom, eigenvalues exist that satisfy the above expression. Being an index that goes from to , the eigenvalue problem can be interpreted as a system of equations of the form
|
|
(5.8) |
Where is referred as the eigenvector associated to the eigenvalue . Notice that eigenvectors do never define absolute values of the different independent coordinates of the system, but inform about the phase and amplitude relations between degrees of freedom. In structural problems, eigenvectors are called natural modes or mode shapes, and can be though as possible deformed configurations oscillating at a given frequency stated by its corresponding eigenvalue. In matrix form, eigenvalues and eigenvectors are expressed as:
|
|
(5.9) |
The main advantage of this method is that natural frequencies and mode shapes are relatively easy to obtain. , for instance, has in-built functions that compute a set of eigenvectors with the smallest associated frequency. The key of this approach is that there is no need to compute all the eigenvalues and eigenvectors, and instead the solution of the system can be approximated using a small number of them. In structural analysis, shape modes associated to low frequencies are the most dangerous, and the ones from interest when studying vibration. Recall that and only depend on the matrices and , which can be computed using the static FEM program previously presented. For instance, mode shapes associated to the four lowest natural frequencies of the cantilever beam defined in 4.6 are displayed in Figure 5.1.

|
| Figure 5.1: Shape modes associated to the first four lower natural frequencies of a 2D fixed-free beam |
An important property of eigenvectors is that they are orthogonal with respect to and :
|
|
(5.10) |
The previous equation can only be applied if the matrices involved in the system are symmetric and positive semidefinite, and implies that the matrix of natural modes diagonalizes both and . It is a common approach to normalise such that , which results into . Introducing the generalised coordinates such that , and pre-multiplying by equation 5.5:
|
|
(5.11) |
The above expression is, in fact, a system of uncoupled differential equations subject to the following initial conditions:
|
|
(5.12) |
Recalling the definition of stated in equation 5.6, the exact solution of the system can be expressed in uncoupled form as:
|
|
(5.13) |
In order to postprocess the results, displacements of every degree of freedom are to be computed at different values of time and joined together into a matrix. The time between two consecutive samples is called time-step, and in order to capture the vibration phenomena it has to be less than half the period of the highest frequency of interest. Once displacements are computed, they can be animated through GID.
|
|
(5.14) |
As it has been pointed before, sometimes it is enough with an approximation of the solution, obtained using only terms. A good strategy to asses which shape modes are the most relevant for a given structure is to use the normalised initial amplitude associated to each mode as guide:
|
|
(5.15) |
For the presented 2D beam, normalised initial amplitudes are plotted in a bar graph in Figure 5.2 for the six shape modes with lower frequency. It can be seen that the most excited mode shape is the one corresponding to pure bending (), which makes sense since the beam is under the effect of a distributed load on its upper side. Notice that in order to find this out, initial conditions need to be defined. Different modes can dominate the same structure under distinct initial conditions.
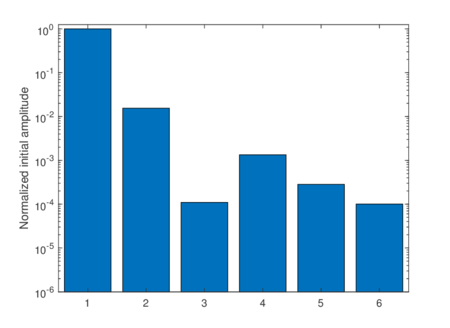
|
| Figure 5.2: Normalised initial amplitude versus mode shape number for a 2D fixed-free beam under the effect of a distributed load |
5.1.2 Damped free vibrations
Modal analysis can handle damped systems only if some requirements regarding the damping matrix are met: needs to be either diagonal or a linear combination of and . The last assumption is known as Rayleigh damping, and has already been presented in equation 3.15. The equation describing a system under Rayleigh damping is written as:
|
|
(5.16) |
Introducing the change of variable , and pre-multiplying by :
|
|
(5.17) |
Which is a system of uncoupled differential equations. Defining the damping ratio associated to the eigenvalue and the damped oscillation frequency :
|
|
(5.18) |
The system of equations can be decoupled into:
|
|
(5.19) |
Up to this point, two different situations may occur depending on the value of . If , then is real valued and the exact expression for the generalised coordinates is:
|
|
(5.20) |
This response is known as subcritical oscillation, and can be interpreted as an undamped free vibration whose amplitude decreases exponentially in time. On the other hand, if , damped oscillation frequencies are no longer real valued and generalised coordinates are expressed as:
|
|
(5.21) |
This is a non-oscillating response known as overcritical motion. In both cases, physical displacements can be computed in the same way as in the undamped case:
|
|
(5.22) |
5.1.3 Modal analysis of rotating structures
The presented method of modal decomposition can be applied to the case of study of rotating structures, but subject to some limitations. The approach that has been developed previously is only valid if the matrices involved in the system are constant. Recall from equation 3.13 that for rotation problems, the stiffness and damping matrices are the addition of a static component, which is constant, and a rotating one that depends on angular velocity and acceleration. The latter varies with time if the angular acceleration is different from zero. Thus, the only possibility for the system to be tackled through modal analysis is to rotate under constant angular velocity . In that case, the eigenvalue problem is written as:
|
|
(5.23) |
And if the problem is either 1D or 2D:
|
|
(5.24) |
The above expression unfolds the softening effect predicted in 3.17, which produces a decrease in the natural frequencies as angular velocity increases. The relationship between natural frequency of the static and rotating case is:
|
|
(5.25) |
According to the above equation, lower frequencies are the most affected by the softening effect. This behaviour can be represented through a Campbell diagram (Figure 5.3), where natural frequencies of a rotating structure are plotted as a function of the angular speed. This softening effect, however, is rarely seen in real scenarios: it is a consequence of the limitations of the model, which is not able to account for a counteracting stiffening effect. The decrease of the natural frequencies emerges in fact due to the non-inertial character of the frame of study.
Supposing that the 2D beam studied in Figure 5.1 undergoes a rotation at constant angular velocity, then the natural frequencies linked with the presented mode shapes would decrease as the spinning speed grows in the way it is displayed in the following graph.
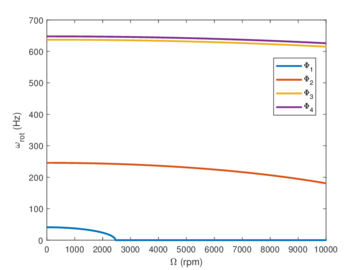
|
| Figure 5.3: Campbell diagram representing the natural frequencies of a 2D beam rotating at constant speed |
5.1.4 Limitations
Until now, only stationary scenarios have been considered as modal analysis is not capable of accounting the effect of angular acceleration. Another drawback of this method is related with the requirement that needs to be a linear combination of and . This is not the case of rotating structures, as under the effect of rotation, the damping matrix adopts the form:
|
|
(5.26) |
Where , that accounts for the Coriolis effect, cannot be expressed in terms of nor and neither is a symmetric matrix. Therefore, modal analysis in rotating structures becomes impracticable unless Coriolis effect is neglected. Nonetheless, it is a powerful tool that allows extraction of important information about the system, such as natural frequencies and mode shapes. Moreover, modal decomposition leads to exact results if all the terms of the summation are taken into consideration. This exact solution will help assessing the validity of the approximated results obtained through the numerical methods presented in the next section.
5.2 Numerical integration
In order to overcome the limitations modal analysis is subject to, numerical integration methods arose. The key is to solve the elastodynamic differential equation by integrating over the time domain. As these integrals do not have exact close solution, they are approximated trough a set of numerical methods and algorithms. In particular, the implicit Newmark -method [12] is the one covered in this report. To start with, the time interval is divided into time steps:
|
|
(5.27) |
Where is a generic time value. Following this description, equation 5.3 is discretised:
|
|
(5.28) |
Recall that and are no longer constant, as angular acceleration is now taken into consideration. Newmark -methods are a family of integration schemes in which displacements and velocities at time are uploaded through the following formulae:
|
|
(5.29) |
|
|
(5.30) |
|
|
(5.31) |
Where is the time step and and are numerical parameters. The parameter introduces damping to the numerical method, controlling what is called artificial viscosity [12]. It is used to reduce noise in the solution. If , no damping is added, whereas if the artificial viscosity added to the system is proportional to . On the other hand, the parameter defines how much implicit or explicit the method is. Continuing with the formulation of the numerical scheme, if equation 5.31 is introduced into 5.28:
|
|
(5.32) |
Acceleration at is obtained from equation 5.30:
|
|
(5.33) |
Then, expression 5.32 transforms into:
|
|
(5.34) |
The algorithm for the implicit case () can be summarised as:
- Compute and through equations 5.30 and 5.31.
- Obtain solving the system of equations stated in 5.34.
- Update accelerations and velocities using expressions 5.33 and 5.31.
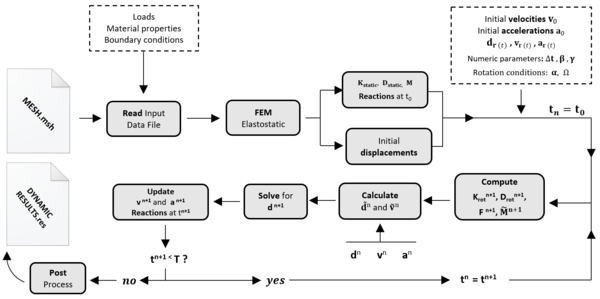
|
| Figure 5.4: Newmark -method algorithm schematisation for the case of rotating structures. |
This scheme is found to be unconditionally stable for . It is found that and yield to reasonable convergence rates. If those particular values of numeric parameters are chosen, then the scheme is known as constant average acceleration method. Recall that if , then 5.34 would be a nonlinear system of equations, which is to be tackled through numerical schemes such as Newton-Raphson. Fortunately, this is not the case of study and displacements are simply computed as:
|
|
(5.35) |
5.2.1 Timestep selection
The presented method is a practical tool that allows the solving of complex nonlinear systems. However, convergence of the solution is only granted for sufficient small values of . Its value is directly linked with the highest frequency involved in the problem. According to the Nyquist-Shannon theorem, sampling frequency needs to be at least twice the maximum frequency of the signal. In the case of study, two different phenomena are to be taken into account: vibration in the noninertial frame and rotation in the inertial one.
The period of the rotation motion, supposing constant angular acceleration and initial velocity , can be posed as:
|
|
(5.36) |
As rotations undergoing angular acceleration for a long period of time are not usual, let's consider a rotation at very high constant spin speed, say . In consequence, the sampling frequency should be greater than , and the timestep smaller than 2 . To put these numbers in context, recall natural frequencies from Figure 5.1: the third mode presented a frequency of , implying a sampling frequency greater than .
In general, vibration frequencies are higher than the rotation velocity, and thus the selection of will not be influenced by the velocity of the rotation motion. The criteria to follow when picking a sampling frequency is to ensure that it is at least twice the highest vibration frequency to capture.
5.2.2 Validation
In order to asses whether the numerical scheme is performing properly, numerical results will be compared with those obtained with modal analysis. As the latter is restricted to free undamped static structures, the case of study will involve the free vibration of the 2D cantilever rectangular beam presented in 4.7. Imagine the beam under the effect of a distributed load along its upper side, when all of the sudden the force vanishes and the structure starts to oscillate from its deformed configuration around its equilibrium position.
Although highly visual, animations are not a proper way of comparing quantitatively the two responses. Instead, the plot of dynamic displacements at different degrees of freedom will be compared for both modal and numerical cases. In fact, the nodes whose vertical displacement will be graphed are those located at the centre and tip of the mean line of the beam. The modal solution will be obtained taking into account the six first mode shapes with the lowest frequency, whereas the numerical scheme will be based on the constant average acceleration method ( and ). The selected timestep depends of the highest natural frequency to capture, which in this case is linked with the pure bending mode. Hence, . The results are compared in Figure 5.5, where dots represent the approximated numerical solution.
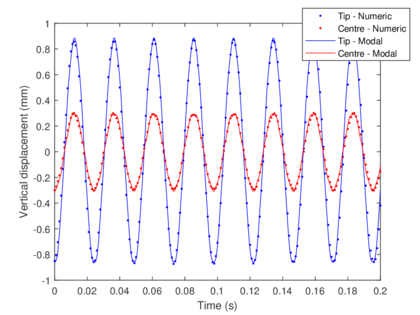
|
| Figure 5.5: Comparison of modal and numerical methods to solve the free undamped vibration of a 2D fixed-free beam. |
As can be spotted, amplitude in the tip is higher than in the centre. Furthermore, the frequency of vibration is that of the bending motion (), as was expected from Figure 5.2. The main problem of comparing both solutions is that numerical methods, unlike modal analysis, cannot filter high frequency modes. Thus, the numeric solution is always affected by high frequency components and is not capable of representing the bending motion in isolation. In consequence, modal and numeric results will only be coincident if all the mode shapes are taken into consideration and the time step is sufficiently small. Figure 5.6 compares horizontal displacements at the tip using 600 different eigenvalues, and a numeric timestep of .
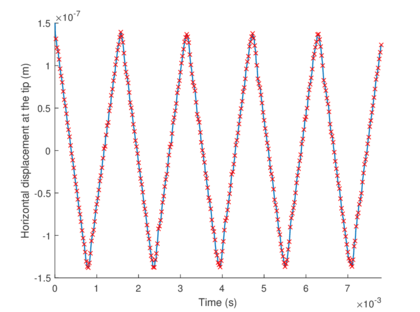
|
| Figure 5.6: Modal and numeric (red crosses) methods comparison, this time with higher accuracy. |
5.2.3 Limitations
Numerical methods allow complex and even nonlinear systems to be tackled, obtaining results with a proper degree of accuracy. Even so, one of their main drawbacks is linked with the requirement of really small time steps in order to capture structural vibrations. This implies high computation time and memory usage. Recall that in order to animate the results, displacements need to be computed for each timestep. For instance, the displacements of a 3D system with 30000 nodes studied during a timespan of with would take up 67 gigabytes of memory. In reality, postprocessing tools also require from other inputs, increasing even more the memory consumption. This makes numeric simulations of complex structures only feasible for institutions with high computational resources.
Another disadvantage of numerical schemes with respect to modal analysis is that no mode shapes nor natural frequencies are obtained. In fact, what is computed through numerical methods is the temporal evolution of the individual displacements at each degree of freedom. The whole phenomena of vibration is difficult to capture by only looking at individual graphs, so postprocessing tools use this information to create an animation of the dynamic response. But animations are not an outright solution, as no information regarding the predominating modes of the structure and its frequency are obtained.
When very different frequencies play an important role in the system, the latter has to be studied at different time scales as there will be motions with very long period coexisting with other ones which elapse very fast. The study of both motions at the same time based on animations is very tricky, and requires from patience and experience. In order to overcome this limitation, the next section reviews a promising method that captures the predominating modes and frequencies of a structure using only the raw data obtained from the numerical approach.
5.3 Singular value decomposition
The singular value decomposition, commonly referred as SVD, is one of the most versatile tools of linear algebra. It allows the factorisation of a rectangular matrix of the form:
|
|
(5.37) |
where:
- is a matrix.
- is a orthonormal matrix known as the matrix of left side vectors (LSV).
- is a orthonormal matrix known as the matrix of right side vectors (RSV).
- is a diagonal matrix known as the matrix of singular values.
The diagonal entries of are referred as singular values , fulfilling that . Quite often, the matrix of singular values is sorted in ascending order, so that . If is a real matrix, then both and are orthonormal: . An intuitive approach to SVD is to think of as a linear transformation. Then, the singular value decomposition can be though as a composition of three geometrical transformations: a rotation , a scaling or stretching and another rotation .
The SDV can be interpreted as a generalisation of the eigendecomposition, which is restricted to positive semidefinite matrices. In fact, the SVD can be split into a pair of eigenproblems:
|
|
(5.38) |
Hence, can be thought as the set of orthonormal eigenvectors of and as the set of orthonormal eigenvectors of . The singular values of are in fact the square root of the eigenvalues of both and . This property brings to light the capacity of the SVD to discover some of the same kind of information as with the modal analysis. In fact, the simplest numerical scheme to tackle the SVD problem consists in solving one of the above eigenproblems, obtaining either or as eigenvectors and as eigenvalues. Then, the remaining matrix of vectors is obtained using equation 5.37.
5.3.1 Truncated SVD
The SVD is an interdisciplinary technique used in diverse fields such as signal processing, pattern recognition, data compression, weather prediction and social-media algorithms among many others. A popular application is related with dimensionality reduction: a process through which a given matrix is approximated by a lower rank matrix . The SVD provides the best k-rank approximation to of the form:
|
|
(5.39) |
The key is to perform a SVD picking only the -largest values of . If , then the dimension of the matrices involved in the SVD problem are reduced: becomes , is now and is reduced into a matrix. The truncated version of the SVD is tackled as an optimization of the Frobenius norm of the difference between the original matrix and its approximation. Numerical schemes use a given value of tolerance to limit the truncation error.
Even considering the truncated model, computing the SVD can be extremely time-consuming for large-scale problems. One of the most used techniques to speed up the algorithm relies on block matrix decomposition. The factorisation no longer processes the whole matrix, but performs successive SVDs over smaller sub-matrices. Moreover, in this way the quality of the approximation can be controlled blockwise. These kind of method is known as partitioned truncated SVD.
To improve even more the performance of the algorithm, randomised techniques [10] are used to compute an approximation to the range of . These techniques are of special interest when the data comes from discretization of continuum systems. An intuitive approach is to estimate the range of by picking a random collection of vectors of the matrix and examining the subspace formed by the action of on each of them. For sure, randomised SVD algorithms are not that simple and require a deeper knowledge on linear algebra.
5.3.2 SVD in structural analysis
In the case of study, which is structural analysis, it is from interest to work in the basis defined by the mass matrix instead of the euclidean space. The goal is to re-express in such a way that redundancies are filtered out and actual dominant displacement fluctuation patterns are revealed [13]. In order to develop this normalisation, needs to be a symmetric positive definite matrix such that admits the Cholesky factorisation:
|
|
(5.40) |
Where is an upper triangular matrix. Then, the truncated SVD is not performed to the matrix but to the normalised matrix :
|
|
(5.41) |
Finally, the right side vectors are obtained from :
|
|
(5.42) |
Following this approach, the SVD can be posed in terms of structural analysis. The matrix is nothing else but the matrix of displacements defined in equation 5.14. Each column contains the displacements of the unconstrained degrees of freedom at a given value of time, whereas each row accounts for the temporal evolution of the displacement at a single degree of freedom. Hence, defining as the number of unconstrained degrees of freedom and as the number of time-steps into which the time domain is split, is a matrix.
From the structural analysis perspective, is a matrix containing in each column a certain combination of nodal displacement patterns which are predominating in the system as time passes by. These can be thought, in analogy with modal decomposition, as the principal modes of the structure. In reality, left side vectors are not modal mode shapes but a certain combination of the sadistically reigning ones. Hence, on now on the vectors will be referred as singular modes.
On the other hand, is a matrix each row of which contains a statistically predominant temporal evolution of the whole structure. In contrast with modal analysis, each describes a vibration motion which is not necessarily harmonic. The vectors will referred as singular oscillations.
The grace of this method is that each is linked with , allowing a certain intuition on how each of the singular modes evolves in time. Through an adequate analysis, one can find out the predominating frequencies of each singular oscillation (RSV), and consequently the vibration frequencies associated to each singular mode (LSV). Moreover, singular values give a hint on the intensity of each singular mode, allowing the truncated study of the system accounting only for the most relevant ones. The individual motions can then be animated using GID, obtaining a more clear sight of the phenomena than the one obtained with numerical integration.
As it has been pointed out, singular oscillations are no longer a pure harmonic and thus may contain the contribution of more than one natural frequency. In order to extract information regarding predominant frequencies, two numerical tools can be used. The most intuitive approach is based on looking for the local maxima of , and approximating the natural frequency as the average of the time intervals between successive maximums. The main drawback of the latter method is that if more than two frequencies are involved in the temporal description of the motion, only the highest one can be extracted from . Furthermore, the induced error on the measure of the latter is no longer negligible.
A more feasible approach consists in applying the discrete Fourier transform on using in-built functions. By doing so, the singular oscillation is mapped into the frequency domain. Predominating frequencies of each singular mode can be found by looking for the peaks on the power spectral density estimation constructed from the Fourier transform. Recall that the obtained vectors and have been scaled — in space and temporal coordinates, respectively — during the SVD, and thus information regarding the sampling frequency used during the numeric integration is needed to recover the actual frequencies involved in the vibration motion.
For sure, the development of a numerical algorithm capable of handling the truncated SVD problem in a short amount of time is far out of the scope of this report. Instead, a tool developed by prof. Hernández J. will be used to perform a partitioned randomised SVD. This software limits the number of terms of the truncated approximation by using a value of tolerance introduced by the user.
5.3.3 Validation
In order to determine whether the singular value decomposition is a suitable technique for structural analysis, its performance will be assessed by comparing the singular modes and predominant frequencies with the results obtained through modal analysis. Again, the case of study involves a 2D cantilever beam in a free undamped oscillation, as covered in 5.5. Let's consider the dynamic displacements obtained from modal decomposition as the input data matrix for the SVD. The goal is to check whether this method is able to recover the information regarding natural modes and frequencies properly.
In this particular case, the modal response has been approximated using only the six natural modes with the lowest frequency. The sampling frequency used to discretise equation 5.13 is . On the other hand, the truncated SVD will only account for the six more relevant singular modes. To help comparison with modal analysis, one may define the normalised singular values as
|
|
(5.43) |
With this in mind, the SVD and modal results are compared in the following table:
The above table reveals an outstanding degree of accuracy in the frequency determination using the SVD. The singular modes associated to the four lower predominant vibration frequencies are displayed in Figure 5.7.

|
| Figure 5.7: Singular modes associated to the first four lower vibration frequencies. |
Comparing the above illustration with natural modes (Figure 5.1), one finds out that they are recovered almost exactly. The only exception is found in the third natural mode, related with the axial deformation. In this case, neither the predominant frequency nor the singular mode match exactly with the modal results. The reason behind this discordance is that the axial mode is merely activated in a bending scenario. In consequence, being the SVD a statistical method, less reliability is to be expected when recovering the axial mode.
With all, the singular value decomposition has been proven to be a good approach in recovering relevant information from a given matrix of data. In structural analysis, it is a promising tool for obtaining the predominant motions when modal analysis is not practicable. The next chapter will cover the application of the SVD to a set of rotating scenarios.
6. Analysis of rotating beams using the SVD
Once the methodology for handling rotating structures in non-stationary regime is fully developed, it is time to tackle a few scenarios involving rotating machinery. The simulations will be carried taking advantage of the Newman- algorithm presented in the previous section, and then the SVD will used to disclose the dominant modes and frequencies of the dynamic response. The results will be compared with those obtained through modal analysis, which is restricted to non-rotating vibrations. Hence, a hint on the effects centrifugal, tangential and Coriolis forces have on rotating structures will be brought to light in this chapter.
Postprocessing of results will be carried out by GiD, which uses the generic spatial basis . The simulations performed in the present chapter will consider only variables in the local frame of reference , so although some figures incorporate a set of axes, keep in mind that they represent in fact the corotational frame.
6.1 Two-dimensional cantilever beam
The first case of study continues with the analysis of the rectangular 2D cantilever beam studied in the previous section. The beam is and modelled using 1000 quadrilateral elements. The main difference is that the beam now undergoes a rotation perpendicular to the plane, with its axis located at the centre of the fixed end of the beam. The beam is made from 6061 T6 aluminium alloy (, ), and the considered density is .

|
| Figure 6.1: Rectangular cantilever beam subject to rotation. |
The loading scenario is quite similar as the presented in 4.6: the beam is under the effect of a distributed load on its upper side (-20 kN/m), while it is rotating at a certain angular velocity. Initial displacements under these conditions will be computed using the static FEM software. The dynamic case will account for a sudden vanishing of the distributed load and the consequent vibration of the beam. This oscillating behaviour will be analysed under the effect of different angular speeds and accelerations. No internal damping will be considered in this section. For comparison purposes, the first eight natural frequencies and modes of the presented structure can be found in the report attachments (Figure D.1.1).
6.1.1 Constant angular velocity
The first analysis will involve constant angular speed. The goal is to keep track of the vibration frequencies at different angular velocities, and compare the results with the softening effect predicted by modal analysis. The imposed angular speed cannot be indiscriminately high, as deformations would no longer be considered small. Using the 1D solver developed in 4.2.2, it has been found that elastic displacements reach a 1% of the length of the beam when rpm. Hence, this value will not be exceeded in this analysis.
It is important to select an adequate timespan and timestep, as numerical results are sensitive on these parameters. The timestep is chosen depending on the maximum frequency to capture, in this case , corresponding to the eighth natural frequency. Hence, . In order to gain accuracy, the used timestep will be . To keep computation time low, the timespan will be no longer than . With these numeric parameters, and using the constant average acceleration method, the mean time of computation is around 25 minutes. Smaller time-steps or greater time-spans would be too much time-consuming.
Campbell diagram
The dynamic analysis is to be developed for three different angular velocities: 50, 100 and 200 rad/s. The SVD is truncated to the eight higher singular values. The left and right side vectors obtained for each case are displayed in D.1.2. To ease visualisation of the RSVs, each one is plotted for a certain fraction of the total timespan. The dominant frequencies are found looking for the peaks of the discrete Fourier transform of each RSV. The obtained frequencies are presented in Figure 6.2, and compared with the softening effect predicted by modal decomposition.
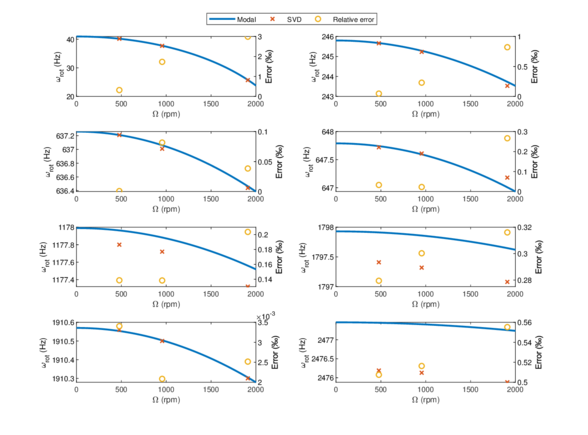
|
| Figure 6.2: Campbell diagram: comparison between modal prediction and SVD results. |
As can be spotted, in most cases the dominant frequency obtained using SVD matches almost exactly with the predicted natural frequency. In other cases (modes 5, 6 and 8), the values are not coincident but very similar (). In all likelihood, these differences can be attributed to the probabilistic behaviour of the SVD, as the numeric sample has a timespan of only . Even so, in all cases the vibration frequencies predicted by the SVD decrease with the spin speed, matching with the expected softening effect. Thereby, it can be deduced that neither Coriolis nor centrifugal forces induce a significant change in the natural frequencies of rotating beams. In the same way, by comparing the LSVs from D.1.2 with the natural modes of the beam, it can be stated that mode shapes do not either change with the angular velocity.
Recall that the obtained results shown in D.1.2 are just predominant patterns of the dynamic response. Thus, the RSVs representing reigning vibrations are no longer pure harmonics, but mostly the result of a certain combination of natural frequencies. In most cases, they match almost perfectly to a sine or cosine function, and hence the predominant frequency is easy to determine. That is not the case of the RSVs associated to axial vibrations (natural modes 2 and 7 from Figure D.1.1), which are the result of more than one predominant frequency. For instance, the pure axial motion has a Hz frequency associated to it, caused by the offset in displacements the centrifugal force induces. To visualise the frequencies involved in the vibration phenomena, Figure D.11 displays the power spectral density estimation of the sum of the right side vectors.
Singular values
Although Coriolis and centrifugal acceleration induce little changes in natural frequencies, they do change considerably the intensity in which natural modes show up. Considering the normalised singular values as the indicator of intensity, Figure D.8 shows how axial modes (2 and 7) gain intensity as rotation speed increases, whereas flexural modes weaken. This effect is caused by the centrifugal force, the responsible of axial excitation, which increases proportionally to . The numeric values of predominant frequencies and normalised singular values are presented in table D.2.
Reactions
Another interesting variable to keep track of is the reaction torque, which at last instance is the one determining the required torque to spin at the desired speed. For the presented scenario and studied angular speeds, the reaction torque is found to oscillate along with the beam, as displayed in Figure D.9.
As the motion is not under the effect of angular acceleration, no rigid body reactions are present. Thus, Figure D.9 only accounts for the elastic reactions described in 3.21. The torque is mainly induced by the effect of transverse reactions, as local horizontal reactions due to centrifugal forces produce no net torque around the specified rotation axis. Hence, the required torque is closely related with the bending modes, and thus, with its natural frequency, which decreases with . In this case, reactions are not generated by a certain applied force but as a consequence of the inertia forces induced by the high accelerations present in the vibration phenomena.
At some intervals, the required torque becomes negative: half of the time, the beam is bending in the direction of rotation, tending to accelerate the structure. Hence, the overall work is zero. This is an artificial scenario: the angular speed of actual rotors is never constant, whereas the torque injected by the driving device is in fact uniform. In real cases, the vibration of the beam accelerates and decelerates the rotation motion in a small amount (as stated in 1.2). Moreover, real rotors work within viscous fluids, which act as dampers of the vibration motion.
Displacements
Regarding dynamic results, displacements at the tip of the beam will be reviewed for different rotation velocities. Displacements in the local perpendicular direction are induced mostly by the pure flexural mode, and hence its vibration motion is easy to capture as it is associated to a low frequency. The amplitude of these displacements does not increase significantly with , but it is the decrease in frequency the most remarkable effect rotation velocity introduces. Figure D.10 presents the numeric results and their lower rank approximation computed using the truncated SVD with eight singular values.
On the other hand, axial displacements are highly dependant on , as the centrifugal force that excites axial modes increases with the square of the angular velocity. In fact, the amplitude increases by a factor of 16 when comparing Figure D.12 (a) with Figure D.12 (c). Moreover, the local horizontal displacements are linked to a relatively high frequency, and thus the truncated SVD is not capable to recreate the numerical result exactly. This issue is easily overcome by decreasing the value of tolerance of the SVD.
Stresses
In structural analysis, one of the most usual parameters used to determine whether the structure is going to fail or not is the security factor. In this example, computation of stresses is quite straightforward, as no internal damping is considered. Stresses and strains are obtained directly from the numerical scheme, but unlike displacements, they are not passed into the SVD for dominant patterns recognition. When dealing with stresses, their distribution is not so important as it is the peak value, from which depends the security factor. Figure 6.3 displays the peak values of , and as time passes by for the most favourable case ( rad/s).
From Figure 6.3, it is found that maximum stresses oscillate at twice the natural frequency of the flexural mode. That is caused by the fact that maximum stresses take place at maximum deformed configurations — highest strains — which occur two times per oscillation. For the used aluminium, the yield strength is around 276 MPa [14], and so the security factors are 50, 13, and 4 for 0, 50 and 100 rad/s, respectively.
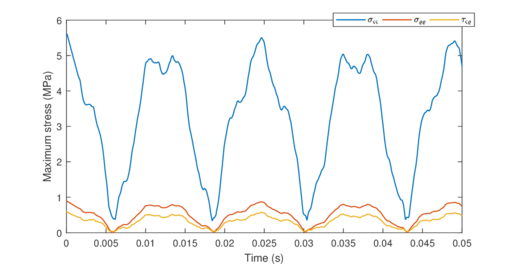
|
| Figure 6.3: Temporal evolution of the maximum stresses (absolute value) for = 50 rad/s. |
Results animation
To close down this section, the outputs from the dynamic analysis will be animated through . However, postprocessing is a heavy task for computers with humble computation capabilities, as results are encoded in ASCII. For that reason, only the case corresponding to rad/s will be dynamically animated. To simplify the animation, the deformed configuration will be displayed in the rotating frame, and only stresses in the local horizontal direction will be represented through a colour map.
During the bending motion, one expects to found a symmetric distribution of stresses with respect to the beam's axis: one side under traction and the other under compression. Figure D.13 shows how this symmetry is broken in rotating scenarios, as the centrifugal force introduces an axial displacement proportional to the distance from the rotation axis that counteracts the compressing stresses.
6.1.2 Constant angular acceleration
The second and last analysis regarding the rectangular cantilever beam accounts for the effect of a constant acceleration. Recall that angular acceleration was neglected in modal analysis, as variable rotation speed is not compatible with its formulation. Hence, this analysis aims to unfold the effect angular acceleration has on rotating structures. For the sake of simplicity, only two simulations will be carried out, corresponding to and . In both cases, the initial angular velocity will be .
The numerical parameters will be the exact same as in the case of constant spin speed. Thus, the timespan will not be large enough for the angular acceleration to introduce significant changes in angular velocity — in the case of higher acceleration, . For this reason, no Campbell diagram will be represented, as the softening effect induced by will be relatively small and difficult to measure. Remember that the rotation stiffness matrix is proportional to:
|
|
(6.1) |
Thus, as , no significant effect is expected. The first difference with the previous case is the tangential force introduced by , acting perpendicular to the beam. In consequence, the flexural mode is highly activated when angular acceleration is present. In fact, the flexural motion is so predominant that the SVD is no longer capable of extracting neither the natural frequency nor the mode of the axial vibration. Figure D.16 reveals how the second predominant mode from SVD now corresponds to a combination of both axial and perpendicular displacements. Intensity of axial modes (three and seven from Figure D.1.1) decreases with angular acceleration, as shown in Figure D.18, that compares normalised singular values of different natural modes for different values of .
Notice that the truncated SVD is not capable of recovering the seventh natural mode when . In fact, in this case the seventh and eight LSVs are the same and correspond to the eight natural mode . Predominant frequencies and singular values obtained are summarised in Table D.3.
Displacements
Again, displacements at the tip will be considered representative of the vibration phenomena. Displacements in the perpendicular direction oscillate at the first natural frequency, but this time the vibration is not around zero but to a new equilibrium position which depends on the magnitude of the applied tangential force. The higher the angular acceleration, the more deformed the configuration at equilibrium will be. This behaviour can be spotted in Figure D.19.
On the other hand, axial displacements are relatively smaller (one order of magnitude below perpendicular ones). They oscillate at two different frequencies, corresponding to the flexural and axial natural modes. It is worth pointing that, as the angular velocity increases with time, so does the centrifugal force. For that reason, the mean value of local horizontal displacements increases with time, as captured by the second RSV in Figure D.17. The rate of this rise is proportional to the angular acceleration. This effect can be identified in Figure 6.4, where horizontal displacements are represented. The increase in length of the beam during the analysed timespan are and mm for and , respectively. If the angular acceleration (for instance ) persisted in time, that would result in an increase of half millimetre in the beam's length every second.
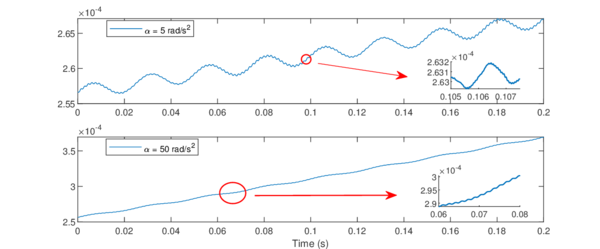
|
| Figure 6.4: Local horizontal displacements (m) at the tip of the beam for different values of angular acceleration. |
Reactions
As in the previous case, the obtained reactions are those the driving device must inject into the structure to ensure the desired acceleration. In this case of constant , the elastic reaction torque oscillates at the bending frequency, but with a mean value different from zero as the equilibrium position of the beam is no longer the horizontal configuration. Figure D.20 displays how the mean value of elastic reaction torque increases with .
It is worth pointing that, in the case of variable angular speed, a rigid body motion must be taken into account and added to the previous one, as stated in equation 3.2.3. In this case, the rigid body torque is constant:
|
|
(6.2) |
This constant value is to be added to the elastic torque from D.20, which is significantly smaller. Recall that this is not a real scenario, as the kinematics of the motion are often the unknown rather than the input parameter. The required power the driving engine must provide is given by the product of the total reaction torque (rigid body and elastic) by the instantaneous angular velocity .
Stresses
In order to validate structural reliability, one needs to focus on the study of stresses, which determine the security factor. Again, as no internal damping is considered, computation of stresses is done as in the static scenario. For simplicity, only peaks values will be considered in this section. As expected, stresses increase with , although they are most sensitive to a change in angular velocity. Figure 6.5 reveals how stresses in the local horizontal direction are the higher ones, and oscillate in the flexural natural frequency. The peaks in stresses correspond to the maximum deformed configurations.
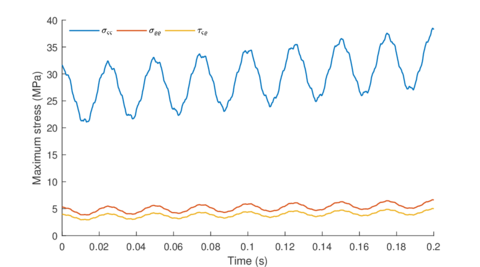
|
| Figure 6.5: Temporal evolution of the maximum stresses (absolute value) for = 50 rad/s and = 50 rad/s. |
It is worth pointing that the mean value of increases with time, consequence of the increasing centrifugal force that is acting on the structure. Although only absolute values are represented in Figure 6.5, looking into the dynamic results (Figure D.21) one finds out that traction stresses are the most relevant contribution. As seen in the previous case, centrifugal force tends to pull the beam decreasing the effect of compression stresses.
Results animation
To ease visualisation of results, dynamic displacements and stress distribution will be animated in the rotation frame trough GiD. Only the case of higher angular acceleration ( rad/s) is presented in Figure D.21. The animation captures one oscillation of the beam, with a timespan of 25 ms. As commented, higher stresses are found in the most deformed configurations of the beam.
6.2 Three-dimensional cantilever beam
For the next case of study, a new geometry will be defined. In order to keep the problem simple, a cantilever beam will again be the structure to study. In this case, however, the beam is modelled in three dimensions using 3200 hexahedral elements. The beam is , with a thickness of . Again, this study considers that the structure undergoes a rotation in the vertical -- axis. The material from which the beam is made of is aluminium, with a density , a Young's modulus and a Poisson's coefficient .
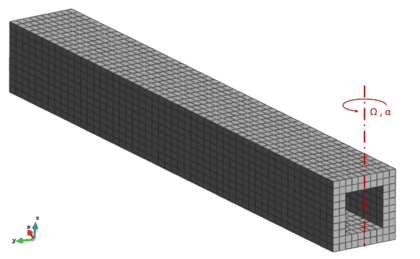
|
| Figure 6.6: 3D cantilever beam subject to rotation around the vertical axis. |
The loading scenario is the following: the beam is rotating at a given angular speed, subjected to rad/s, when the angular acceleration vanishes instantaneously and so does the tangential force. This section will analyse the vibrations this sudden stop in acceleration induces, for different values of angular speed . Again, no source of damping will be considered. In contrast with the last analysis, this time the weight of the beam will be taken into consideration, and supposed constant and negative in the axis. For comparison purposes, the first eight natural frequencies and modes of the presented structure can be found in D.2.1.
6.2.1 Constant angular velocity
For the sake of simplicity, the presented geometry will only be studied for the case of constant angular velocity. In fact, the dynamic behaviour will be analysed for three values of : 25, 50 and 100 rad/s. The goal is to keep track of the vibration frequencies using the truncated SVD as increases. For the numerical computations, the used timestep will be . To keep computation time low, the timespan has been selected in order to capture a full oscillation of first natural mode, so . For this case, the truncated SVD will compute the eight highest singular values and their associated LSVs and RSVs.
Campbell diagram
One of the main applications of the truncated SVD is to recover predominant frequencies of the dynamic vibration motion. The goal is to recover these frequencies for different values of applying the discrete Fourier transform to each RSV. Recall that in the 2D case, predominant frequencies were compared with the softening effect predicted by modal analysis (see equation 5.25 ). However, this approach is not possible in three dimensions as the rotation stiffness matrix is no longer proportional to the mass matrix. The eigenvalue problem admits no further simplification than:
|
|
(6.3) |
The only way to keep track of the natural frequencies as angular velocity increases is by solving the previous equation for different values of , obtaining numerically the desired Campbell diagram (). By doing so, it is found that in most cases natural frequencies decrease in the same way as they did in 2D. The biggest difference is that in three dimensions, natural frequencies linked with modes acting in the direction — the rotation axis — decrease much slower and in a different pattern.
This effect is displayed in a Campbell digram in D.29, where modal prediction and SVD results are compared. It is worth pointing that, in still conditions, natural modes and frequencies appear in pairs, as the beam is symmetric with respect to the and planes. However, as rotation velocity increases, vibration frequencies of the modes acting on and diverge, as their decrease rate is not the same (see vs in D.29).
Recall that one of the advantages of the SVD with respect to modal analysis is that it accounts for the effect of Coriolis, centrifugal and tangential forces. On the other hand, its main drawback is that as it is a probabilistic method, great timespans and small timesteps are needed to get a reliable value of predominant frequency. Nonetheless, the results displayed in D.29 agree () with the predicted softening effect. It is found that the more intensively a mode is activated, the greater the accuracy in which the SVD can extract its predominant frequency. The RSVs from which the predominant frequency has been obtained are plotted for different values of in D.24, D.26 and D.28.
Another limitation of the SVD is that it is not able to isolate natural modes. The LSVs the SVD computes are just predominant patterns, which quite often correspond to the combination of two or more natural modes. Figures D.23, D.25 and D.27 — which represent the predominant modes of the beam for different values of — evince for instance how the first predominant mode is in reality the combination of two natural modes: axial in () and bending in (). The higher is, the higher contribution the axial mode has, as centrifugal forces increase with whereas weight is constant.
Displacements
Once more, displacements at the tip — upper side, at half the thickness — will be considered representative of the vibration phenomena. This time there is not a predominant direction in which displacements are considerably greater than in the others. Displacements in the axis are those with the lowest frequency and linked with the natural mode (see D.2.1), as the beam was under the effect of a transverse force which vanished at , oscillating thus around the equilibrium position (Figure D.30).
The structure undergoes as well a bending in the vertical direction , but with a much higher frequency and a considerably smaller amplitude of oscillation. This effect is produced because, unlike in the direction, the distributed force in — the weight — does not vanishes but remains constant as time passes by. Hence, vibrations in the vertical axis are not caused by the bending mode but are the result of higher frequency modes. Even though vibration amplitudes are relatively small in , displacements on this axis have a considerable offset induced by the weight, as can be spotted in Figure D.31.
A similar offset is found in the axial displacements, induced by the constant centrifugal force. As in the vertical direction, displacements in are subject to high frequency vibration, but to small oscillation amplitudes. One of the vibration frequencies corresponds to , as bending in also causes a small displacement in . For sure, there is as well a component linked with the axial mode , but its amplitude is considerably smaller. These three effects — offset, and — can be easily identified in Figure 6.7.
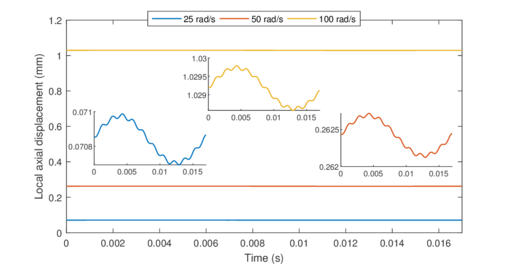
|
| Figure 6.7: Temporal evolution of displacements at the tip of a cantilever beam under constant angular velocity. |
With no surprise, all displacements increase (in absolute value) with , being the ones in the more susceptible to changes in angular velocity, as the centrifugal force that acts in the axial direction is proportional to .
Reactions
From a dynamic point of view, it is always interesting to keep track of the elastic reactions. Remember that like in the previous case, the beam is considered to rotate at a given angular speed, set by the driving device (recall the assumptions made in 2.1). This implies that no matter how great the deformations are, the device will always inject the necessary torque to ensure the desired kinematic conditions. Although it is an artificial scenario, it allows uncoupling of rigid body and elastic equations, simplifying considerably the dynamic study.
In this particular case, the elastic reaction torque in oscillates with the frequency linked with the transverse motion, the most predominant one. The latter result is quite intuitive: the more deformed the configuration is, the more torque is required. When the deformation is in the direction of rotation, the reaction torque becomes negative. This oscillation in the torque is not caused by the effect of any real force, but because of the inertia induced by accelerations. On the other hand, the biggest component of the torque is actually constant, and produced by the centrifugal force. Thereby, the mean value of the elastic reaction torque in the rotation axis increases with , as graphed in Figure D.32.
Stresses
Once more, validation of the structure relies in the study of stresses. In order to simplify the analysis, only the maximum absolute value of stress has been dynamically tracked. Without considering any source of internal damping, these values are found to oscillate at twice the frequency of the flexural motion. Recall that stresses and strains adopt its higher value at maximum deformed configuration, which takes place twice per period. With all, it has been found that like in the 2D case, the higher stresses are those in the direction of the centrifugal force — that is, . Maximum stresses for rad/s are represented in Figure 6.8.
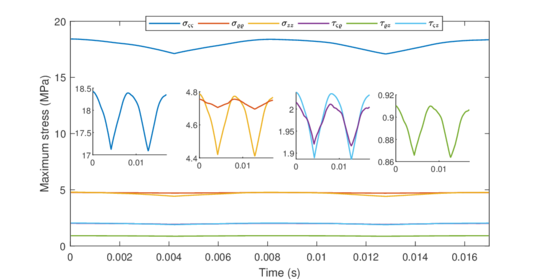
|
| Figure 6.8: Temporal evolution of the maximum stresses (absolute value) for = 50 rad/s. |
In 3D cases where six different components of stress play a significant role, its worth considering the equivalent stress. Using the Von Mises yield criterion for beams and considering a 6061 T6 alloy, it is found that the security factor of the structure is .
Results animation
The dynamic results have been postprocessed and animated using GiD. The deformed configuration and the stress map for different timesteps are presented in Figure D.33. For the sake of simplicity, only stresses are coloured. Regarding displacements, it is relatively difficult to keep track of the bending motion in , as axial displacements are considerably high and eclipse the flexural vibration.
So far, the presented chapters encompassed a relatively abstract subject, and has only been put in practice to test the capabilities of the SVD in beam analysis. The proposed cases where artificial scenarios that could be easily studied by following the hypotheses posed in 2.1. The aim of this chapter is to modify the developed numerical tool in order to tackle a case of aeronautical interest, which is the starting of an helicopter rotor.
7.1 Case of study
The main goal of the presented chapter is the study of the dynamic behaviour of an helicopter's rotor during the starting of the engines. That is, the blades will start from idle configuration and will end rotating at its design angular velocity. Helicopter dynamics is a wide and complex subject combining both structural analysis and aerodynamics. As the understanding of the whole phenomena is not the goal of the present report, the following hypotheses will be assumed:
- Blades will be modelled as two-dimensional structures. Three-dimensional effects (structural and aerodynamic) will be neglected, as well as gravity forces.
- Rotation axis is fixed and perpendicular to the plane of the blade.
- The fluid will not be simulated but rather aerodynamic forces will be modelled.
- The rotor will produce zero lift, and thus, no induced velocity along the span of the beam will be generated. Parasite drag is the only aerodynamic force acting on the rotor.
- The helicopter is performing hovering flight with no wind speed.
- The blade is fixed-free: no articulated parts are considered. Hence, the mechanical twist angle will always be zero.
The rotor is made of three equally distributed blades, whose geometry is defined in Figure 7.1. The radius of the blade is , whereas the chord is and at the root and the tip, respectively. The maximum chord is and its located at the 8% of the span. The total surface of the blade is . The blade has been modelled using a CAD software (SolidWorks) and then exported to GiD to proceed with the mesh generation. Its geometry is defined in Figure 7.1.

|
| Figure 7.1: Geometry and of a 2D blade. |
In order to mesh the above geometry using only quadrilateral elements, the blade needs to be modified. By eliminating curves and roundings, the blade is discretised using a structured mesh made of 1340 elements (Figure 7.2).

|
| Figure 7.2: Structured mesh of a simplified 2D blade. |
In three dimensions, the blades can be thought as an extrusion of a NACA 0012 airfoil, whose cross section has been computed integrating the profile shape [15]. To approximate the superficial density of the blade, it will be considered that its total mass is one fifth of the mass of a solid aluminium blade:
|
|
(7.1) |
Regarding the driving device, it will be supposed that the helicopter has an alternative engine able to inject power to the rotor. As engines cannot produce power when the angular velocity is zero, an electric motor will be used to generate a torque that starts the rotation motion. Remember that the power of a rotating object is given by:
|
|
(7.2) |
Where is the torque produced by the device. To avoid sudden jumps in the variables, neither the torque nor the power will be injected instantaneously. Instead, they will vary from an initial to a final value describing a sinusoidal shape:
|
|
(7.3) |
and are the initial and nominal values, respectively, of torque generated by the electric motor. The motor reaches the nominal value of torque at , and maintains it constant until , when the engine starts operating. To avoid discontinuities in the injected power, the following statement has to be met:
|
|
(7.4) |
The engine starts to operate at and reaches its design value at , maintaining this value constant for further values of time until normal flight conditions are reached (Figure 7.3). No automatic control that regulates the power as a function of the angular velocity is taken into consideration.
7.2 Rigid-elastic coupling
Unlike in previous chapters, kinematics of the rotating motion are no longer known. This implies breaking the first hypothesis defined in 2.1, and thus, the developed model is no longer applicable. In previous cases (see 6), angular velocity and acceleration were known at every time, being the reaction forces the unknowns. In this case, what is known is the power provided by the engine, whereas the unknowns are the angular variables , and . This is a major change in the problem formulation, as rotation and vibration motions become coupled. From solid mechanics, it is found that the relationship between the torque and the angular velocity of a rigid body is given by:
|
|
(7.5) |
Where is a generic point where the torque is to be evaluated, is the inertia tensor of the solid with respect to , is the vector of angular velocities, the linear acceleration of the point and the vector pointing from to the centre of mass of the solid. If the inertia matrix is posed in such a way that is constant in time, the above expression transforms into Euler's equations for rigid bodies (see 1.2). Luckily enough, with the assumed hypotheses, the torque equation can be expressed as stated in 3.22:
|
|
(7.6) |
And taking into account that results from the contribution of the torque generated by the engine and the elastic reaction torque induced by the structure:
|
|
(7.7) |
And recall how the elastic reaction torque was computed:
|
|
(7.8) |
Accounting only for the torque in the rotation axis, and including equation 3.21 equation 7.2, we arrive at:
|
|
(7.9) |
The main obstacle in the resolution of the above system is that all , and depend on both and . Moreover, the way in which the previous matrices are defined (see 3.13) make the equations highly nonlinear in and . Hence, a proper numerical method has to be proposed in order to tackle the presented system of non-linear differential equations.
7.3 Numeric integration
In the context of coupled rigid-elastic dynamics, the unknowns are the vectors , and regarding the vibration motion, and the scalars , and regarding the rotation motion. Using the presented Newmark -method, the previous system of differential equation can be transformed into a system of algebraic equations. The transformation this method proposes has already been reviewed in 5.2 for the elastic variables, and the only thing left is to apply it to the angular variables:
|
|
(7.10) |
Hence, what is left is a system of non-linear algebraic equations with the unknowns and . This problem could be tackled through a non-linear solving algorithm such as Newton-Raphson, widely used in computational mechanics. It is an iterative procedure based on the solving of a sequence of linear models [12]. The Newton method can in fact be applied to arbitrary systems of algebraic equations with unknowns. However, its implementation is not an easy task and requires a great understanding of algebra. Moreover, as it is an iterative algorithm, it requires the different matrices to be computed more than once at each timestep, increasing considerably the computation time.
A simpler approach is based on the explicit central difference scheme, which computes accelerations at and uses this value to update velocities and displacements at . Although very easy to program, explicit methods require from very little timesteps to ensure conditional stability. Thus, computation time will arise with respect to the previous case of known kinematics. The general algorithm can be summarised as:
- Obtain solving the system of equations stated in 5.34 (using and ) .
- Once displacements at are known, compute the elastic reaction torque from 7.9.
- Find from equation 7.7 and update using expression 7.10.
The initial value of angular accelerations is found by solving the non-linear algebraic equation that involves initial conditions , , and . As is the only unknown, the equation is solved by using a simple fixed-point iteration, using as initial guess . It has been found that four iterations suffice to obtain a converged solution.
7.4 Aerodynamic forces
Performing a simulation that accounts for fluid-structure interaction is far out of the scope of this section. Instead, the aerodynamic forces acting on the blade will be modelled using simplified aerodynamic relations. As the rotor is modelled in two dimensions, no forces acting perpendicular to the plane will be taken into consideration. Following the hypotheses presented in 7.1, the only force acting on the rotor plane is the parasite drag.
This aerodynamic resistance force depends on many parameters, such as the angle of attack, the surface roughness of the blade, the Mach number and the Reynolds number — a non-dimensional parameter that measures the strength of inertial forces of the fluid with respect to viscous ones. In order simplify things up, the effect of the latter variables will be encapsulated in a non-dimensional drag coefficient, , which will be considered known. Otherwise, this analysis would be impracticable. The drag differential () acting on a surface differential () of the blade is given by:
|
|
(7.11) |
Where stands for the relative velocity of the surface differential with respect the fluid. As the blades are rotating in a plane, their solid rigid velocity is proportional to , where stands for the initial position. Taking into account the velocity induced by the elastic vibrations, and the change in radial position due to elastic displacements:
|
|
(7.12) |
As the geometry is 2D, the drag force can be modelled in terms of the FEM as a body force, proportional to the area of each element. In three-dimensional problems this approach would not be correct, as aerodynamic forces only act on the surface and hence are to be modelled as boundary tractions. With this in mind, the term is to be inserted as a body force in equation 3.13. As a result, the following expression is obtained:
|
|
(7.13) |
The problem is that from will not only emerge components proportional to and , but also non-linear terms such as , and . The responsible for these nonlinearities to appear is the term defined in 7.12. To make the problem more attainable, it will be supposed that and . Moreover, air density and drag coefficient will be considered constant along the domain. These hypotheses allow to be simplified as:
|
|
(7.14) |
The above integral is decomposed into elemental matrices as reviewed in B, and computed using Gauss Quadrature. The major drawback of this simplified scenario is that drag forces no longer account for the effect of vibration, and thus air does not damp oscillating motions. In order to overcome this limitation, internal Rayleigh damping will be taken into consideration (recall equation 3.15). This cushioning will induce a new sources of stresses as expected from equation 2.15:
|
|
(7.15) |
To close down this section, let's make an estimation of how much power is required to compensate the parasite drag when operating at nominal speed, say 400 rpm. Considering a constant chord , the power the aerodynamic resistance of each blade induces is:
|
|
(7.16) |
Considering flight at sea level (), a mean chord and a drag coefficient , each blade requires from to surpass aerodynamic resistance. Nevertheless, the engine will need to inject more power to counteract the elastic reaction torque.
7.5 Rotor starting simulation
Once the FEM software is updated with the developed models from the previous sections, it is time to test it out simulating the starting of a rotor blade. Imagine that the studied helicopter has the following properties:
- Number of blades: 3
- Mean chord: 0.45
- Nominal speed: 400 rpm
- Motor nominal torque: 180 kN m
- Engine nominal power: 580 kW
- Nominal torque given at: = 25 ms
- Engine starting time: = 50 ms
- Nominal power given at: = 120 ms
From basic helicopter theory, it is found that for hovering flight, a simple approximation of the power required to compensate the weight is:
|
|
(7.17) |
Hence, considering an helicopter with a mass , the power required to ensure hovering conditions at sea level is . Subtracting this value to the nominal power, it is found that the available power to counteract the elastic reaction torque is around per blade, which is higher than the parasite power induced by aerodynamic drag obtained in equation 7.16.
To be conservative, it will be supposed that the engine is not operating at nominal power but at its 60% ( per blade). Regarding the electric motor, it will be considered that at the beginning of the rotation motion the blades are undeformed, and hence all the torque — 60 kN m per blade — is used to accelerate the rotor. For sure, this development is an oversimplification of the real scenario, but still is good enough to provide a glimpse on how the blade dynamically behaves.
As the numerical integration requires from very small timesteps (), the timespan is limited to s. To reduce computation time, stresses will only be computed every 20 timesteps. Dynamic displacements will also be saved at the same rate to reduce memory consumption. The integration is going to be performed using the constant average acceleration scheme. The considered structural Rayleigh damping is given by and . With these inputs, the simulation takes up to three hours to complete.
The full results of the simulations are presented in the appendix (section D.3). The temporal evolution of the presented variables is closely linked with the way torque is injected into the blade, as angular accelerations are proportional to it. Different input torque will result in a completely different dynamic behaviour of the blade. For the studied case, torque and power are displayed in Figure 7.3.
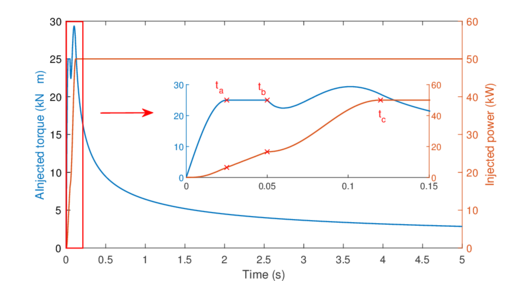
|
| Figure 7.3: Injected power and torque as a function of time. |
Considering displacements at the tip of the blade as representative from the vibration motion, it is found that the blade is not undergoing continuous oscillation around and equilibrium configuration. Although it is true that oscillations are governing at the very beginning, displacements in tend to reach a non vibrating steady state. This effect was not sighted in previous simulations, where vibrations persisted in time. In all likelihood, the reduction of high frequency vibrations is induced by the structural damping acting on the blade. In fact, the SVD has been able to recover predominant damped oscillations — see RSVs 3 and 4 in Figure D.37 — that would otherwise be impossible to spot.
Much the same can be said about local axial displacements, but this time their tendency is not towards equilibrium but into a raise in time. This same behaviour has been spotted in earlier simulations, as the centrifugal force inducing axial displacements increases with . Both displacements in and angular speed are compared in Figure D.34.
Regarding the forces acting on the blade, there is a considerable peak at the beginning of the rotation motion, when the motor is injecting torque to the standstill rotor. During these first instants, all forces, accelerations and even stresses undergo oscillations. As time passes by and the engine achieves its nominal conditions, both reaction forces and accelerations stabilise into a considerably lower value. The only exception has to do with the torque induced by aerodynamic drag, that increases with the angular speed. In Figure D.35, angular acceleration is graphed along with the reaction torque, showing how acceleration increases when reactions decrease.

|
| Figure 7.4: Deformed configuration () and (KPa) of the blade for the moment of maximum stress. |
When reviewing maximum stresses, it is found that the peaks correspond to the maximum deformed configuration. Again, this value reaches a steady condition as time passes by. What it has been found when carefully checking the results is that, after a few seconds, stresses tend to raise again. This effect is caused by the increase of aerodynamic drag, that induces forces proportional to . This same condition is found in transversal displacements, hinting that there is a certain value of angular speed at which stresses and deformations are minimum. This effect can be spotted in Figure 7.5, where these minimums are represented with a red cross.
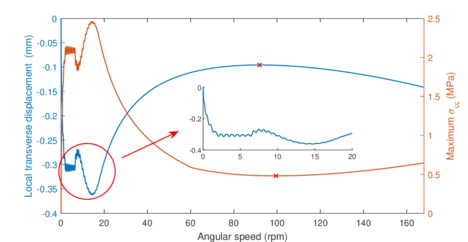
|
| Figure 7.5: Temporal evolution of displacements at the tip of the beam and maximum . |
It is worth pointing that in the simulated timespan, the angular velocity of the rotor has not reached its nominal value, but further timespans are far too restrictive in terms of computation time. The rotor would eventually surpass the nominal speed, as no control mechanism has been considered. To overcome this issue, injected power needs to be reduced when approaching the desired conditions.
8. Closure
Rotordynamics has been a field of great interest for centuries, being credited for the huge improvement in rotating machinery since the industrial revolution. Modern rotating components such as turbines, rotor blades and engines are still being designed using classical models developed centuries ago. What really created a game-changing shift in rotordynamics was the emergence of numerical methods in the earlier sixties. Implementation of the FEM gave rise to a completely new approach for structural analysis, allowing complex geometries to be solved in very short amounts of time.
Nowadays, the use of numerical software in structural analysis is a quite common solution. Despite of the great improvement in numerical capabilities over the last years, the FEM still requires from great processing power to perform complex simulations. Hence, it is not surprising that the actual tendency goes in the direction of more efficient methods instead of more accurate models. In this context, the present report has reviewed some of the available numerical tools to tackle the equations describing the vibration behaviour of a rotatory blade.
This thesis started with the elastic modelling of a simplified rotor blade undergoing one great rotation. The model supposes small strains and neglects the gyroscopic effect. When the obtained equations are posed in terms of the FEM, a softening effect is unfolded. The latter effect causes natural frequencies to decrease with rotation speed. However, real rotors do not exhibit this behaviour, but instead are affected by an opposite stiffening effect. Hence, the simplified model is not capable to capture the complete vibration phenomena, but even so it is a great tool that offers a glimpse on how rotordynamics solvers work.
For the static case, the developed FEM tool has proven to provide correct results, as it has been validated with analytic expressions. Regarding the dynamic scenario, the present work has focused on the numeric methods itself rather than on the description of the physical model. The goal of this thesis is not to bring to light new discoveries in the field of rotordynamics, but to give a glimpse on how numeric schemes work and in which way could they be more performing. The problem with structural analysis is that the governing equations rapidly become nonlinear, being numerical integration the only possible path to handle them.
For that purpose, a numerical scheme based on the Newmark- method has been developed to study the dynamic response of rotating structures. It has been found that the rotation condition increases considerably the computational costs of the simulations, as matrices linked with rotating effects need to be computed and assembled at each timestep. In order to reduce simulation times, a more efficient assembly method has been used instead of the traditional approach, leading to an increase in performance by a factor of 15.
On the opposite side, when the physics describing the dynamic behaviour of a system are simple, modal decomposition analysis can be used to study its vibration behaviour. Modal analysis is a widespread tool that unfolds relevant information about the system with low computation costs. In structural analysis, modal decomposition is used to recover natural frequencies and mode shapes. The biggest drawback of this method is its inherent limitation to work only with simple dynamic systems.
Being aware of this situation, the truncated SVD has been found to be an alternative method that combines both numerical integration and modal decomposition to recover predominant patterns of the dynamic behaviour of the structure. If applied to structural analysis, it has been proven to recover predominant modes and frequencies of the system with great accuracy. The studied cases implied 2D and 3D rotating cantilever beams, although it could be extended to any arbitrary geometry. In order to recover oscillation frequencies from predominant patters, the developed method uses the discrete Fourier transform to catch the higher components in the frequency domain. One has, however, to keep in mind that the SVD is a probabilistic method, and thus gains reliability as the size of the sample increases.
The reader could come to think that the SVD entails no real advantage, as the input data matrix is still computed using numeric integration. Nothing further from the truth: the proposed method allows a deeper understanding of the vibration phenomena as it breaks up the whole problem into simpler components, easier to interpret and to postprocess. The postprocessing becomes thereby much simpler and faster, as the complete behaviour of the structure can be decomposed into a linear combination of predominant modes and frequencies. Hence, the problem numerical integration has about encountering multiple time and space scales in the postprocessing step is overcome. This make results analysis an easier and quicker task for the engineer, reducing both the time and computation resources consumed.
When testing the SVD in rotating beams, it has been found that the method is able to keep track of the softening effect predicted by the model. This capacity of capturing the reduction in vibration frequencies as angular velocity increases would be unthinkable through traditional approaches. Moreover, it has been spotted that the dynamic displacements can be approximated using only a few singular values, allowing an extensive reduction in postprocessing requirements.
In order to locate the developed work in the context of aerospace engineering, the built software has been adapted to work together with a rigid body model. This has allowed the transient study of the starting of an helicopter's rotor, giving plausible results and proving the actual capabilities of the method. When thinking about the potential capabilities of the SVD in structural analysis, it is too soon to reach a conclusion. The work is still in a very early state, and much investigation needs to be carried in this subject. This report has only accounted for a very simple rotor model, so nothing can be said about the validity of the results as there is no way they could be compared with empirical data. Until the proposed method is further developed, the present thesis will remain as a theoretical but plausible approach for real rotordynamics studies.
A. Theoretical frame
A.1 Introduction to elasticity
A.1.1 The elastic problem
Fundamentals of Theory of Elasticity date from the seventeenth century, back when Robert Hooke posed the law of elasticity, which states that the stretching of a solid is proportional to the force applied to it. This law was latter generalised to three dimensional bodies by Cauchy, introducing six components of stress , linearly related to six components of strain . Cauchy was the first to introduce the notion of stress at a point, given by the tractions per unit area across all plane elements trough the point.
This linear behaviour of deformable bodies is governed by 15 coupled partial differential equations, first derived by Navier. Even today, no closed form of the solution exists, even for simple structures. Elasticians have used energy principles to tackle this problem, which have become a fundamental tool to study elastic bodies, including those problems involving vibrations (see A.2). The Navier-Cauchy equations are [1]:
Equilibrium equations:
|
|
(A.1) |
Strain displacement relations:
|
|
(A.2) |
Compatibility relations:
|
|
(A.3) |
Equilibrium equations are obtained considering a general state of stress at an arbitrary point in the deformable body through an infinitesimal approach (Figure A.1). Note that shear stresses are represented with a . If one approximates the spatial variations of the stresses in terms of first-order Taylor series, the resulting equilibrium equations are the ones posed in equation A.1. The strain-displacement equations link both strain and displacement field, defining the second as the derivative of the first. However, this is not enough, as another condition needs to be met: the body is still continuous after the deformation. The latter is ensured by the compatibility relations, which involve second derivatives.
![General stress state for a 3D deformable body [16]](/wd/images/thumb/c/c2/Draft_Samper_691820313-monograph-stress_state.png/372px-Draft_Samper_691820313-monograph-stress_state.png)
|
| Figure A.1: General stress state for a 3D deformable body [16] |
A.1.2 Generalised Hooke's law
Robert Hooke was one of the first scientists to notice elastic behaviour of materials. He studied springs under traction and compression, and tried to pose an equation linking both the applied force and the elongation of the spring. He discovered that, for small deformations , the required force was , where is a constant characteristic of the spring. This law was later generalised to describe elastic objects in general, posing that the strain (that is, nondimensional deformation) is proportional to the stress (that is, force per unit area) applied to it.
Remembering the equations from the previous section, one can realise that general stresses and strains have multiple independent components, and thus the proportionally factor is no longer a single value, but a tensor. The tensorial form of Hooke's law introduces a concept that might not be intuitive: some elastic bodies deform in one direction when subjected to a force with a different direction. In such cases, proportionality will hold: if the directions are not changed, the deformation will increase proportional to the applied force. For that cases, the formulation in three dimensions has the following vectorial form:
|
|
(A.4) |
When moving from a discrete spring to continuous media, the formulation changes a little as the strain and stress state around a point cannot longer be described by a vector as all pushing, pulling and shearing effects have to be taken into account. This complexity is captured using a second order tensor, and in the tensorial formulation, forces and displacements are replaced by stresses and strains, respectively. In a Cartesian base, stresses and strains are represented with a first order tensor each:
|
|
(A.5) |
Stress and strain tensors vary from a point to another inside continuum materials: gives information about the displacements in the neighbourhood of the point, while stands for the forces per unit area that neighbouring parcels exert on each other. The tensor linking and is known as the elasticity tensor , represented by a matrix of 81 real numbers :
|
|
(A.6) |
Due to inherent symmetries of the model, the elasticity tensor can be reduced to 21 independent coefficients, while and are found to be symmetrical matrices ( and ), having thus only 6 independent values. In this context, the Voigt notation is introduced: strain and stress tensors are substituted by vectors including only independent coefficients. For the case of shear strains, they are substituted by engineering strains in Voigt notation ( ) :
|
|
(A.7) |
In the above equation, stands for the symmetric gradient operator, which in 3D Cartesian coordinates adopts the following form:
|
|
(A.8) |
For the case of isotropic materials —that is, uniform properties in all directions—, it can be found that the elasticity matrix depends only on two coefficients, the Young's Modulus (standing for the material stiffness or resistance to be elastically deformed) and the Poisson's coefficient . The latter is the negative of the ratio of transverse strain (unit lateral contraction) to axial strain, and the responsible for the Possion effect: the phenomenon in which a given material tends to expand in directions perpendicular to the direction of compression, and to contract in the directions transverse to the direction of stretching [16].
The Young's Modulus has units of pressure, while the Poisson's coefficient is dimensionless, and theoretically limited to the interval , although in reality only positive values of are found. However, is commonly expressed as a function of the Lame parameters and . In indicial form:
|
|
(A.9) |
In Voigt notation and for isotropic materials, Hooke's law adopts the form
|
|
(A.10) |
The same can be deduced analogously for orthotropic and even anisotropic materials, with the difference that the constants and are no longer unique, but have a different value for each set of directions. Even thermal effects and other phenomena can be added into the equations describing the model. However, although Hooke's law is widely used, it presents great limitations as nonlinearities emerge when the deformations are big enough to be no longer considered small. Thus, nonlinear models have to be used, and the phenomena of plasticity has to be taken into account.
A.2 Classical analysis methods
The study of the vibration behaviour of rotatory blades is a well-known problem and the main subject of rotordynamics, a specialised branch of applied mechanics. In this section, a review on the main methods and models used over the last century for the analysis of rotating structures will be addressed, following the key concepts presented in [1].
A.2.1 Energy methods
One of the most fundamentals principles in Physics states that energy in the Universe is conserved. Energy can adopt many forms, but in the study of rotordynamics the most relevant are kinetic and potential (strain) energy. If energy changes from potential to kinetic repetitively in time, then vibration appears. In this section, the main methods used to describe the beam behaviour from an energetic point of view will be briefly presented.
Euler-Lagrange equations
The following equations take advantage of variational calculus to illustrate the behaviour of a one dimensional idealization of a cantilever beam. Let's consider a function that would represent the beam problem:
|
|
(A.11) |
with as independent variable and and its derivatives as an admissible path. Considering the varied path defined by , being a small parameter and a differentiable function zero valued at and , equation A.11 over the varied path reads as:
|
|
(A.12) |
If the function above is expanded:
|
|
(A.13) |
Neglecting high order terms, one can state that . Expanding and integrating by parts, the equation admits two solutions: or either and are zero at and (Euler-Lagrange equation, eq. A.14) or its value is prescribed (boundary conditions, eq. A.15).
|
|
(A.14) |
|
|
(A.15) |
These equations describe one of the simplest structures, a one dimensional idealization of a cantilever beam. The greatness of this equation lies in converting the complex problem of solving 15 coupled differential equations (the Elasticity Problem) into a simple set of equations which are precise enough for engineering applications. For this particular case, the function is found by computing the potential energy of the beam after a load is applied, and reads as:
|
|
(A.16) |
Including eq. A.16 into eq. A.14 yields to
|
|
(A.17) |
Better known as the beam equation: states for lateral deflection, for the independent coordinate along the beam axis, for the Young's modulus, for the second moment of area of the cross-section about the yy axis and for a distributed load. An advantage of using energy methods instead of the Newtonian approach is that boundary conditions are completely fixed by equation A.15, whereas with classic methods they can be difficult to visualise.
Other methods
There are plenty of methods that use conservation of energy as basic principle to describe the behaviour of beams. The Lagrange method, for example, assumes that the solution of the equation satisfies the kinematic boundary conditions. For cantilever boundary conditions, in fact, a fourth grade polynomial is found to satisfy boundary conditions in (A.15). The solution is then found by minimizing total potential energy.
Lagrange also studied time-dependent structures, that is, the phenomena of vibration. The conservation of energy for a dynamic system states as , representing the kinetic energy and the strain energy. If one uses terms to define both kinetic and strain energy, the following matrix system is obtained, which leads to an eigenvalue problem that was not quite practical to solve until the century:
|
|
(A.18) |
Rayleigh's approach, on the other hand, consisted in finding a method for calculating fundamental natural frequencies with a formulation that could be tabulated and used in industry as a routine numerical operations, so the designs could be faster developed. To do so, Rayleigh used the conservation principle which states that, for a vibrating conservative system in simple harmonic motion, the maximum potential energy at maximum displacement is equal to the maximum kinetic energy when the system passes trough its equilibrium with maximum velocity.
Another great contributor to this field was Grigoryevich Galerkin, who in 1915 published an article on how to solve differential equations boundary problems with an approximate solution method. Differential equations of the type of equation A.14 cannot be solved except in a very few special cases. The key here is to multiply equation A.14 by , which is assumed to be the solution itself, and then integrating this product from to . The solution is found by making this integral zero. In the selection of , the Galerkin method uses itself. As in the Lagrange method, if one aims to solve the beam equation, it will be necessary to approximate the deflection first.
Modern Finite Element Methods rely, however, on Hamilton's Principle, the most general form for all vibrating systems, and one of the most powerful when applied to rotordynamics. A general equation for beam rotordynamics is found in terms of this principle for constant angular acceleration :
|
|
(A.19) |
Neglecting the effect of shear ( for long blades, as in helicopters), the equation can be simplified and some terms identified (Figure A.2). The following equation is solved using approximate methods, and the Galerkin method is a powerful tool to put it in terms of Finite Element Method. As can be seen, Coriolis forces and angular acceleration add non-linearities to the equation. A stiffness stiffening and softening due to rotation can also be spotted.
![Simplified equation for long rotating beams [1]](/wd/images/thumb/2/2f/Draft_Samper_691820313-monograph-Beam_Hamilton.png/390px-Draft_Samper_691820313-monograph-Beam_Hamilton.png)
|
| Figure A.2: Simplified equation for long rotating beams [1] |
A.2.2 Graphical methods
At the beginning of the , a rapid growth of rotating machinery made the need of rapid designs in the industrial environment arise. To handle this problem, graphical methods were used to determine natural frequencies of rotating structures. The goal was to create methods to be used by semi-skilled engineers and handled in the shortest possible time.
At that time, beam theory was already developed and used in many fields. A very common method to handle vibration problems consisted on drawing both the shear force and bending moment diagrams. With those, the deflection diagram could also be drawn and the integration was converted into graphical summation. This is a graphical way to interpret the Stodola-Viannello method, which considered deflection itself as a proportional load that produces the deflection. However, this process of drawing the diagrams is rather slow and depends on the accuracy of the drawings. That is why the Stodola-Viannello method became popular in the industrial world not in its graphical form, but as a tabulated iterative process.
In 1922, Holzer proposed another tabulated iterative method, based on Stodola's, which was able to capture higher torsional modes and its frequency. This method was widely used, and for instance a Railway Diesel-Electric Drive was designed. The main drawback of the Holzer method was the impossibility to predict deflection, slope, shear and bending moments.
The first graphical method used in aircraft wings and turbine blades was Myklestad’s method, widely spread during World War II. This tabular iterative method follows Holzer's in the way of capturing high torsional modes, but also computes deflection, slope, shear and bending moments. Phrol's method is quite similar to Myklestad’s, but addressed to shafts instead of aircraft structures. The main advantage of the latter was that the analysis included the rotatory inertia of the disks, thus adding the so-called gyroscopic effect.
This methods were widely used until the first half of the past century. With the advanced computational facilities, finite element methods gradually overtook these tabular and energy methods.
A.2.3 Matrix methods
As it has already been addressed in equation A.18, the Lagrange method enables the transformation of the differential equations governing the dynamics of free vibration systems into homogeneous algebraic equations. This leads to a well known eigenvalue problem, were the key is to find the vibration mode shapes (eigenvectors) and the natural frequencies (eigenvalues). However, the computational needs for practical systems were not present until the late century.
However, some methods were developed to handle these kind of systems with relative ease: Jacobsen and Ayre's, Gräffe's, Prieb's and Hahn's are just a few examples of methods that dealt with matrix systems to solve structures.
As matrix methods proven to be a good promise for vibration problems, Duncan and Collar developed an iterative method (essentially an extension of Stodola-Vianello's) that enabled to handle relatively large matrices. Transfer matrix methods also gained popularity because they were easier to adapt for computerization, as they only involve simple matrix multiplications, and the overall transfer matrix is always small. The latter method was extensively used in rotor dynamics calculations for determining critical speeds and unbalanced response. This method was extended even for transient whirl analysis.
But as processing power of computers started to grow, tabular and matrix methods lost their place and nowadays have no use in modern designs.
B. Elemental matrix computation
When the physical system of study is posed in terms of the FEM, spatial coordinates are discretised and the resulting equations are ruled by a set of global matrices (see in fact equation 3.14). That is why matrix computation is always an important step of every FEM solver. However, those matrices involve integrals over the domain which have no closed solution unless they are split into local or elemental coordinates. Under those conditions, the global matrices are decomposed into smaller, elemental matrices. If mapped into the parent domain, the integrals can be approximated using the Gauss Quadrature method. The aim of this chapter is to review the process of assembly: how global matrices are built from elemental ones. The approximation of the latter will also be assessed.
B.1 The static stiffness matrix
From equation 3.13, the expression of the stiffness matrix for static structures is, in terms of the FEM:
|
|
(B.1) |
The above integral is to be evaluated over the domain , which becomes infeasible unless local formulation is adopted. Using the formulation presented in section 3.26, the above integral can be splitted into elemental integrals as follows:
|
|
(B.2) |
Where is a matrix known as boolean connectivity matrix, consisting of the integers 0 and 1 relating element nodal variables with the global nodal vector (). With all, the problem of computing a single global matrix reduces to the computation of elemental matrices. For the sake of simplicity, the assembly operation is expressed as:
|
|
(B.3) |
The only thing left is finding a reliable method to compute . As integration boundaries may differ from one element to another, the best method to evaluate elemental matrices is by transforming them into the parent domain, where their geometry is normalised and thus Gauss Quadrature can be applied in the same way for all elements. Using the formulation presented in 3.3.1:
|
|
(B.4) |
The number of Gauss points required for the integration depends on the order of the employed shape functions, and thus is to be specified for each type of element.
B.2 The force vector
In equation 4.1, stands for the force vector accounting for the effect of the body forces , boundary tractions and centrifugal forces . The methodology used to compute them is the same as in the previous case: splitting the global vector into elemental vectors and mapping them into the parent domain, where Gauss Quadrature can be applied.
B.2.1 Body forces
Recall from equation 3.13 that body and rotation force vectors can be expressed in terms of the FEM as:
|
|
(B.5) |
Where stands for the vector of external body forces acting on the structure. Notice that the shape of both and is quite similar, and so they can be written as:
|
|
(B.6) |
Being the total contribution of body and rotation forces. As in the previous case, the global vector can be splitted into elemental force vectors using the assembly operator:
|
|
(B.7) |
The problem lies now in how to define the vector along each element. A common approach is to replace it by an approximation constructed by interpolation of its nodal values using the same shape functions as for the displacement field:
|
|
(B.8) |
Note that this approximation can induce errors if, for example, two neighbouring elements have different densities, as density would be a nodal property rather than an elemental one. Using Gauss Quadrature, the sum of the elemental body and rotation force vectors is expressed as:
|
|
(B.9) |
B.2.2 Traction forces
When determining the external forces due to boundary traction conditions , it is convenient to distinguish between point loads and distributed loads . The determination of is straightforward: if a point force is applied to node , then . Point loads are a particular case of distributed loads, where the force function is the Dirac delta operator: zero valued everywhere but A, where it presents a spike.
The study of distributed loads requires from a more meticulous approach, and a new formulation regarding boundary elements is to be posed. To start with, let's define as the set of elements lying on the Neumann boundary , with :
|
|
(B.10) |
Being the number of nodes per boundary element, and assuming for simplicity it is the same for all elements, one can define as the boundary connectivity matrix, a matrix containing, in each row, the global indices of the boundary nodes of each patch . For each boundary element , a matrix of boundary shape functions is defined:
|
|
(B.11) |
Notice that the boundary shape functions are different from the ones used to interpolate the displacements, as the dimension of the boundary is always smaller than the dimension of the elements, . Recall the definition of the global vector of prescribed boundary tractions (equation 4.1 ), whose decomposition into elemental integrals reads as:
|
|
(B.12) |
Where is the Boolean operator linking the global and local vectors of test coefficients. The above expression can be expressed as:
|
|
(B.13) |
Where is the elemental traction vector due to distributed loads along direction i, is the global vector due to distributed loads along direction i and is the global vector due to distributed loads. As for the case of body forces, the input function is commonly replaced by an approximation constructed by interpolation of its nodal values using the shape functions employed for interpolating the boundary test functions:
|
|
(B.14) |
Using this interpolation, and taking advantage of the assembly operator, the global vector due to distributed loads along direction i results in:
|
|
(B.15) |
If mapped into the parent domain, the computation of the elemental traction vector due to distributed loads along direction i can be approximated using the Gauss Quadrature method:
|
|
(B.16) |
As it has already been stressed out, and thus the shape functions and weights appearing in the above expressions are different from those computed when assessing the stiffness matrix and the body forces vector. For 3D problems, the boundary elements are 2D, and therefore a different Gauss rule is applied.
B.3 The mass matrix
It is found from equation 3.13 that the mass matrix can be expressed in terms of the FEM as:
|
|
(B.17) |
The process of splitting the above integral into elemental ones, and approximating the latter using the Gauss Quadrature method is identical as for the static stiffness matrix case. Using the assembly operator:
|
|
(B.18) |
The elemental matrices are then mapped into the parent domain and approximated using Gauss Quadrature:
|
|
(B.19) |
B.4 The static damping matrix
It is found from equation 3.13 that the static damping matrix can be expressed in terms of the FEM as:
|
|
(B.20) |
Using the approximation presented in equation 3.15, the above integral is transformed into:
|
|
(B.21) |
Where and are known matrices, while and are constant parameters.
B.5 The rotation matrices
Recall that the rotation of the structure induces new matrices to appear in equation 3.13:
|
|
(B.22) |
Its computation method is not so different from the mass matrix case:
|
|
(B.23) |
|
|
(B.24) |
Using the Gauss Quadrature method to approximate the elemental integrals:
|
|
(B.25) |
|
|
(B.26) |
C. Example of vectorised assembly
The FEM is able to solve boundary value problems along very complex geometries because it splits the domain into a finite number of smaller partitions called elements. In numerical terms, this implies that global matrices are not computed all at once, but element by element. Then, all the elemental matrices need to be assembled, but traditional assembly algorithms can be very slow. For this reason a vectorised assembly algorithm has been used in the present project. The code was provided by prof. J. Hernández and adapted to the case of rotating structures. The goal of the present chapter is to illustrate how vectorised assembly works by developing, step by step, the assembly of the mass matrix for two linear quadrilateral elements.
C.1 Mass matrix vectorised assembly
To start with, recall the definition of the mass matrix and its decomposition into elemental components from the previous chapter:
|
|
(C.1) |
To keep the example as simple as possible, let's consider the following geometry made from two linear quadrilateral elements (Figure C.1).
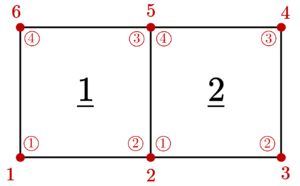
|
| Figure C.1: 2D mesh composed by two quadrilateral elements. |
Remember that for 2D elements, the numeration order is not important as well as it follows counter-clockwise direction. In the above figure, numbers inside a circle represent local numeration. When the geometric domain is not as trivial as the presented one, keeping track of the global numeration is not an easy task. On the other hand, local numeration is always performed in the same way. Hence, one may suspect that some properties remain undisturbed in the local frame.
Following the previous idea, the vectorised assembly takes advantage of the fact that in the parent domain, all the elements are geometrically identical and so are their shape functions. Hence, it is only necessary to compute the elemental matrix of one element and use it to construct a matrix including all the elemental shape functions matrices. The latter matrix, referred as , is actually a matrix.
Remember that, for vector fields, the elemental matrix of shape functions was defined as:
|
|
(C.2) |
Where is the identity matrix and is the scalar-valued shape function of node . Let's define now , a matrix that incorporates the value of at every Gauss Point:
|
|
(C.3) |
Where is a matrix. Taking advantage of the fact that is the same for all elements, can be easily constructed by repeating a number of times:
|
|
(C.4) |
The next step is to built , a matrix that takes into account the global formulation and is constructed from by using the connectivity matrix. For instance, for the presented geometry and with and , adopts the following form:
|
|
(C.5) |
The grace of this approach is that once is computed, the transformations that follow are performed using optimised in-built functions such as sparse, reshape and repmat:
m = ndim*nelem*ngaus ; % Number of rows
n = nnode*ndim ;          % Number of columns
nzmaxLOC = m*nnodeE*ndim ;   % Maximum number of zeros
Nst = sparse([],[],[],m,n,nzmaxLOC); % Allocating memory for Bst

for inode = 1:nnodeE   % Loop over number of nodes at each element

    setnodes = CONNECT(:,inode) ;  % Global numbering of the
    %inode-th node of each element
      for idime = 1:ndim   % loop over spatial dimensions
        DOFloc = (inode-1)*ndim+idime ;  % Corresponding indices
        s = Nelems(:,DOFloc) ;% Corresponding column
        i = [1:m]' ;  % All rows
        DOFglo = (setnodes-1)*ndim+idime ; %  b) Columns
        j = repmat(DOFglo', ndim*ngaus,1) ;
        j = reshape(j,length(i),1) ;
        % Assembly process  (as sum of matrix with sparse representation)
        Nst = Nst + sparse(i,j,s,m,n,m) ;
    end
end
Until now, the Gauss weights and Jacobians were not considered. So let's define WSTs, a vector containing the product of weights and Jacobians at all Gauss points:
|
|
(C.6) |
The previous matrix is to be transformed into diagonal. To do so, let's first define the following auxiliary matrices:
|
|
(C.7) |
And now the diagonalised version of WSTs reads as:
|
|
(C.8) |
To close down the section, let's take density into consideration. Recall that density is given as a vector input, having a value for each element:
|
|
(C.9) |
The next step is to transform the previous expression into a global matrix, accounting for each dimension and Gauss point. To do so, let's consider the following matrices:
|
|
(C.10) |
And finally, the global density matrix is defined as:
|
|
(C.11) |
After all this abstract formulation, the mass matrix can be simply assembled with no nested loops at all:
|
|
(C.12) |
C.2 Generalisation to rotation matrices
During the development of the FEM method for rotating structures, it was found that new matrices emerged by the effect of rotation. These matrices have the form:
|
|
(C.13) |
Where is a matrix accounting for the rotation effect, mostly Coriolis, centrifugal and tangential forces. The vectorised assembly of is almost straightforward, as most of the process is done exactly as in the case of the mass matrix. The only difference has to do with , which has to be globally defined:
|
|
(C.14) |
Finally, the global matrix is assembled as:
|
|
(C.15) |
D. Raw simulation results
In this chapter, results obtained from the developed simulations will be displayed. The discussion and analysis of the present results has already been addressed in the report (sections 6 and 7).
D.1 Two-dimensional cantilever beam
D.1.1 Natural modes and frequencies
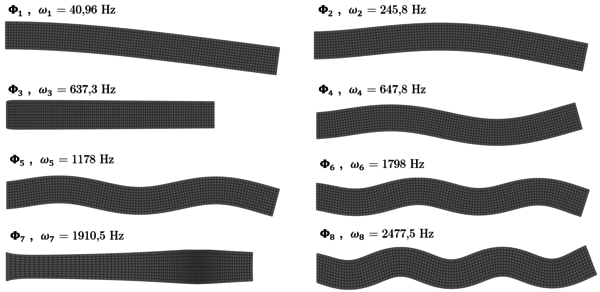
|
| Figure D.1: Natural modes associated to the eight lowest natural frequencies of a rectangular cantilever beam. |
D.1.2 Constant angular velocity
Case 1: Ω = 50 rad/s
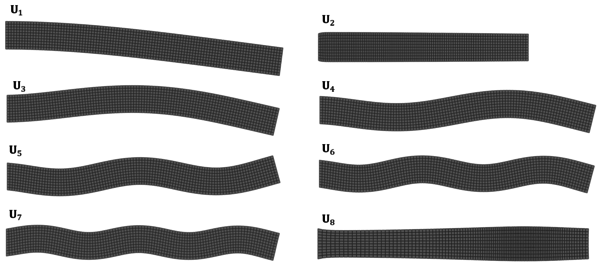
|
| Figure D.2: Left side vectors (predominant modes) associated to the eight higher singular values. |
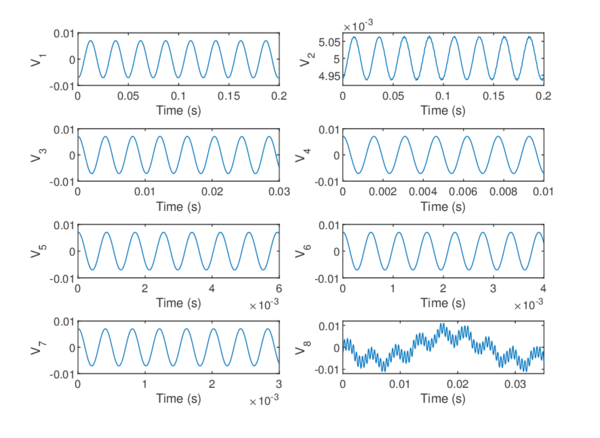
|
| Figure D.3: Right side vectors (predominant oscillations) associated to the eight higher singular values. |
Case 2: Ω = 100 rad/s
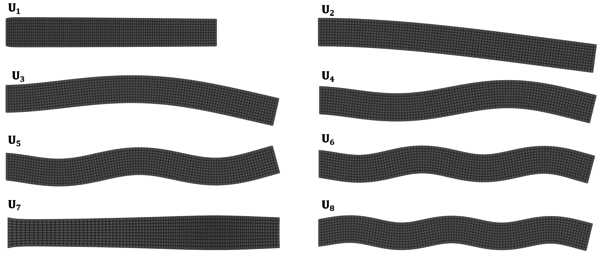
|
| Figure D.4: Left side vectors (predominant modes) associated to the eight higher singular values. |
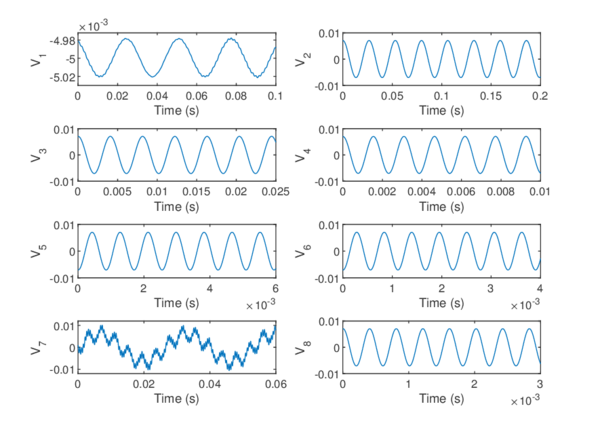
|
| Figure D.5: Right side vectors (predominant oscillations) associated to the eight higher singular values. |
Case 3: Ω = 200 rad/s
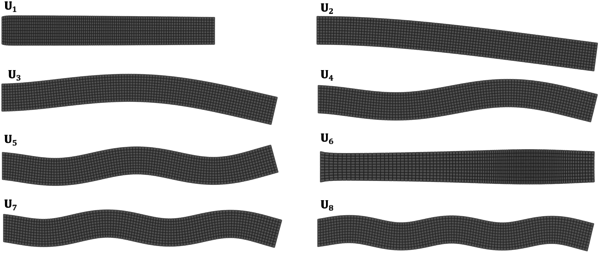
|
| Figure D.6: Left side vectors (predominant modes) associated to the eight higher singular values. |
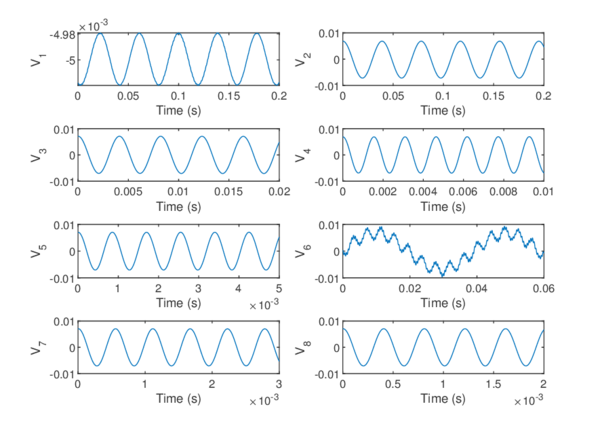
|
| Figure D.7: Right side vectors (predominant oscillations) associated to the eight higher singular values. |
Comparative figures
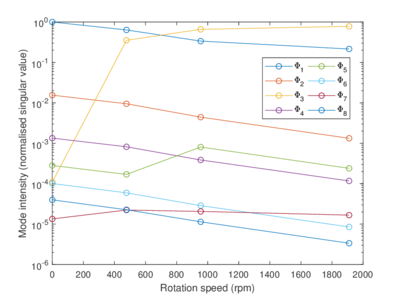
|
| Figure D.8: Mode intensities for increasing values of |
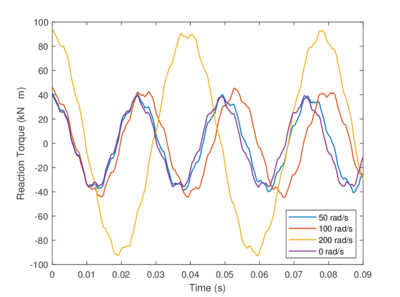
|
| Figure D.9: Reaction torque for increasing values of |
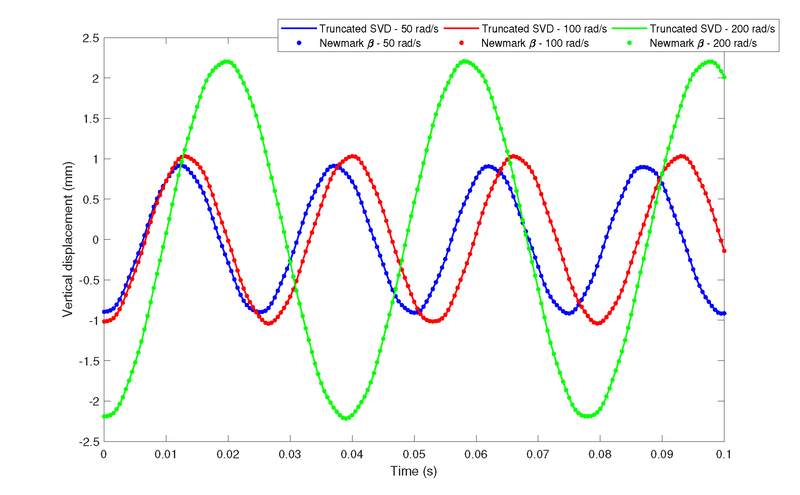
|
| Figure D.10: Local transverse displacements at the tip of the beam for different values of . Numeric results and its SVD approximation are compared. |
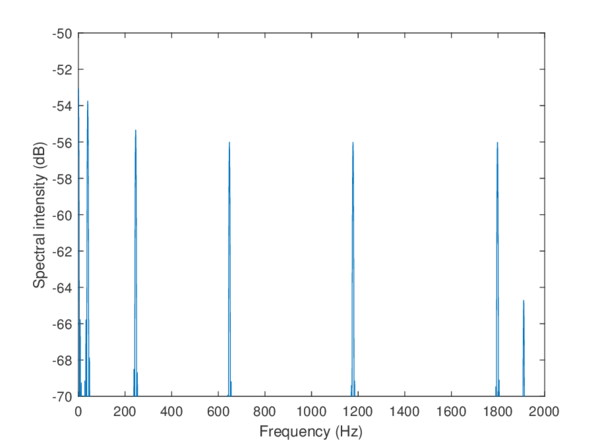
|
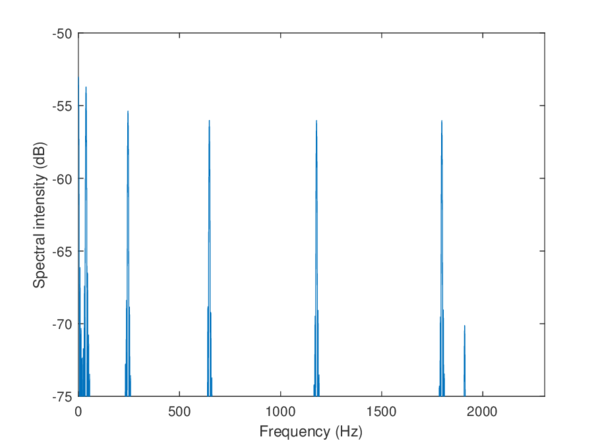
|
| (a) | (b) |
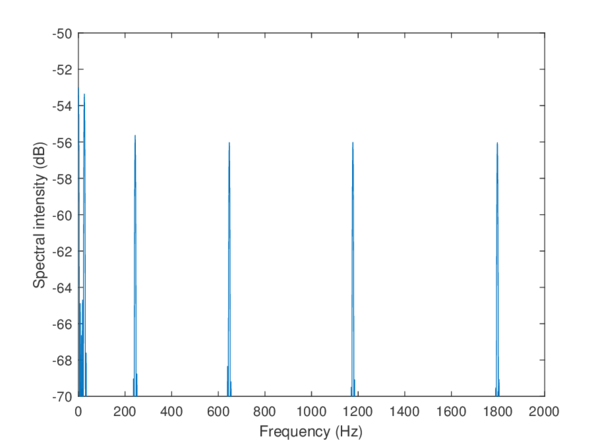
| |
| (c) | |
| Figure D.11: Power spectral density estimation of the sum of the right side vectors obtained for different rotation speeds: 50 (a), 100 (b) and 200 (c) rad/s. | |
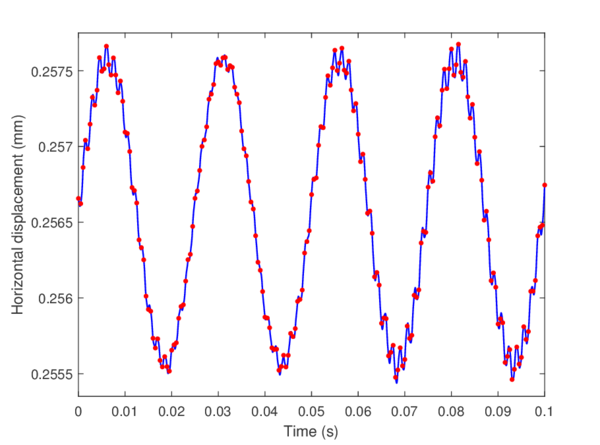
|
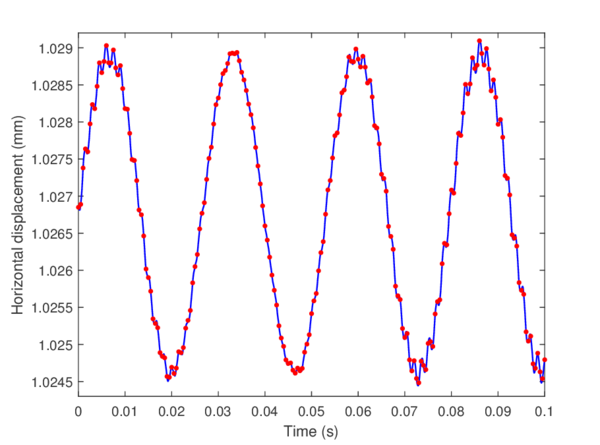
|
| (a) | (b) |
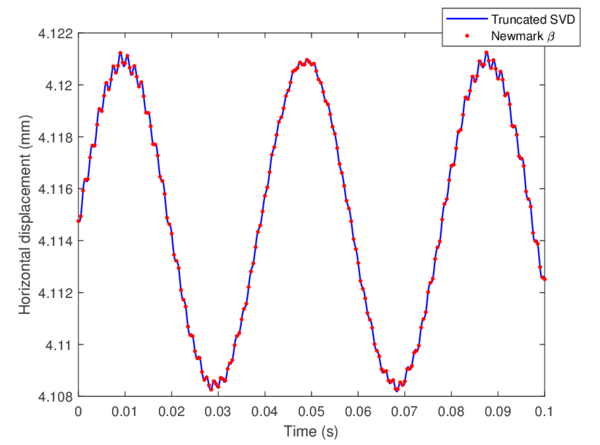
| |
| (c) | |
| Figure D.12: Local horizontal displacements at the tip of the beam for different values of : 50 (a), 100 (b) and 200 (c) rad/s. Numeric results and its SVD approximation are compared. | |
Deformed shapes and stress distribution for Ω = 50 rad/s
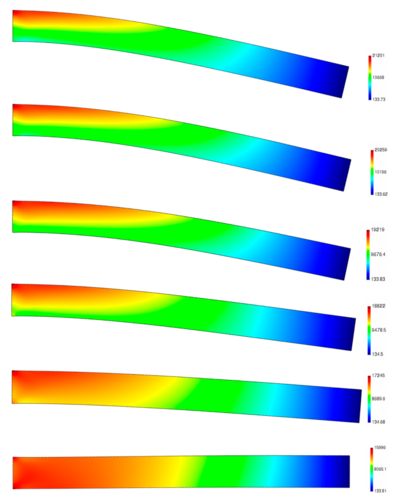
|
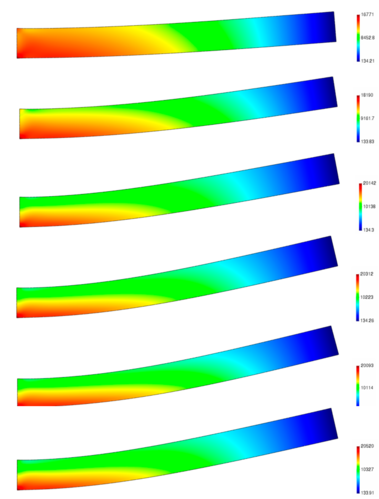
|
| Figure D.13: Deformed shape () and distribution (colour map, in KPa) at 50 rad/s. Time from 0 to 14 ms. |
D.1.3 Constant angular acceleration
Case 1: α = 5 rad/s²
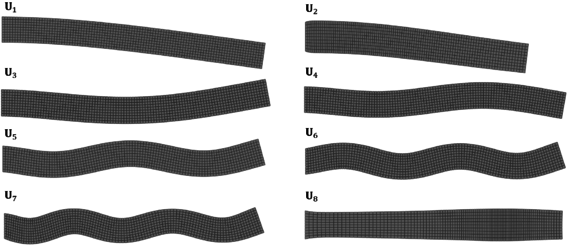
|
| Figure D.14: Left side vectors (predominant modes) associated to the eight higher singular values. |
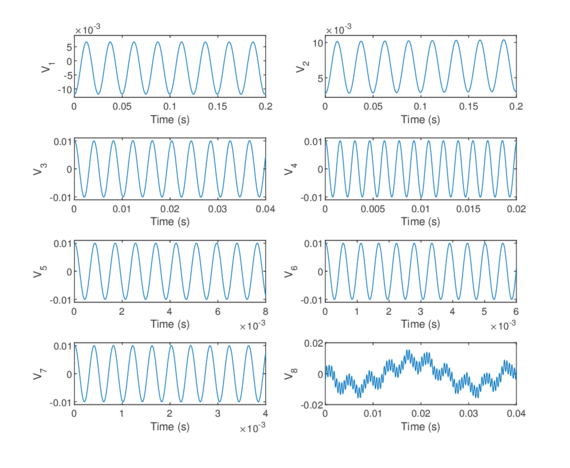
|
| Figure D.15: Right side vectors (predominant oscillations) associated to the eight higher singular values. |
Case 2: α = 50 rad/s²
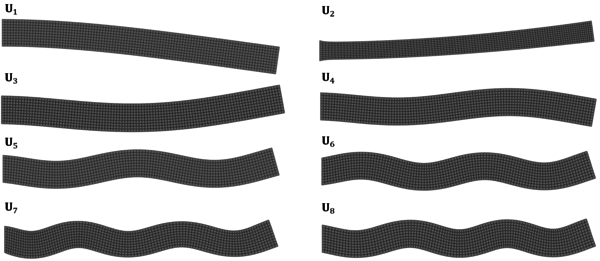
|
| Figure D.16: Left side vectors (predominant modes) associated to the eight higher singular values. |
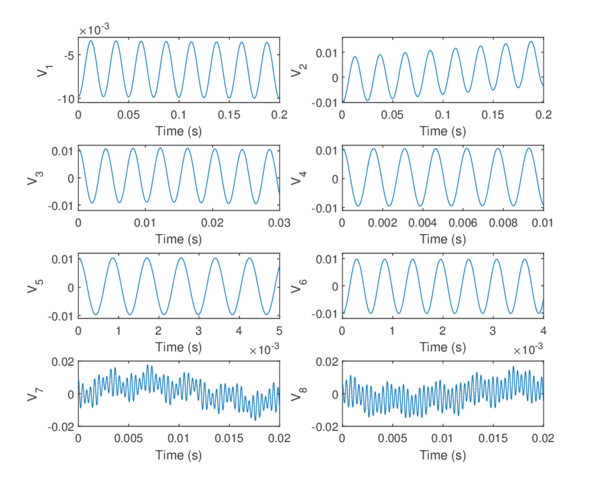
|
| Figure D.17: Right side vectors (predominant oscillations) associated to the eight higher singular values. |
Comparative figures
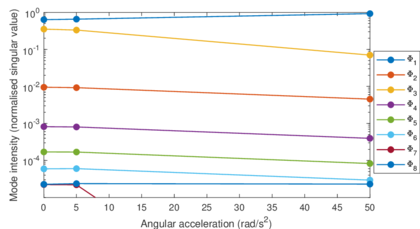
|
| Figure D.18: Mode intensities for increasing values of . |
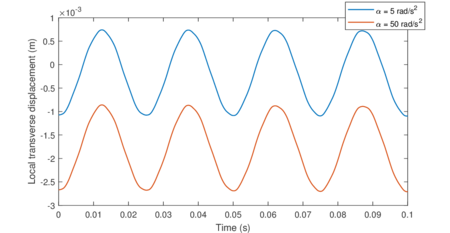
|
| Figure D.19: Temporal evolution of vertical displacements at the tip of a cantilever beam under constant angular acceleration. |
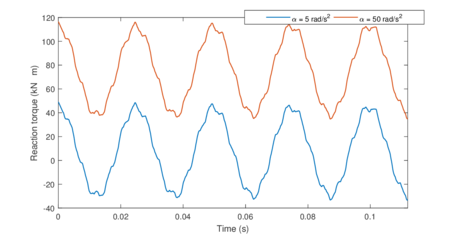
|
| Figure D.20: Reaction torque for increasing values of . |
Deformed shapes and stress distribution for α = 50 rad/s²
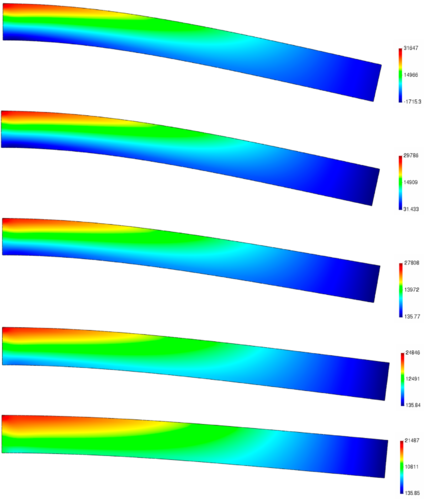
|
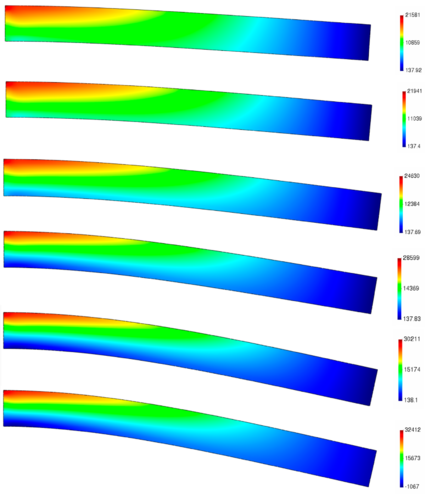
|
| Figure D.21: Deformed shape () and distribution (colour map, in KPa) at = 50 rad/s and = 50 rad/s. Time from 0 to 25 ms. |
D.2 Three-dimensional cantilever beam
D.2.1 Natural modes and frequencies
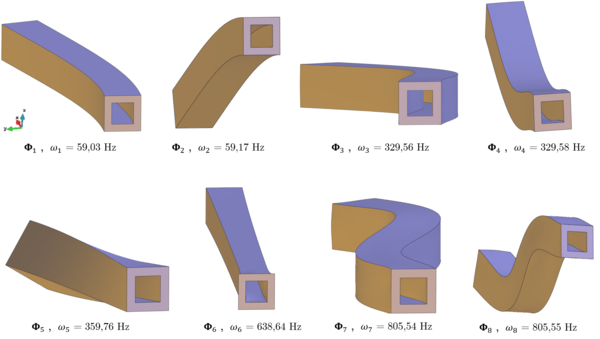
|
| Figure D.22: Natural modes associated to the eight lowest natural frequencies of a 3D cantilever beam. |
D.2.2 Constant angular velocity
Case 1: Ω = 25 rad/s
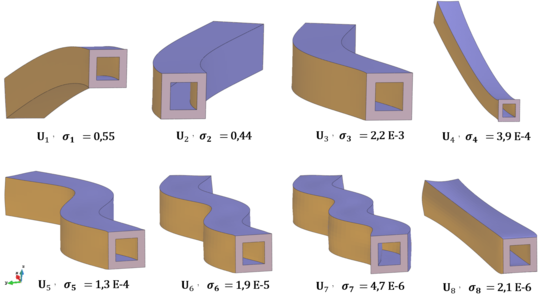
|
| Figure D.23: Left side vectors (predominant modes) associated to the eight higher singular values. |
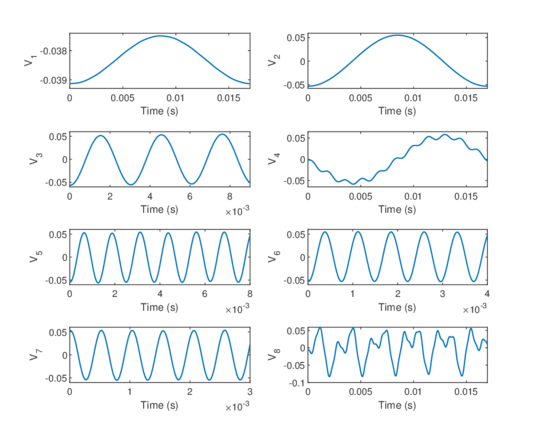
|
| Figure D.24: Right side vectors (predominant oscillations) associated to the eight higher singular values. |
Case 2: Ω = 50 rad/s
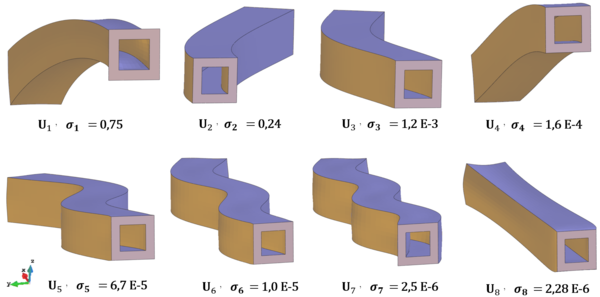
|
| Figure D.25: Left side vectors (predominant modes) associated to the eight higher singular values. |
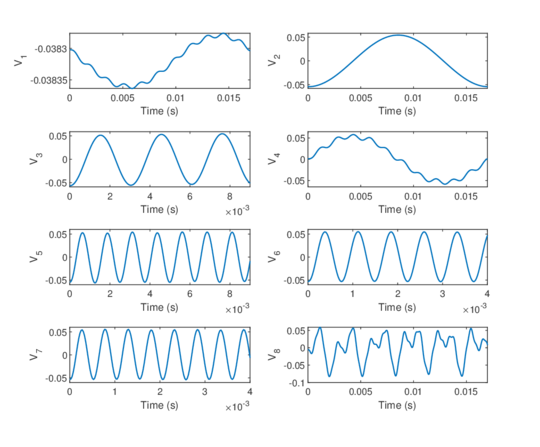
|
| Figure D.26: Right side vectors (predominant oscillations) associated to the eight higher singular values. |
Case 3: Ω = 100 rad/s
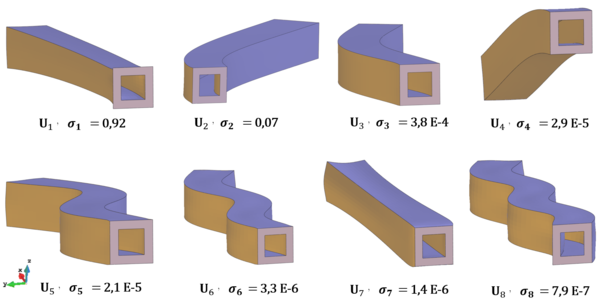
|
| Figure D.27: Left side vectors (predominant modes) associated to the eight higher singular values. |
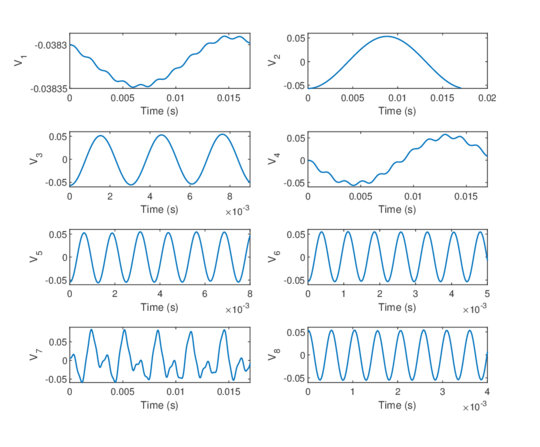
|
| Figure D.28: Right side vectors (predominant oscillations) associated to the eight higher singular values. |
Campbell diagram
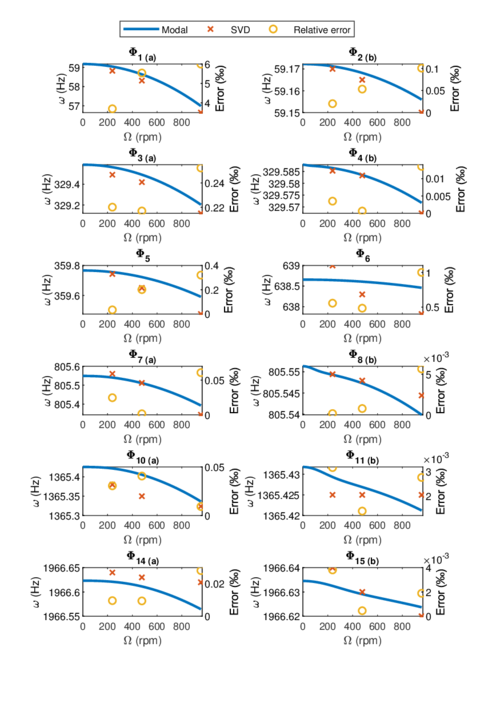
|
| Figure D.29: Campbell diagram: comparison between modal prediction and SVD predominant frequencies. Subscripts and refer to pairs of equal modes that activate either on or . |
Comparative figures
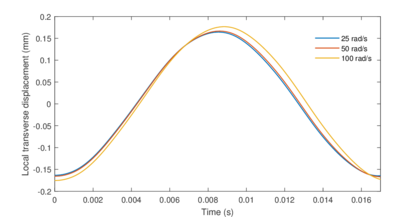
|
| Figure D.30: Temporal evolution of displacements at the tip of a cantilever beam under constant angular velocity. |
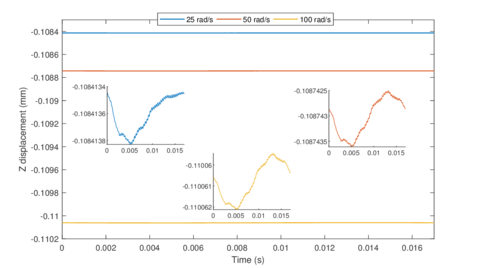
|
| Figure D.31: Temporal evolution of displacements at the tip of a cantilever beam under constant angular velocity. |
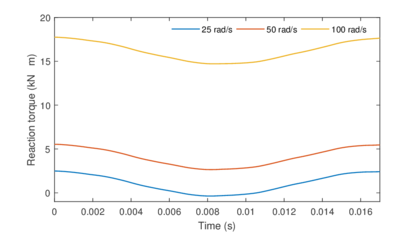
|
| Figure D.32: Reaction torque for increasing values of . |
Deformed shapes and stress distribution for Ω = 50 rad/s
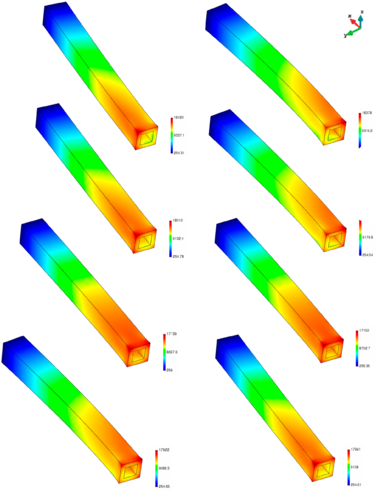
|
| Figure D.33: Deformed shape () and distribution (colour map, in KPa) at = 50 rad/s. Time from 0 to 17 ms (up-down, left-right). |
D.3 Starting of a rotor blade
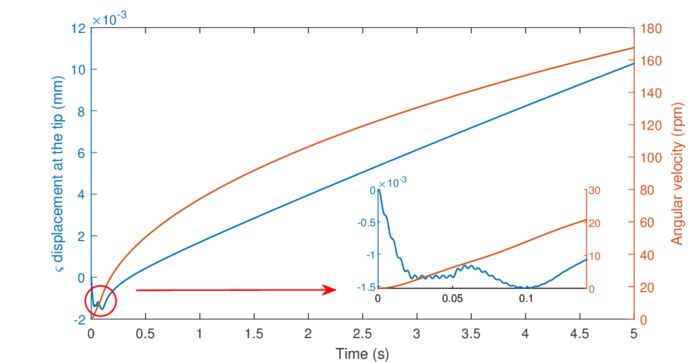
|
| Figure D.34: Temporal evolution of the angular speed and the local axial displacements at the tip. |

|
| Figure D.35: Temporal evolution of the angular acceleration and elastic reaction torque. |
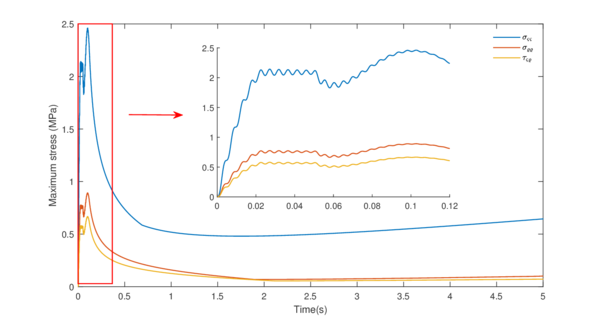
|
| Figure D.36: Temporal evolution of the maximum values of stress. |
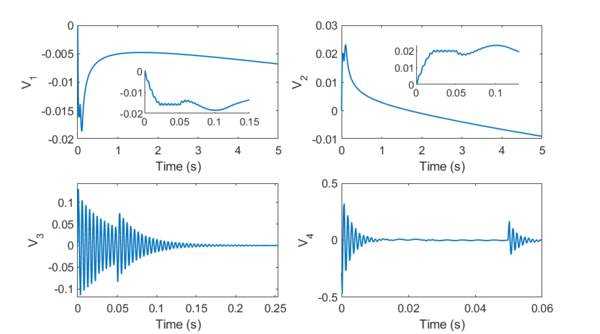
|
| Figure D.37: Right side vectors of the four most predominant oscillations. |
Bibliography
[1] Rao, J. S. (2011) "History of rotating machinery dynamics". Springer 358
[2] Genta, Giancarlo. (2005) "Dynamics of Rotating Systems". Springer-Verlag New York
[3] Genta, Giancarlo, Silvagni, Mario. (2013) "On Centrifugal Softening in Finite Element Method Rotordynamics". Volume 81, Journal of Applied Mechanics
[4] Bentley, John R. (2007) "Aeolipile - Hero's Ball: A Replica of the World's First Rotating Steam Engine" http://modelengines.info/aeolipile/
[5] Volkov, Dale. (2016) "Heinkel He.178" http://www.airwar.ru/enc/xplane/he178.html
[6] Gao, Haifeng, Bai, Guangchen. (2015) "Reliability analysis on resonance for low-pressure compressor rotor blade". Advances in Mechanical Engineering http://journals.sagepub.com/doi/10.1177/1687814015578351
[7] Roylance, David "Beam Displacements". Department of Materials Science and Engineering, Massachusetts Institute of Technology
[8] González, José A., Abascal, Ramón, Park, K.C. (2014) "Partitioned analysis of flexible multibody systems using filtered linear finite element deformational modes". International Journal for Numeric Methods in Engineering, 102–128
[9] UPC ETSEIB "Numerical Factory - Finite Elements: a first course" https://numfactory.upc.edu/web/FiniteElements.html
[10] Tulloch Andrew. (2014) "Fast Randomized SVD - Facebook Research" https://research.fb.com/fast-randomized-svd/
[11] Inman, Daniel J. (2014) "Engineering Vibration". Pearson
[12] Belytschko, Ted, Lin, Wing Kam, Moran, Brian, Wiley, John. (2000) "Nonlinear finite elements for continua and structures". John Wiley & Sons
[13] Hernández, J.A., Oliver, J., Huespe, A.E. (2014) "Computational Homogenization of Inelastic Materials using Model Order Reduction". Monograph Nº M141, CIMNE
[14] D. Callister, William, Rethwisch, David. (1985) "Materials Science and Engineering: An Introduction". John Wiley and Sons
[15] "Airfoiltools - Airofil Database" http://airfoiltools.com
[16] V. Hutton, David. (2004) "Fundamentals of Finite Element Analysis". Mc Graw Hill
[17] Matsushita, Osami, Tanaka, Masato, Kanki, Hiroshi, Kobayashi, Masao, Keogh, Patrick. (2017) "Vibrations of Rotating Machinery - Basic Rotordynamics: Introduction to Practical Vibration Analysis", Volume 1 360
[18] Géradin, Michel, Cardona, Alberto. (2001) "Flexible Multibody Dynamics - A finite elements approach". John Wiley & Sons
[19] Japhet, Caroline, Cuvelier, Francois, Scarella, Gilles. (2015) "An efficient way to perform the assembly of finite element matrices - <hal-00931066v2>"
[20] Shabana, Ahmed A. (1997) "Flexible Multibody Dynamics: Review of Past and Recent Developments". Multibody System Dynamics 189-222
[21] GUWAHATI, NPTEL - IIT. (2014) "Theory of Rotor Dynamics" https://nptel.ac.in/courses/112103024/23
Document information
Published on 05/02/20
Licence: CC BY-NC-SA license
Share this document
Keywords
claim authorship
Are you one of the authors of this document?
