| Line 268: | Line 268: | ||
{| class="floating_imageSCP" style="text-align: center; border: 1px solid #BBB; margin: 1em auto; width: 100%;max-width: 100%;" | {| class="floating_imageSCP" style="text-align: center; border: 1px solid #BBB; margin: 1em auto; width: 100%;max-width: 100%;" | ||
|- | |- | ||
| − | |[[Image:Draft_Samper_925977240-65kUCS_H50_Rankine.png| | + | |[[Image:Draft_Samper_925977240-65kUCS_H50_Rankine.png|400px|Test 1 (UCS) with Rankine yield surface. Stress-strain curve. The horizontal lines indicate the band of experimental results]] |
|- style="text-align: center; font-size: 75%;" | |- style="text-align: center; font-size: 75%;" | ||
| colspan="1" | '''Figure 9:''' Test 1 (UCS) with Rankine yield surface. Stress-strain curve. The horizontal lines indicate the band of experimental results | | colspan="1" | '''Figure 9:''' Test 1 (UCS) with Rankine yield surface. Stress-strain curve. The horizontal lines indicate the band of experimental results | ||
Revision as of 13:26, 5 February 2019
Abstract
We present a numerical procedure for elastic and non linear analysis (including fracture situations) of solid materials and structures using the Discrete Element Method (DEM). It can be applied to strongly cohesive frictional materials such as concrete and rocks. The method consists on defining the non-local constitutive equations at the contact interfaces between discrete particles using the information provided by the stress tensor over the neighbour particles. The method can be used with different yield surfaces and in the paper it is applied to the analysis of fracture of concrete samples. Good comparison with experimental results is obtained.
Keywords: Discrete Element Method, DEM, concrete, elasticity, non linearity, geomaterials, yield surface
1 INTRODUCTION
The Discrete Element Method (DEM) has proven to be a very useful numerical tool for the computation of granular flows [2, 3, 4] (the hereafter termed non-cohesive DEM) with or without coupling with fluids [5, 6] or structures [7]. These computations can include cohesive forces between particles [8] to model moisture, glue or other added features to the standard non-cohesive DEM. Other research lines have focused on the DEM as a method to compute the mechanics of strongly cohesive materials, like rocks, concrete or cement [9, 10, 19]. The approach in these cases is usually termed as 'bonded' or 'cohesive' DEM. Here the DEM can be understood as a discretization method for the continuum. The bonded DEM has also been combined with the Finite Element Method (FEM) in order to save computation time [20].
The ability of the DEM to reproduce multi-cracking phenomena in cohesive materials is probably one of the main reasons why the DEM is chosen in those cases. However, a deep analysis of the works published usually reveals a lack of accuracy of the DEM results in the elastic regime, together with the need for calibrating the DEM parameters for each application. It is quite surprising that the Poisson's ratio and the shear modulus are seldom validated. It is however commonly accepted [11] that the Poisson's ratio has a strong dependency on the mesh arrangement and the ratio [12], where and are the normal and tangential spring stiffness, respectively, in the spring dash-pot model that yields the forces at the contact interface between two spheres.
The difficulty of the bonded DEM to get accurate results when trying to capture simultaneously the Young's modulus (), the Poisson's ratio () and the related shear modulus () derives from the fact that the bonded DEM works as a system of trusses instead of a true continuum. Usually, a good calibration of the micro parameters ( and ) leads to a decent capture of one or two of the elastic macro parameters (, and ) for a given mesh arrangement and usually for a certain, limited, range of values [12]. Due to these limitations, the spring dash-pot model has proven not to be good enough to capture the elastic behavior of a continuum with the DEM.
In a recent paper [1] we proposed a way to enrich the spring dash-pot model in such a way that the elastic properties of a continuum can be accurately captured with the DEM. The bonded DEM also brings the possibility to add breakage and separation of particles if certain requirements are met. In this work we propose a new criterion for breaking the bonds between spherical particles based on the stress tensor at the contact interface, a simple idea that has been widely used in continuum mechanics.
The arrangement of the paper is as follows. The non-local constitutive equations between forces and displacements at a contact interface are presented first. Also we describe how the stress tensor at the contact interface can be computed. The method for predicting the onset of fracture at a contact interface is described next. The last section of the paper presents the application of the new DEM technique to the analysis of Uniaxial Compression Strength (UCS), Brazilian Tensile Strength (BTS) and shear tests in concrete samples. Numerical results are compared with experimental data for the same tests with good agreement.
2 THE STRESS TENSOR OVER DISCRETE ELEMENTS
The stress tensor, understood here as the “Cauchy stress tensor”, has been widely used in the field of the DEM. It is typically used to plot the value of the stresses in certain regions of the domain when dealing with granular materials [14]. For example, it is common to model soils with the DEM and to plot the stresses within the soil as a valuable engineering result.
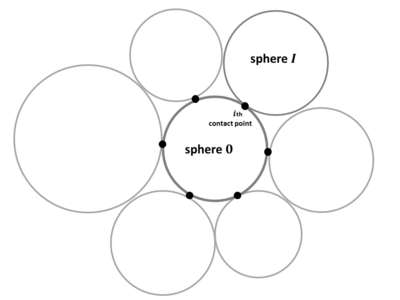
The stress tensor at the center of a “central” spherical particle, (hereafter termed particle 0) (Figure 1), can be calculated as
|
|
(1) |
In Eq.1, index 0 denotes the central particle where the stresses are computed, is the volume of the spherical particle, is the number of contacts of the particles with its neighbours, is the vector connecting the center of the sphere to the th contact point and is the force vector at the th contact point. Indeed the contact points can account for a certain gap between adjacent particles, as explained in [9].
Apart from granular non-cohesive materials, the DEM has been used to model strongly cohesive materials like concrete or rocks [9] by means of the bonded DEM, which can withstand tractions. The packing of spheres is expected to work as an equivalent continuum and the stress tensor at the center of each particle can be calculated with Eq.1 as well.
|
| Figure 1: th contact point between a central sphere (0) and an adjacent sphere (I) |
The idea of using the stress tensor at a particle to enrich the information used to compute the forces between bonded particles emulating a continuum was presented in [1]. The normal force at a contact point is computed in terms of the nodal overlap and the stresses at the contact point as
|
|
(2) |
where is the force between the two particles in the normal direction (defined by the vector that joins the particle centers), is the contact area at the th contact interface between the two particles (particle and particle , see Figure 1), is the overlap between the particles, is the Poisson's ratio and is a normal stiffness parameter associated to each pair of particles given by
|
|
(3) |
where is the distance between the centers of the particles at the stress-free position and is the Young's modulus of the continuum material [1].
In Eq.2 and are the axial stresses at the contact point in the two orthogonal directions to the normal one. They can be obtained by rotating the stress tensor at the th contact point, , as follows (Eq.6)
|
|
(4) |
where is the rotation matrix between the Cartesian and the local axes of contact [1].
The stress tensor at the th contact point is computed by averaging the values of the stress tensors of the contacting spheres sharing the th contact part (sphere 0 and sphere I) via Eq.5. This gives
|
|
(5) |
Note that Eq.2 is a non-local constitutive expression that relates the normal force with the values of the stress at the particles adjacent to the central sphere.
The tangential forces at the th contact point are similarly computed in a non-local form as
|
|
(6) |
where and are the tangential components of the local stress tensor at the th contact point, (Eq.4). Sub-index in Eqs.6 denotes the time step at which the different terms are approximated. For an explicit dynamic solution schemes, step refers to the previous time step. For implicit schemes, step refers to the current time step and the term is updated iteratively. Note that both and depend on the stress tensor for each particle (computed by Eq.1). Therefore, their value has to be used either from the previous time step or the previous iteration. Otherwise, the forces would never be updated according to the relative displacements. The sub-index in Eq.6 avoids the substitution of by , which would cancel terms and make the expression independent from the relative displacements between the particles.
We highlight that both the normal and tangential forces make use of the averaged stress tensor at each contact point. This increases the stencil of neighboring spheres considered for computing the forces at each contact point.
Details of the computation of the stress tensor at each particle from the normal and tangential forces, the computation of the contact areas, the necessary adjustment of the porosity of the packing and the correction of the volume and mass of the particles can be found in [1].
In [1], several other adjustments are proposed aiming at avoiding calibration of the contact parameters. However, those suggestions fall out of the scope of this work, the purpose of which is to determine the importance of the stress tensor in the post-elastic regime.
3 USING THE STRESS TENSOR TO COMPUTE THE CRACK INITIATION
In the field of continuum mechanics, each yield surface is designed to model a certain behavior of a specific group of materials. For example, the Rankine yield surface [23] is intended for concrete or other materials whose fracture is mainly traction-driven, as these materials present a much higher strength in compression than in tension. As a different example, the Von Mises yield surface is typically used with metals, giving importance to the deviatoric stresses as initiators of the non linearity.
Even if these yield surfaces are used to trigger a brittle fracture, this does not mean that the macroscopic response of the sample subject to stresses presents a brittle behavior. Actually, the post-elasticity behaviour depends on the shape of the sample and the load type. Thus, for the same material properties, we can see a totally brittle response in a bending test, and a smoother non-linear graph in a UCS test.
The traditional way to detect the initiation of post-elastic behavior in a continuum is the verification of a certain yield condition expressed in terms of the stress tensor written as [24]. The novel idea presented in this paper is to use the stress tensor at a bond (computed by Eq. 5) and a yield surface to trigger a crack at the contact interface between two spheres in the bonded DEM.
The way to assess if a stress tensor verifies or not the yield conditions changes with each specific model. Examples are be given in Sections 5 and 6. However, many other examples can be found in the literature of continuum mechanics, plasticity, damage and fracture mechanics.
The proposed criterion is independent from the specific orientation of the bond, as the stress tensor represents all the orientations in a single matrix.
With this methodology, the concept of using the stress tensor for the elastic regime presented in [1] is extended to the post-elastic branch, as a criterion for breaking the bond.
The next section shows the behavior of concrete samples discretized by means of the bonded DEM subject to loads, whose bond breakage is ruled by the Rankine and Mohr-Coulomb yield surfaces [25].
The chosen yield surfaces have been introduced in DEMpack code [17] and tested with several samples under different loads. The code has been implemented within the open source Kratos Multiphysics framework [16]. The data preparation and visualization of results in this paper was carried out with the GiD pre- and post-processor software [18].
4 DESCRIPTION OF THE EXPERIMENTAL TESTS
Three different experimental tests on concrete samples were carried out at the laboratory at the Universitat Politecnica de Catalunya [26]. All samples were subject to an increasing load until failure. The limit stress at which the samples broke was measured and averaged. The material tested was identified as a 50 MPa concrete, with a measured Young's modulus () of 40 GPa (coefficient of variation of 2.5%). The Poisson's ratio was not measured. The same tests were modeled with the bonded DEM using the Rankine and Mohr-Coulomb yield surfaces and the DEM results were compared to the experimental values. The measured value of GPa and a Poisson's ratio value of were used in all the computations. The three tests are described next.
4.1 Test 1. Uniaxial Compressive Strength (UCS)
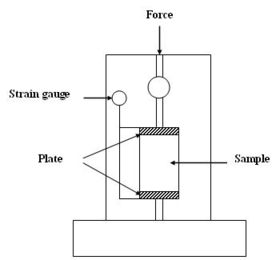
A concrete cylindrical specimen of 100 mm in diameter and 200 mm long was loaded in uniaxial compression along its symmetry axis (Figure 2).
 ] ]
|
| Figure 2: UCS test scheme [22] |
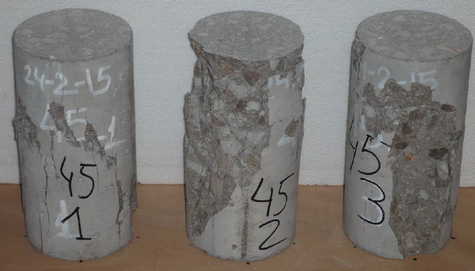
Figure 3 shows a number of broken specimens after the tests.
|
| Figure 3: Specimens after the UCS test |
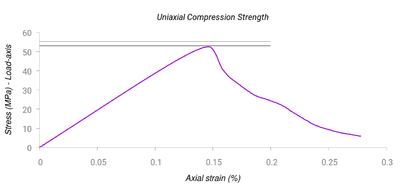
The average limit stress reached by the sample was 55 MPa. For the numerical computation with the DEM, a random packing of 65,000 spheres was used to model the cylinder. Two plates compressed the sample and the force on the upper plate was measured and plotted as stress vs. strain of the sample.
4.2 Test 2. Brazilian Tensile Strength (BTS) test
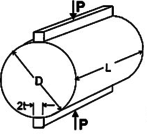
A cylindrical specimen of 100 mm in diameter and 200 mm long was loaded in a biaxial stress state, generated by a diametral compression that generates a perpendicular, diametral traction (Figure 4). The relative velocity of the plates is 0.1 m/s.
 ] ]
|
| Figure 4: BTS test scheme [21] |
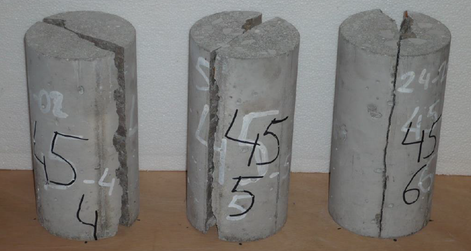
Figure 5 shows a number of broken specimens after the tests.
|
| Figure 5: Specimens after the BTS test |
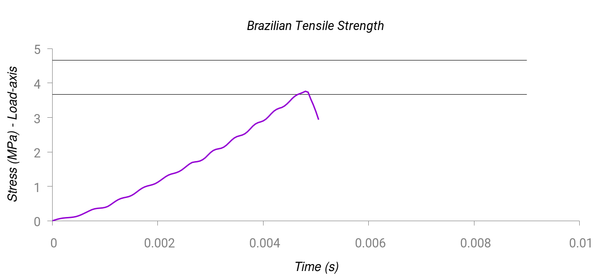
The average limit stress reached by the sample was 4 MPa. For the numerical computation with the DEM, a random packing of 45,000 spheres was used to model the cylinder. Two plates compressed the sample and the force on the upper plate was measured and plotted as stress vs. the elapsed time. The relative velocity of the plates was 0.1 m/s.
4.3 Test 3. Shear Strength test
Cylindrical specimens of 150 mm of diameter and 80 mm of height were used. The samples had two parallel flat ends and two inversed tubular coaxial borings set at diameter 45 mm and 4 mm wide. The depth of the borings was 10 mm, leaving an effective shear section height of 60 mm (see Figure 6 for clarification).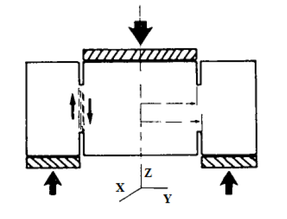
|
| Figure 6: Shear strength test scheme |
The inner cylinder was pushed downwards by a piston while the outer cylinder was supported by a holed plate.
Figure 7 shows a number of broken specimens after the tests.

|
| Figure 7: Specimens after the Shear test |
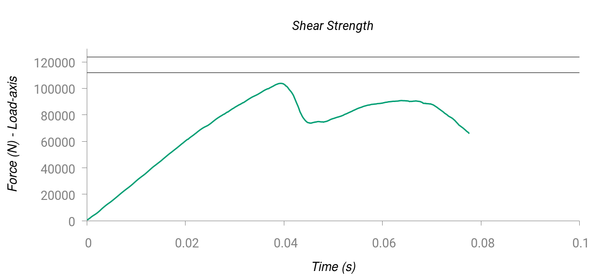
It can be observed that several types of craks were created, some around the inner cylinder of circumferencial type, some in the outer part of radial type. For the numerical computation with the DEM, a random packing of 170,000 spheres was used to model the cylinder. The upper plate, pushing the inner part of the sample, moved downwards at a constant velocity of 0.1 m/s. The force on the upper plate was measured and plotted vs. the elapsed time.
5 DEM RESULTS WITH THE RANKINE YIELD SURFACE
5.1 Yield surface definition
The Rankine yield surface is defined as
|
|
(7) |
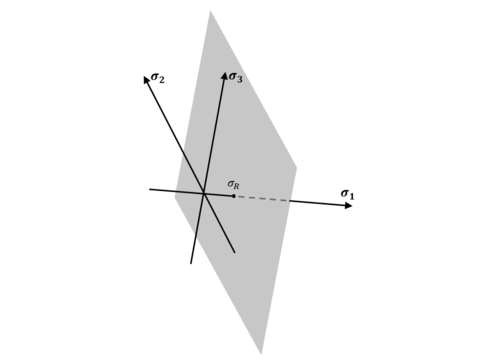
where is the maximum principal stress and is a limit value, which can be obtained experimentally as the pure tension limit stress. The behaviour of the material is considered elastic as long as (positive values are tractions and negative values are compressions). If at any bond, the bond breaks. Figure 8 depicts a representation of the Rankine yield surface in the space of principal stresses.
|
| Figure 8: Rankine yield surface in the space of principal stresses |
5.2 Computational results
For all the computations, the input value of the Young's modulus was 40 MPa, and the Poisson's ratio was taken as 0.20. After some calibration, the limite tensile stress was chosen as MPa. The results were sensitive to changes in the value of (Coulomb's friction parameter). After some calibration to match the experiments, the value chosen was , both between spheres and between spheres and walls. These material parameters were used for the DEM analysis of the three tests described in Section 4.
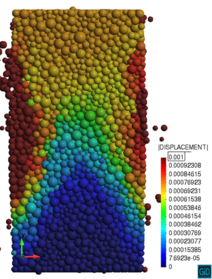
The results of the stress-strain graph for Test 1 (UCS) are shown in Figure 9. In all cases, the horizontal lines mark the upper and lower values of the limit stress obtained experimentally. Good agreement with the limit stress computed with the DEM is obtained. The broken sample is shown in Figure 10.
|
| Figure 9: Test 1 (UCS) with Rankine yield surface. Stress-strain curve. The horizontal lines indicate the band of experimental results |
|
| Figure 10: Test 1 (UCS) with Rankine yield surface. Middle plane of a broken sample at the failure load |
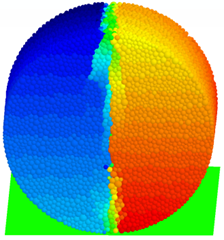
The results of the stress-time graph for Test 2 (BTS test) are shown in Figure 11. Good agreement with the experimental results is observed. The broken sample is shown in Figure 12.
|
| Figure 11: Test 2 (BTS) with Rankine yield surface. Stress-time curve. The horizontal lines indicate the band of experimental results |
|
| Figure 12: Test 2 (BTS) with Rankine yield surface. Broken sample after the computation |
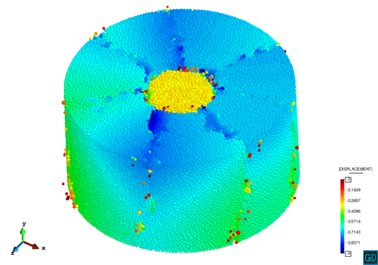
The results of the force-time graph for the Test 3 (Shear Test) are shown in Figure 13. The limit force obtained differs in 10% with the lower value of the experimental result. The broken sample is shown in Figure 14.
|
| Figure 13: Test 3 (Shear strength) with Rankine yield surface. Force-time curve. The horizontal lines indicate the band of experimental results |
|
| Figure 14: Test 3 (Shear strength) with Rankine yield surface. Broken sample after the computation |
6 MOHR-COULOMB yield surface
6.1 Yield surface definition
The Mohr-Coulomb yield surface is defined as
|
|
(8) |
where is the maximum principal stress, is the minimum principal stress, is the Mohr-Coulomb 'cohesion' stress parameter and is the Mohr-Coulomb internal friction parameter.
6.2 Computational results
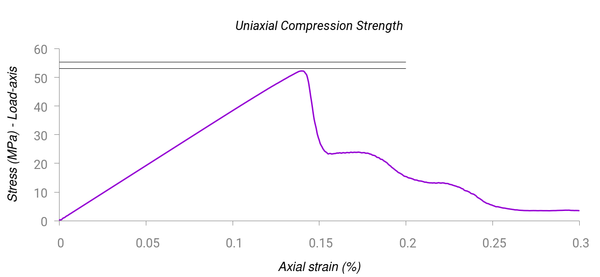
The values of and for all tests were calibrated to 14.5 MPa and 60 degrees, respectively. A value of was chosen as in Section 5.2 for the computations using the Rankine yield surface. We note that the calibration of the two material parameters and was more difficult than the calibration of .
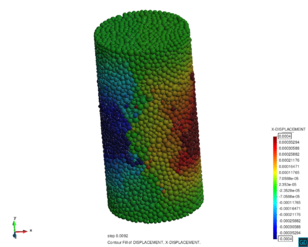
The results of the stress-strain graph for Test 1 (UCS) are shown in Figure 15. The horizontal lines mark the upper and lower values of the limit stress obtained experimentally. The broken sample is shown in Figure 16.
|
| Figure 15: Test 1 (UCS) with Mohr-Coulomb yield surface. Stress-strain curve. The horizontal lines indicate the band of experimental results |
|
| Figure 16: Test 1 (UCS) with Mohr-Coulomb yield surface. External view of the broken sample after the computation |
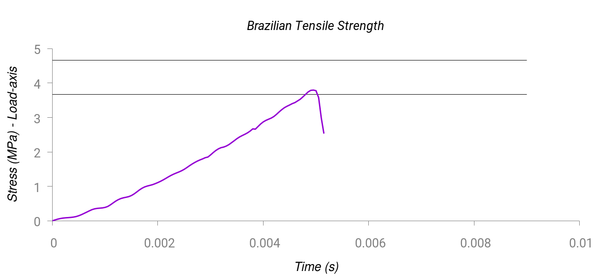
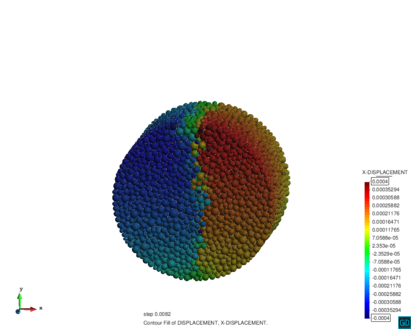
The results of the stress-time graph for Test 2 (BTS) are shown in Figure 17. The broken sample is shown in Figure 18.
|
| Figure 17: Test 2 (BTS) with Mohr-Coulomb yield surface. Stress-time curve. The horizontal lines indicate the band of experimental results |
|
| Figure 18: Test 2 (BTS) with Mohr-Coulomb yield surface. Broken sample after the computation |
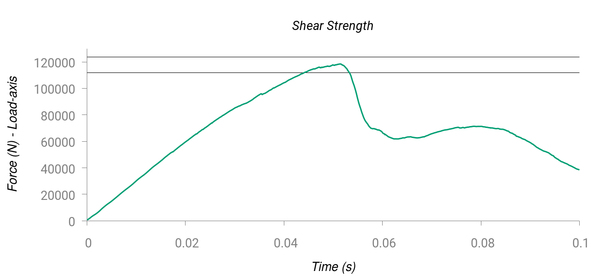
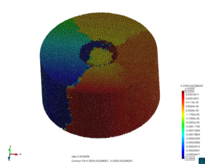
The results of the force-time graph for the Test 3 (Shear Test) are shown in Figure 19. The broken sample is shown in Figure 20.
|
| Figure 19: Test 3 (Shear strength) with Mohr-Coulomb yield surface. Force-time curve. The horizontal lines indicate the band of experimental results |
|
| Figure 20: Test 3 (Shear) with Mohr-Coulomb yield surface. Broken sample after the computation |
Good agreement between the experimental and DEM results for the limit stress (UCS and BTS tests) and the limit force (Shear strength test) were obtained.
7 CONCLUSIONS
The bonded DEM can be effectively used to model both the elastic and the post-elastic regime of materials. The presented approach accurately products the onset and evolution of cracks and the displacements and rotations of any part of the solid which might get detached due to the evolution of cracks.
The numerical examples presented in the paper show how the bonded DEM can accurately predict the non-linear behavior of the material modeled after some cracks are triggered according to the different yield surfaces considered. Any other yield surface that can be fed with the stress tensor can be used for non-linear analysis of solids. This makes the bonded DEM a powerful tool, specially considering the long tradition of development of yield surfaces in continuum mechanics.
ACKNOWLEDGEMENTS
The authors thank Prof. Juan Miquel and Dr. Francisco Zárate for their suggestions during the development of this work.
8 REFERENCES
BIBLIOGRAPHY
[1] Celigueta, M. A., Latorre, S., Arrufat, F., and Oñate, E. (2017). Accurate modelling of the elastic behavior of a continuum with the Discrete Element Method. Computational Mechanics, 60(6), 997-1010.
[2] Cundall PA, Strack OD (1979) A discrete numerical model for granular assemblies. Geotechnique 29(1):47–65
[3] Langston PA, Tüzün U, Heyes D M (1995) Discrete element simulation of granular flow in 2D and 3D hoppers: dependence of discharge rate and wall stress on particle interactions. Chemical Engineering Science 50(6):967–987
[4] Cleary P W, Sawley ML (2002) DEM modelling of industrial granular flows: 3D case studies and the effect of particle shape on hopper discharge. Applied Mathematical Modelling 26(2):89–111
[5] Xu BH, Yu AB (1997) Numerical simulation of the gas-solid flow in a fluidized bed by combining discrete particle method with computational fluid dynamics. Chemical Engineering Science 52(16):2785–2809
[6] Tsuji Y, Kawaguchi T, Tanaka T (1993) Discrete particle simulation of two-dimensional fluidized bed. Powder technology 77(1):79–87
[7] Oñate E, Labra C, Zárate F, Rojek J (2012) Modelling and simulation of the effect of blast loading on structures using an adaptive blending of discrete and finite element methods. Risk Analysis, Dam Safety, Dam Security and Critical Infrastructure Management, Chapter 53:365–372.
[8] Moreno R, Ghadiri M, Antony SJ (2003) Effect of the impact angle on the breakage of agglomerates: a numerical study using DEM. Powder Technology 130(1):132–137
[9] Oñate E, Zárate F, Miquel J, Santasusana M, Celigueta MA, Arrufat F, Gandikota R, Valiullin KM, Ring L (2015) A local constitutive model for the discrete element method. Application to geomaterials and concrete. Computational Particle Mechanics 2(2):139–160.
[10] Brown NJ, Chen JF, Ooi JY (2014) A bond model for DEM simulation of cementitious materials and deformable structures. Granular Matter 16(3):299–311
[11] Hentz S, Daudeville L, Donzé FV (2004) Identification and validation of a discrete element model for concrete. Journal of engineering mechanics 130(6):709–719
[12] Labra CA (2012) Advances in the development of the discrete element method for excavation processes. PhD Thesis, Universitat Politecnica de Catalunya, Barcelona
[13] Luding S (2008) Introduction to discrete element methods: basic of contact force models and how to perform the micro-macro transition to continuum theory. European Journal of Environmental and Civil Engineering 12(7-8):785–826
[14] Rojek J, Karlis GF, Malinowski LJ, Beer G (2013) Setting up virgin stress conditions in discrete element models. Computers and Geotechnics 48:228–248
[15] Okabe A, Boots B, Sugihara K, Chiu SN (2009) Spatial tessellations: concepts and applications of Voronoi diagrams, Vol. 501, John Wiley & Sons
[16] Dadvand P, Rossi R, Oñate E (2010) An object-oriented environment for developing finite element codes for multi-disciplinary applications. Archives of computational methods in engineering 17(3):253–297
[17] www.cimne.com/dempack
[18] Ribó R, Pasenau M, Escolano E, Ronda JS, González LF (1998) GiD reference manual. CIMNE, Barcelona
[19] Rojek J, Oñate E, Labra C, Kargl H (2011). Discrete element simulation of rock cutting. International Journal of Rock Mechanics and Mining Sciences 48(6):996–1010
[20] Oñate E, Rojek J (2004) Combination of discrete element and finite element methods for dynamic analysis of geomechanics problems. Computer methods in applied mechanics and engineering 193(27):3087–3128
[21] ASTM Standard C496. Standard Test Method for Splitting Tensile Strength of Cylindrical Concrete Specimens. ASTM International, West Conshohocken, PA, U.S.A (2002)
[22] http://osp.mans.edu.eg/geotechnical/Ch1C.htm
[23] Rankine, W. M. (1856). On the Stability of Loose Earth. Proceedings of the Royal Society of London, 185-187.
[24] Belytschko, T., Liu, W. K., Moran, B., and Elkhodary, K. (2013). Nonlinear finite elements for continua and structures. John wiley & sons.
[25] Labuz, J. F., and Zang, A. (2012). Mohr-Coulomb failure criterion. Rock mechanics and rock engineering, 45(6), 975-979.
[26] Informe de resultados. Fabricación y caracterización de hormigones H30 y H50. Technical Report of the International Centre for Numerical Methods in Engineering (CIMNE), IT644, 2015. Published in Scipedia.
Document information
Published on 01/01/2019
DOI: 10.1007/s40571-019-00278-5
Licence: CC BY-NC-SA license
Share this document
Keywords
claim authorship
Are you one of the authors of this document?