D8.2 (WP8): Cost-benefit analysis stakeholder report
Responsible Partner: ATEKNEA
Contributor(s): TSI, CIMNE, COMPASSIS, LLOYDS, BV, TWI, IXBLUE, TUCO, DANAOS, SOERMAR, FOINIKAS, ANEK
| Dissemination Level | ||
| PU | Public | |
| PP | Restricted to other program participants (including the Commission Services) | |
| RE | Restricted to a group specified by the consortium (including the Commission Services) | |
| CO | Confidential, only for members of the consortium (including the Commission Services) | x |
Document Information Table
| Contract number: | 723360 | ||||
| Project acronym: | FIBRESHIP | ||||
| Project Coordinator: | TSI | ||||
| Document Responsible Partner: | ATEKNEA SOLUTIONS EUROPE | ATEKNEA | |||
| Deliverable Type: | Report | ||||
| Document Title: | Cost-benefit analysis stakeholder report | ||||
| Document ID: | D8.2 | Version: 5 | |||
| Contractual Date of Delivery: | 31/05/2020 | Actual Date of Delivery: | 03/06/2020 | ||
| Filename: | D8.2_Cost-benefit analysis stakeholder report | ||||
| Status: | Final document | ||||
Authoring & Approval
| PREPARED BY | ||||
| Author | Date | Modified Page/Sections | Version | Comments |
| ATEKNEA | 20/05/2020 | ALL | V1 | Creation of the document |
| ATEKNEA | 28/05/2020 | Minor Modifications | V2 | Revision of the document |
| TSI | 02/05/2020 | Slight modifications all over the document | V3 | General review |
| ATEKNEA | 02/05/2020 | Slight modifications all over the document | V4 | Final Review |
| TSI | 03/06/2020 | NA | V5 | Small Modifications. Document approval |
| APPROVED BY | ||||
| Name | Role | Partner | Date | |
| Document Manager | Attila Uderszky | Task Leader | ATEKNEA | 03/06/2020 |
| Document Approval | Alfonso Jurado | Project Coordinator | TSI | 03/06/2020 |
EXECUTIVE SUMMARY
The objective of the present report D8.2 in relation with Task 8.3 in Work Package 8 was to provide cost benefit analysis support to FiBRESHiP partners throughout to entire project in the technical work packages related to the analysis of large-length fibre-based commercial vessels (FRP) such as the three types targeted in the project: container ship, Ro-Pax, and Fishing Research Vessel (FRV) and to benchmark them with conventional steel (BAU) vessels. Technical decision support with cost-benefit analysis included production, operation and dismantling of the above mentioned vessels of the same size by using NPV, RRI and ROI calculations, with the reflection of operational costs in fuel saving due to weight reduction. The deliverable reflects to the needs of industry stakeholders by revealing cost-benefit information and concludes with the financial comparison between conventional (steel) and FRP vessels.
TABLEOF CONTENTS
1. INTRODUCTION 6
2. OVERVIEW OF THE FIBRESHIP SOLUTION 7
3. METHODOLOGY OF THE COST-BENEFIT ANALYSIS 8
4. INTRODUCTION TO THE COST-BENEFIT ANALYSIS TOOL WITH THE EXAMPLE OF THE THREE VESSELS 10
4.1. Dashboard 10
4.2. Sum of cost benefit and with revenue estimation 12
4.3. Visualisation of infographics and charts inthe Cost Benefit Calculator Tool 12
4.4. Operation costs 13
4.5. Cash-flow calculation, NPV, IRR and ROI 15
4.6. The price of the ship 15
4.7. Revenue estimation 16
4.8. Revenue from recycling 17
4.9. Energy Efficiency Design Index (EEDI) 17
5. VESSEL ANALYSIS AND COMPARISON 19
6. CONCLUSIONS 21
7. ANNEX I – SCREENSHOTS OF THE COST-BENEFIT ANALYSIS TOOL 22
LIST OF FIGURES
Figure 1 – Financial indicators for BAU and FRP vessel types (container, RoPax, FRV) 9
Figure 2 – Financial parameters to be set in Dashboard 10
Figure 3 – Design parameters to be set in Dashboard 11
Figure 4– Scrapping and recycling parameters to be set in Dashboard 12
Figure 5 – Costs and benefits summary table in the tool 12
Figure 6 – Visualisation of ship operating hours per months 13
Figure 7 – Visualisation of main engine load profile 13
Figure 8 – Visualisation of various operation costs 15
Figure 9 – Visualisation of NPV, IRR and ROI 15
Figure 10 – Setting up the estimation of the ship price 16
Figure 11 – Revenue estimation for FRP and BAU container ships 16
Figure 12 – Revenue estimation for FRP and BAU RoPax ships 17
Figure 13 – Revenue estimation for FRP and BAU fishing research vessels 17
Figure 14 – Recycling revenue for FiBRESHIP with scrapping materials 17
Figure 15 – Energy Efficiency Design Index for later FiBRESHiP developments 18
NOMENCLATURE/ ACRONYM LIST
| Acronym | Meaning |
| BAU | Business As Usual |
| BMC | Business Model Canvas |
| CBA | Cost-Benefit Analysis |
| CEF | Connecting Europe Facility |
| DCF | Discounted Cash Flow |
| EC | European Commission |
| EEDI | Energy Efficiency Design Index |
| EFSI | European Fund for Strategic Investments |
| EIB | European Investment Bank |
| EIF | European Investment Fund |
| ENPV | Economic Net Present Value |
| EMSA | European Maritime Safety Agency |
| ERR | Economic Rate of Return |
| ESSF | European Sustainable Shipping Forum |
| EU | European Union |
| FDR | Financial Discount Rate |
| FNPV | Financial Net Present Value |
| FRP | Fibre Reinforced Polymer |
| GDP | Gross Domestic Product |
| GHG | Greenhouse Gas |
| GSG | Green Shipping Guarantee Programme |
| ICS | International Chamber of Shipping |
| ICES | International Council for the Exploration of the Sea |
| IHM | Inventory of Hazardous Materials |
| IMO | International Maritime Organization |
| IRR | Internal Rate of Return |
| MARPOL | The International Convention for the Prevention of Pollution from Ships |
| MCR | Maximum Continuous Rating |
| MEPC | Marine Environment Protection Committee |
| NPV | Net Present Value |
| O&M | Operation & Maintenance |
| ROI | Return On Investment |
| SECA | Sulphur Emission Control Area |
| SOLAS | International Convention for the Safety of Life at Sea |
| UN | United Nations |
| UNCTAD | United Nations Conference on Trade and Development |
| URN | Underwater Radiated Noise |
| VAT | Value Added Tax |
1.
INTRODUCTION
The implementation of the cost-benefit analysis idea was brought up by the time of the FiBRESHiP proposal preparation when it was decided to include an additional task in WP8 to provide the necessary background calculations for technical work package and task leaders. Our intention was to give rapid feedbacks with economic calculations about the development of joining techniques, material selection, fire safety and recycling. The reason behind this regime was to keep development costs in bay and make warnings if a specific technology development task in FiBRESHiP would bring the solution to an unattainable market price.
In order to work out an effective cost-benefit analysis, it is imperative that reliable and valid input data is available. On many occasions major efforts were spent on retrieving reliable industry information. The first obvious source to get industry grade data were the shipyards participating as full beneficiaries in the project.
The next available data sources that were used to implement the cost-benefit analysis was the scientific literature that was extensively searched and exploited. Public and subscripted data sources were monitored, cited publications were selected in order to gain access to the most detailed background information.
However, it turned out that even databases with fee subscription have quite scarce information about the discussed topic. In those cases where referred data was not available at all selection iteration and estimations were taken into account to fill the input data gap to the cost-benefit analysis. As a natural consequence of the above mentioned attempts, the scope of the analysis had to be modified in the course of the design process.
2. OVERVIEW OF THE FIBRESHIP SOLUTION
Fibre Reinforced Polymer (FRP) has been used for many years for small and medium sized boats benefiting from the advantages of e.g., low weight and corrosion resistance. However, the transfer of this “know-how” into large size ships is not yet established. The objective of the FIBRESHIP project was to investigate whether the use of FRP materials in larger than 500 GT (according to SOLAS, resulting in vessel of over 50 meters length) vessel types can be achieved from an engineering, financial and safety point of view.
3. METHODOLOGY OF THE COST-BENEFIT ANALYSIS
With the collaboration of the project partners and its contributions of the rest of technical work packages as well as the expertise and knowledge obtained from other industrial fields an extensive research has been done and the numerous findings and communications have been achieved with other technical work packages. Still, even with the many interactions between WP8 and other work packages, the originally envisaged CBA support was not in line with the proposed objectives of the work packages and therefore a change in the CBA methodology had to be incurred.
Instead of waiting for technical work package partners’ CBA support request, a full cost-benefit analysis tool was developed by ATEKNEA that can be used now by every technical project partner to assess the financial viability of the development stages and perform a rapid cost-benefit analysis by themselves, upon data availability. This new method will help FiBRESHiP project partners and other included stakeholders to decide themselves that whether investing in FiBRESHiP is a feasible step within given fixed conditions. The first version of the CBA tool developed by ATEKNA was a single excel sheet, while the current final ones are three different individual excel files, where the cost-benefit analysis of a container, RoPax and fishing research vessel can be achieved with the option to assess net present value, return on investment and internal rate of return and to compare them with conventional steel (BAU) vessels of the same parameters (lenght, etc,).
Altogether it can be said that Task 8.3 resulted in a CBA framework tool that can be now used by anyone interested in investing into FiBRESHiP and having said that, the main outcomes of the task are the three customized CBA Calculator Tool, attached to this report.
The main purpose of the sensitivity analysis was to determine the ‘critical’ variables of the financial model. Such variables are those whose variations, positive or negative, have the greatest impact upon the project’s financial results. The analysis was carried out by varying one variable at a time and determining the effect of that change on the NPV. As a guiding criterion, the recommendation was to consider critical those variables for which a variation of ±1 % of the value adopted in the base case gives rise to a variation of more than 1 % in the value of the NPV (elasticity is unitary or greater). The tested variables in the FRP scenario were selected to be deterministically independent and as disaggregated as possible. The sensitivity analysis was carried out with the variables: the revenue, crew cost, freight rates, cargo handling cost, ship price; and especially due to its high volatility, the fuel price. In fact, in shipping often the cost of fuel can represent more than 50 % of all costs of running the ship. It is therefore a parameter that must always be analysed and tested carefully.
Critical variables identified for the container vessel were: (i) revenue, (ii) crew cost, (iii) cargo handling cost, (iv) ship price and (v) fuel price. These five variables are taken further to the switching value calculation and risk analysis.
Critical variables of RoPax according were: (i) revenue, (ii) crew cost, (iii) ship price and (iv) fuel price. These four variables are taken further to the switching value calculation and risk analysis.
The critical variables of FRV according to the table were: (i) revenue, (ii) ship price and (iii) fuel price. These three variables are taken further to the switching value calculation and risk analysis.
4. INTRODUCTION TO THE COST-BENEFIT ANALYSIS TOOL WITH THE EXAMPLE OF THE THREE VESSELS
1.1. Dashboard
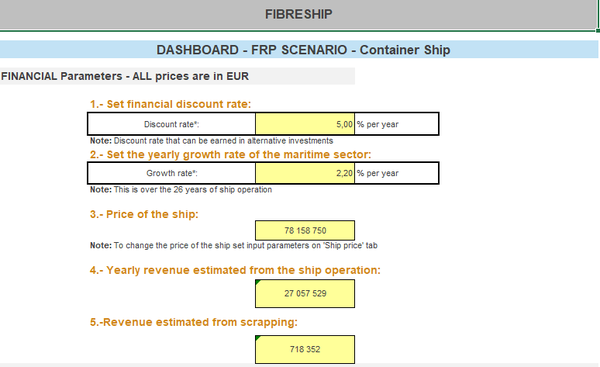
In all three calculators, the first step by the use is to set the basic parameters on the “Dashboard” tab of the tool. The following information can be set:
Financial parameters:
- Financial discount rate (% per year)
- Expected yearly growth of the maritime sector (% per year)
- Estimated price of the ship (EUR)
- Yearly revenue estimated from the ship operation (EUR)
- Revenue estimated from scrapping of the ship (EUR)
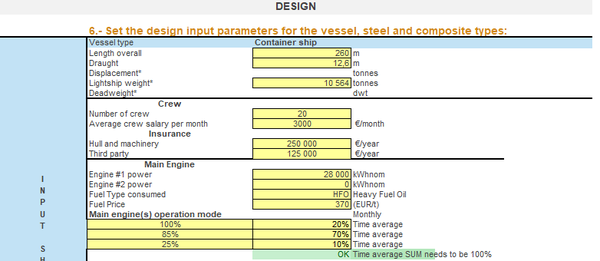
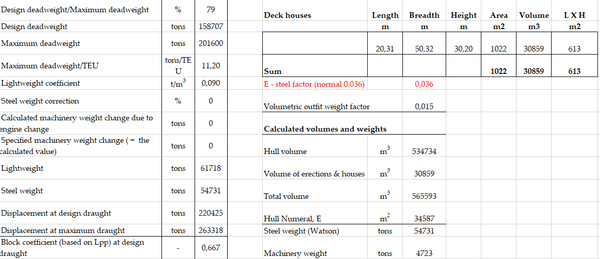
The second step is to set the values for “Design”. This can be done also in the Dashboard for both BAU and FRP ships. The following design parameters can be set:
- Overall length (m)
- Draught (m)
- Displacement (tonnes)
- Lightship weight (tonnes)
- Deadweight (dwt)
- Crew information
- Number of crew
- Average crew salary per month (EUR)
- Insurance
- Hull and machinery per year (EUR)
- Third party insurance per year (EUR)
- Main engine #1 power (kWhnom)
- Main engine #2 power (kWhnom)
- Fuel type consumed, selectable between Heavy Fuel Oil (HFO) / Low Sulphur Heavy Oil (LSHFO / Marine Diesel Oil (MDO)
- Fuel price (EUR / tonnes)
- Main engine operation modes
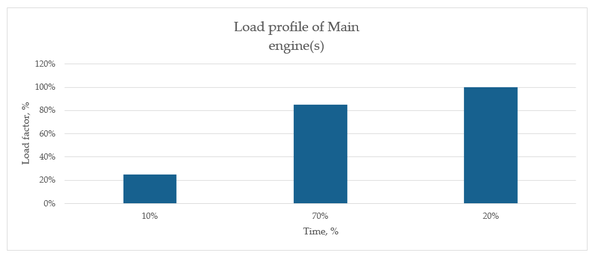
Main engine operation modes can also be selected with time averages. The Dashboard automatically checks if the time averagy summary is equal to 100%, otherwise an error message is shown to the user.
- Fuel consumption at given engine(s) operation mode (% of max power)
- Vessel operating hours around the year monthly, broken down in hours per day and hours per month
- Auxiliary engine # 1 power (kWhnom)
- Auxiliary engine # 2 power (kWhnom)
- Fuel type consumed, selectable between Heavy Fuel Oil (HFO) / Low Sulphur Heavy Oil (LSHFO / Marine Diesel Oil (MDO)
- Fuel price (EUR / tonnes)
- Auxiliary engine operation modes
- Fuel consumption at given engine(s) operation mode (% of max power)
Because of the recent changes in IMO legislation in sulphur cap, Low Sulphur Heavy Oil was added in the second project period as selectable fuel type.
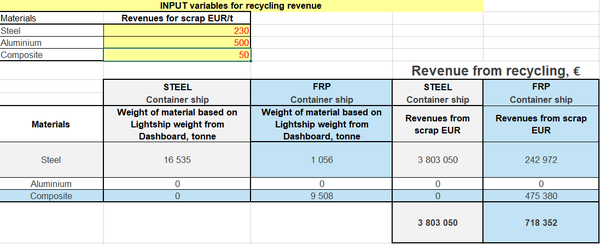
For revenues expected from recycling, disposal estimation can be done by setting the amount of various main shipbuliding materials as percentages if the lightship weight.
1.2. Sum of cost benefit and with revenue estimation
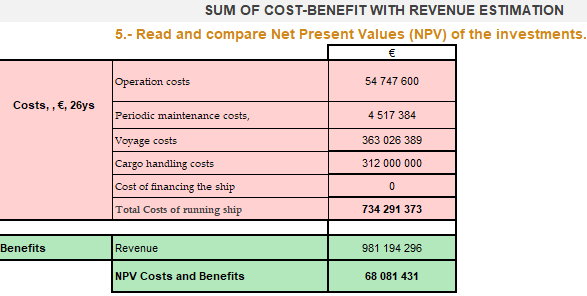
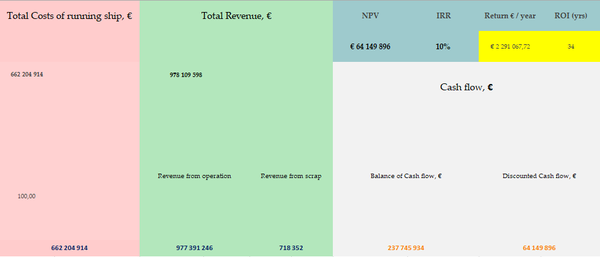
The below table summarizes and compares the net present value of the planned investment. Operation costs, periodic maintenance, voyage costs, cargo handling costs, ship financing costs are summarized as total costs for running the ship. On the benefit side, the revenue and NPV costs with benefits are visualized.
1.3. Visualisation of infographics and charts inthe Cost Benefit Calculator Tool
The tool also prepares visulisation charts automatically, according to the results of the calculation that are shown in the “Dashboard” tab of the tool.
1.4. Operation costs
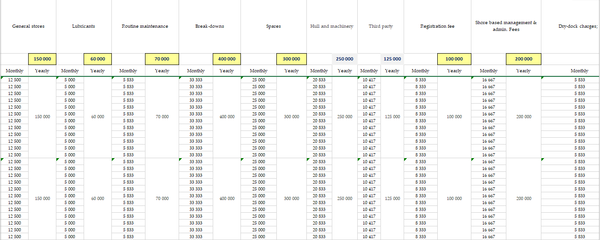
The third step is to set operation costs, which are playing major contribution to the total costs of FiBRESHiP. The CBA Tool is able to take into consideration the following operating cost items:
- General stores
- Lubricants
- Routine maintenance
- Break-downs
- Spares
- Hull and machinery
- Third parties
- Registration fee
- Shore based management and admin fees
- Dry-dock charges, cleanining, painting
- Port dues
- Loading/discharging cargo
- Service charges
- Dividend, interest
- Suez channel fee
- Panama channel fee
1.5. Cash-flow calculation, NPV, IRR and ROI
Cash-flow calculation is a default feature of the calculator tool. It gives potential investors a rapid feedback about an investments viability of FiBRESHiP within a 26 years timeframe, which is an average life cycle of a ship. Cash-flow calculation also takes into accout the increase of periodic maintenance necessity with the progression of the ship’s lifetime.
Net Present Value, Internal Return Rate and ROI in years are also automatically calculated by giving the users, investors and other stakeholders a competitive advance when evaluating investment options in FiBRESHiP.
1.6. The price of the ship
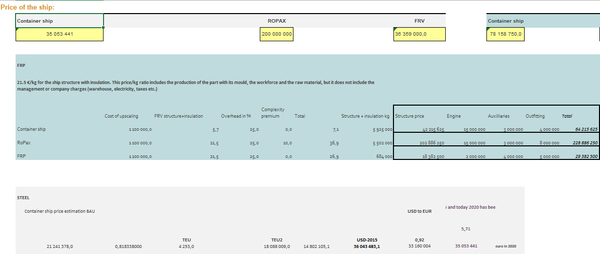
Before visualised on the “Dashboard”, the estimated price of the ship can be set on this tab as a next step of the CBA. According to the information provided by iXBlue, the basis for calculation was 21.5 €/kg for the ship structure with insulation. This price/kg ratio includes the production of the part with its mould, the workforce and the raw material, but it does not include the management or company charges (warehouse, electricity, taxes etc.)
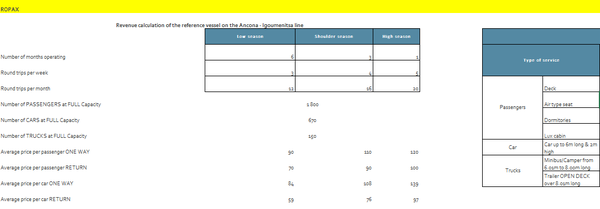
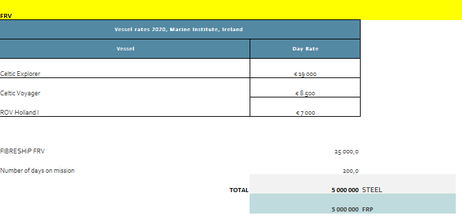
1.7. Revenue estimation
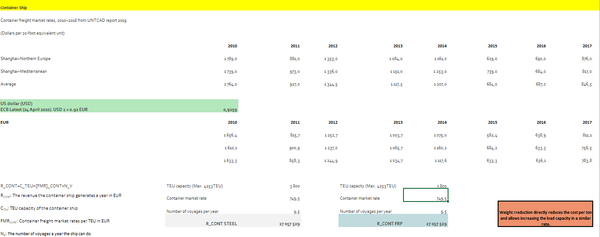
Revenue estimation is the next step in the CBA assessment that need to be set before the tool automatically calculates financial viability.
1.8. Revenue from recycling
Recycling and sustainability is getting more and more important in the shipbuilding industry, therefore the CBA Tool was also equipped with this feature as well. The main input materials (steel,aluminium and composite) can be selected on this tab, as a final step of the CBA.
1.9. Energy Efficiency Design Index (EEDI)
According to the recommendation of Bureau Veritas, the Energy Efficiency Design Index for new ships was included into the tool, as a reference table. According to IMO, the EEDI requires a minimum energy efficiency level per capacity mile (e.g. tonne mile) for different ship type and size segments. Since 1 January 2013, following an initial two year phase zero, new ship design needs to meet the reference level for their ship type. The level is to be tightened incrementally every five years, and so the EEDI is expected to stimulate continued innovation and technical development of all the components influencing the fuel efficiency of a ship from its design phase. It should be noted that the EEDI is not linked directly with the CBA Tool, it only serves a reference for later studies when the first new full scale FiBRESHiP will be manufactured. According to IMO, the EEDI is a non-prescriptive, performance-based mechanism that leaves the choice of technologies to use in a specific ship design to the industry. As long as the required energy efficiency level is attained, ship designers and builders are free to use the most cost-efficient solutions for the ship to comply with the regulations. The EEDI provides a specific figure for an individual ship design, expressed in grams of carbon dioxide (CO2) per ship's capacity-mile (the smaller the EEDI the more energy efficient ship design) and is calculated by a formula based on the technical design parameters for a given ship.
5. VESSEL ANALYSIS AND COMPARISON
After the analysis performed in Deliverable 8.3, two scenarios were developed for comparison. First, FRP scenario, considers vessels built in composite materials keeping in mind FIBRESHIP developments and methodologies. The second one, set as Business As Usual (BAU) scenario, is a baseline ‘without‑the‑project’ setting with the reference ships built from traditional shipbuilding materials (e.g., steel) to analyse what would happen in the absence of the FIBRESHIP project. Financial indicators for both the FRP and BAU scenarios were calculated such as the: Net Present Value (NPV), Internal Rate of Return (IRR) and Payback Period. Scenarios comparison and the financial analysis revealed that an investment in an FRP RoPax ship may be an appealing opportunity. The NPV and IRR financial indicators both indicate higher returns compared to the operation of a steel RoPax. This is deriving from the high-speed service that RoPax offers, as large sized ship fuel costs are a significant factor in operation, and fast ships have higher fuel consumption. Whereas operators of a container ship can benefit from different fuel saving strategies, for example slow steaming, such options are limited for a RoPax due to the nature of its operation. The financial value that a RoPax ship operation can create is nearly €57 million over the 28 years’ time horizon of the project, which is equivalent to an annual return of €4.2 million. The Internal Rate of Return (IRR) and the Payback period are 6.85% and 17.5 years respectively.
For the container ship and the FRV, the estimated higher manufacturing costs of the FRP ships results in less favourable financial returns. Knowing that the using of a FRV is based on the better performance in operation and not on financial investment profitability, the analysis showed that operating a traditional steel-built vessel is financially more profitable compared to operating a same sized composite ship. The cost savings from the lesser operational costs of the FRP ships do not make up for the high FRP manufacturing cost. Therefore, these ship types may offer less considerable investment options for investors.
The economic analysis also showed that compared to a steel vessel, operating an FRP container ship is overall better for society as the CO2 emission-related damage costs can be reduced by €534,200 annually. Furthermore, it reduces the health-related costs of air pollution (NOX, SOX, PM) by €21,576 per day.
Overall, from a global perspective, this landmark step of using lighter FRP ships will significantly reduce the impact of ship emissions on human health and ensure a global level benefit for the population.
Two scenarios were developed for comparison. First, FRP scenario, considers vessels built in composite materials keeping in mind FIBRESHIP developments and methodologies. The second one, set as Business As Usual (BAU) scenario, is a baseline ‘without‑the‑project’ setting with the reference ships built from traditional shipbuilding materials (e.g., steel) to analyse what would happen in the absence of the FIBRESHIP project. Financial indicators for both the FRP and BAU scenarios were calculated such as the: Net Present Value (NPV), Internal Rate of Return (IRR) and Payback Period.
6. CONCLUSIONS
The Cost-Benefit Analysis Tool is ready and customized for FRP and BAU container, RoPax and fishing research vessel ships. Throughout the cost-benefit analysis process, the tool was used many times on several occasions. The main advantage of the tool is that with the supplement of detailed information (which is not always available to the users) it can provide rapid feedbacks to potential users and possible investors to “screen” the investement readiness of FiBRESHiP and to evaluate its benefits in the medium- and longer term. The CBA Tool was also fully taken advantage of at the time of the preparation of the FiBRESHiP Business Canvas and Global Business Plan, when several optimistic and pessimistic financial scenarios were simulated with the Tool for conventional steel (BAU) and FRP ships in order to compare them between the three vessel types.
According to ship operator DANAOS, the developed CBA calculator is an intuitive and comprehensive tool for the owner to do a multi-variable cost-based evaluation of an investment to a different technology (in our case FRP vessel) having as reference baseline a conventional technology in operation (existing steel vessel). In few words, Tool is a supportive financial analysis to managerial decision making for a new investment. It also allows ship owners to proceed with a quick but solid calculation of expenditures, revenues streams while assessing profitability and asset value (e.g. NPV) considering whole vessel lifespan. It binds together cost estimations with assumptions on energy footprint (environmental cost) including EEDI and by integrating C/B calculator with FIBRESHIP LCCA (from WP6), the project provides a holistic evaluation of vessel performance made of composites across all stages (from design to construction , to operation and scrapping). ATEKNEA – as the developer of the CBA Tool - intends to further upgrade the calculator beyond the project into a dedicated CBA software tool with a more user friendly GUI.
ANNEX I – SCREENSHOTS OF THE COST-BENEFIT ANALYSIS TOOL
Document information
Published on 03/06/20
Licence: CC BY-NC-SA license
Share this document
Keywords
claim authorship
Are you one of the authors of this document?


