(Created page with " ==Abstract== We investigate the impact of massive electric vehicle (EV) adoption onto the power market, both in the presence and in the absence of significant photovoltaic...") |
(No difference)
|
Revision as of 13:34, 1 June 2017
Abstract
We investigate the impact of massive electric vehicle (EV) adoption onto the power market, both in the presence and in the absence of significant photovoltaic (PV) generation. Although results are derived taking into consideration Italys power market, results are of relevance also to other industrialized countries. One of the most important outcomes of the analysis, that is, the synergistic and beneficial effect on the overall energy bill of the concomitant expansion of EVs utilization and the growth of the renewable energy generation, particularly solar photovoltaics. The Conclusions provide arguments for policymakers for further support to sustainable mobility in their regions.
Introduction
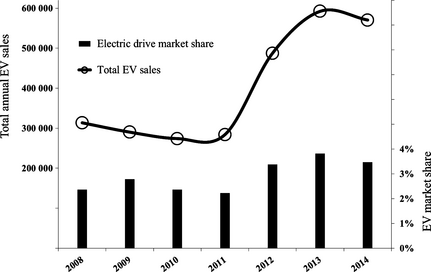
Electric vehicles (EVs), especially the plug-in hybrid (PHEV) and the all-battery vehicles (BEV), are now a commercial reality facing rapid expansion. In Norway BEVs are currently outselling conventional cars, with sales currently around 1200 a month (over 10% of all car sales) [1]. Figure 1 shows that in the US, where in early 2011 the Government enforced subsidies including a $7500 tax credit for BEVs buyers, the average annual EV sales in 2013–2014 amounted to about 580,000 units (3.6% of the overall vehicle sales), up by 107% over 2010–2011 (2.3% of the overall vehicle sales) [2].
|
|
|
Figure 1. Annual sales of BEV, PHEV and extended range electric vehicles (EREV) in the US from 2008 to 2014, along with annual EV market share. |
After years of wrong projections and failure of many start-up electric car makers (Aptera, Better Place, Coda and Fisker, to name a few), the EVs market is starting to flourish. In China, the worlds largest car market, heavily supported by the Government with the aim to alleviate the air pollution burden, save hydrocarbon fuels and boost another manufacturing leading industry, a brand new EV industry was established in the last decade [3]. After deployment of this new industry, in mid 2014 the Government agreed that 30% of all vehicles bought by central and local Government bodies between 2014 and 2016 will have to be electric. Furthermore, buyers of electric cars and other types of new energy vehicles will be exempted from sales tax (equal to 10% tax of the vehicles net value) until the end of 2017 [4].
In Japan, where Government introduced the first EV incentive program in 1996, sales of the hybrid- and EV markets in 2013 grew to an estimated 1.6 million units [5]. Large growth, exceeding 25% year over year, was lately reported also for Germany, where the EV market is at its debut [6].
In brief, a transportation technology first introduced to the marketplace in the late 1890s in Europe (and in the United States; for a nice historic account up to 2009, see [7]), to be replaced since 1910 by Fords alternative low-cost technology, that is, the internal combustion engine (ICE) vehicle produced en masse using Taylors serial production, is finally flourishing. Virtually all the large car manufacturing companies are currently expanding their offerings of EVs; while new companies and conventional utilities are literally building out the electric car charging infrastructure. For example, the overall number of public charging stations in the US rose to 19,000 by the end of 2013 compared to 3300 in 2011 [8].
Battery manufacturers too, most of which are located in South East Asia, are expanding their offerings in terms of both size and technology, switching from supplies of older generation nickel-metal hydride (NiMH) batteries to Li-ion and lithium-titanate-oxide batteries, so much that revenues from Li-ion batteries in consumer vehicles are expected to grow from $3.2 billion in 2013 to $24.1 billion in 2023 [9].
This evolution is occurring almost simultaneously to large-scale adoption of renewable energy sources that, in a world of ever more uncertain fossil fuels market due to both geopolitical instability and steadily reducing gap between economically viable crude oil supply and demand [10], for example, the global installed solar PV capacity has reached 182 GW in 2014 [11]. It was less than 1 GW in 2003.
In the course of 2015 (in the conservative case) at least another 60 GW will be installed worldwide [12]. In the following, thus, we analyze the impact of EVs' adoption onto the power market, both in the presence and in the absence of significant solar photovoltaic (PV) generation. Results are derived taking into consideration Italys power market wherein, between 2008 and 2013, a huge bulk of 18 GW photovoltaic power was installed. The methodology can be extended to other power markets in countries, both in the European Union and beyond, where prices are formed by similar market processes, so that the conclusions can be relevant to a wider international audience of policymakers.
Factors Affecting the Transition to Electric Mobility
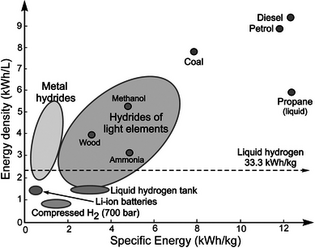
The reason why EVs for more than a century have remained a niche technology is twofold [13]. First, as shown in Figure 2, liquid fossil fuels have an energy density considerably higher than other energy vectors [14].. For comparison, 1 kg of gasoline contains about 12 kWh of intrinsic thermal energy. Storing a similar amount of energy as electricity currently requires about 33 kg of the state-of-the art industrial Li-ion batteries employed, for example, in the bestselling Nissans “Leaf” model.
|
|
|
Figure 2. Energy density of different energy vectors, including batteries and liquid hydrocarbons. [Image reproduced from ref. [14], with kind permission]. |
The second reason explaining the global success of ICE vehicles was the prolonged availability of low-cost liquid fossil fuels.
When in the early 1990s the Energy Return on Energy Investment (EROI) of crude oil began to fall toward todays barely sustainable values below 10 [10], this situation started to change.
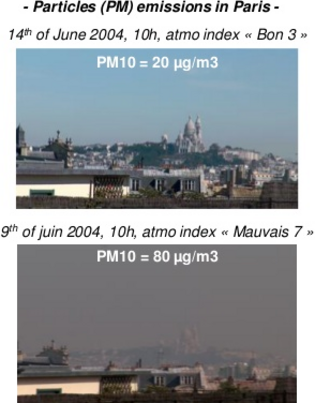
Another factor that has driven and is still driving change is that ICE vehicles are significant sources of air pollution, posing serious threats to health especially in urban areas, as combustion in petrol and diesel cars produces particulates, volatile organic compounds, hydrocarbons, carbon monoxide, ozone, lead, and various nitrogen oxides (Fig. 3).
|
|
|
Figure 3. PM emissions in Paris. Most emissions are due to ICE vehicles. [Image reproduced from ref. [13], with kind permission]. |
The first obvious benefit of electric cars in terms of sustainability is that they do not produce harmful emissions. Hence, in the 1990s incentives were initiated by local and national Governments, most notably in California and in Europe, to replace ICE light duty vehicles with EVs.
The environmental benefits of EVs are now well established. Electric cars are about four times as efficient as fossil-fueled combustion engines: while ICE engine efficiency is around 20%, electric engines achieve as much as 80–90%.
A recent thorough life cycle assessment (LCA) analysis in which four life cycle phases were considered (materials production, vehicle production, use, and end of life) found that running EVs on the current electricity mix in Europe (which includes much more renewable energy than in the US) offers a 30% reduction in Global Warming Potential (GWP) relative to traditional cars over a lifetime of 200,000 km [15], as well as less than 50% of the emissions than ICE vehicles [16].
The overall environmental impact of EVs clearly depends on the mix of energy sources generating the electricity used to recharge their batteries, as well as on the location of thermal sources. China, for example, already has 100 million EVs, most of which are electric scooters. With the current electric generation mix in China largely based on coal combustion, a recent study concluded that, for the city of Shanghai, nine people are expected to die in excess from PM2.5 (particulate matter 2.5 μm in size) emissions due to the use of gasoline cars per 10 billion km traveled each year, whereas 26 excess deaths should be expected from the same number of kilometers traveled in electric cars [17]. Such figures self-explain the major role of power generation when overall health effects of electric mobility are assessed.
In brief, the beneficial impacts of electric mobility strongly depend on the way we generate power, clearly suggesting that from the environmental, health, and climatic viewpoints the diffusion of EVs and renewable energy sources should take place concomitantly as, indeed, is happening.
From the technical and economic viewpoints, evidence of significant market shifting toward EVs is occurring in many countries. For example, in the US, drivers can now purchase an electric car for under $20,000, with an average monthly electricity cost for EV charging (normalized over a 30-day period) slightly exceeding $23 [18].
In general, the EV technology is improving, the already significant electric car charging infrastructure is spreading and mileage is rapidly growing. For example, the first Chinese sport utility vehicle with a 200 km mileage autonomy is for sale in the US since more than a year. The battery cost makes almost a third of the cost of an EV, such cost having declined from $1300 per kWh in 2007 to $500 per kWh in 2012 [19].
Following the trend of solar PV modules, further drastic reduction in battery costs will likely take place following the scale-up of industrial production [19].
Impact of the Electric Mobility on the Power Market
A subtle and yet very significant impact of the electrification of private mobility is deemed to occur on the power market. The power grid is not susceptible to be affected by relevant technical problems or stability issues, but rather to benefit from the two-way power flux capabilities of modern EVs. Some clues, although not a conclusive proof, about the resilience of the power grid to highly variable inputs can be found in the absence of problems during the steep growth of the solar PV power installed in Italy from few tenths of MW to about 17 GW during the 2009–2012 time framework.
On the other hand, the market power price is likely to be affected by the growing demand due the increasing adoption of EVs. This is the subject of the following analysis, specifically applied to the Italian wholesale electricity market (IPEX).
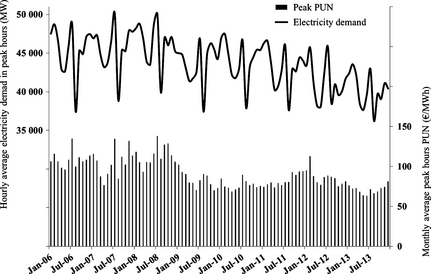
Figure 4 shows the hourly average observed power demand in the IPEX during the peak hours (8 am through 8 pm; in working days) for every month from January 2006 to December 2013. The corresponding average wholesale national power price in the IPEX (PUN) is displayed in the same chart. Data official sources are the same used in the recent analysis describing the IPEX market and the impact of PV power generation [20].
|
|
|
Figure 4. Hourly average electricity demand in peak hours and monthly average peak PUN in the IPEX. |
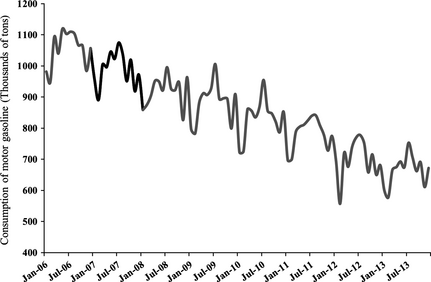
Assuming that only the lighter weight and lower power gasoline cars can be easily replaced by current EV technology, the assessment of the additional power demand should start from the current consumption of motor gasoline, which is shown in Figure 5 as a monthly time series from January 2006 to December 2013 [21]. The steep fall in gasoline consumption, totaling an overall decrease greater than 30% in 7 years, is evident from the chart.
|
|
|
Figure 5. Monthly consumption of motor gasoline in Italy. Values for year 2007 are highlighted in bold. |
The motor gasoline monthly consumption observed during 2007 is representative of the precrisis demand and represents the fuel energy to be replaced by electricity. The intrinsic energy content of motor gasoline was assumed to be 12 kWh/kg, whereas ICEs energy efficiency was set equal to 20%, and that of EV equal to 80%.
Due to their overwhelming impact on the power price paid by customers, only peak hours of the wholesale electric market will be considered. Although nowadays BEVs are mainly charged at night, our assumption is that along with the increasing diffusion of BEVs their charging during daylight (8 am to 8 pm) will be promoted in order to boost both the impact of the increased power demand upon its market price and the coupling of BEVs spreading with the expansion of the solar photovoltaic installed power. Both mileage and charging during daylight are assumed to cover 80% of the respective daily Figures.
Moreover, according to the same above arguments, only the weeks working days are considered (Monday to Friday), when power demand is much higher than in the week-end, while the gasoline consumption and charging needs are estimated at the same level as in the week-end, that is, 5/7 or about 71.4% out of the total.
Consequently, charging during peak hours will account for about (80 · 71.4/100)% = 57.1% of the total additional power demand.
The other hypotheses concern the time of complete replacement of ICE vehicles with EVs, set to span 6 or 12 years, starting from 2008,. The choice of 6 years was due to the considerations that 2007 was the last precrisis year. After that, the power demand started to fall. Year 2013 was the last year for which power data were available. The same period for the complete replacement of ICE vehicles with EVs was then doubled to 12 years in order to investigate the relative impact of the replacement time upon the power market.
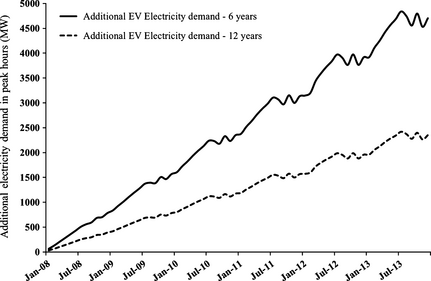
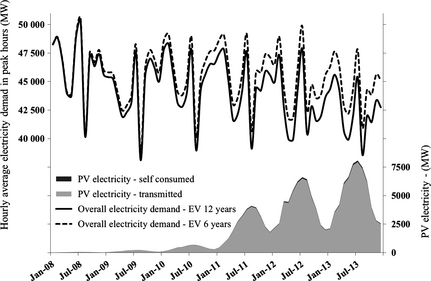
Figure 6 shows the additional electricity demand due to the hypothetical replacement of ICEVs with EVs during 2008–2013- Figure 7, as a combination of Figures 4, 6, shows the overall electricity demand that would have occurred due to the market adoption of EVs during 6 and 12 years, along with the PV electricity generation due to the installed PV park. Again, the latter data (sources and values) are those of our recent analysis [20], except for the addition of the last 3 months of 2013.
|
|
|
Figure 6. Hourly average additional electricity demand in peak hours in the IPEX due to the hypothetical complete replacement of gasoline powered ICEVs with EVs during 6 and 12 years, starting in 2008. |
|
|
|
Figure 7. Hourly average overall electricity demand in peak hours in the IPEX due to the hypothetical complete replacement of gasoline powered ICEVs with EVs during 6 and 12 years, starting in 2008, along with observed PV electricity generation. |
It is worth noting that, along with the faster adoption of EVs, during 2008–2013 the annual average hourly electricity demand would have dropped by only about 1000 MW.
A three times larger decline (3000 MW) in demand would have occurred assuming the slower adoption of EVs. Actually, due to the earnest economic crisis what really happened in Italy (Fig. 4) was a collapse of the annual average hourly electricity demand by about 5500 MW, or around 12%.
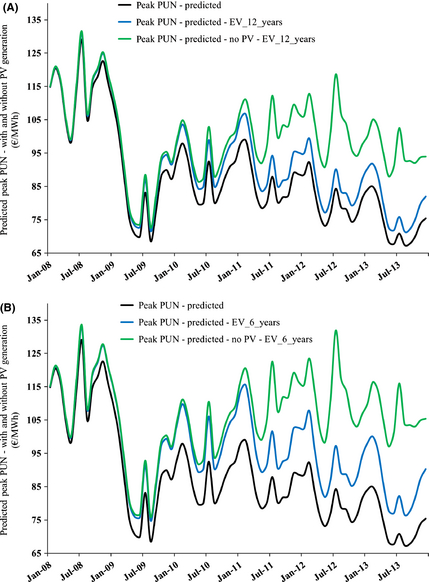
Applying the equation for the multivariate regression model correlating the monthly average peak PUN time series, that is, equation 2 in our previous study [20], with the electricity demand forcing term given by the exponential equation (equation 1 in the aforementioned study) and using the electricity demand data from Figure 4 (observed demand) and Figure 7 (electricity demand resulting from the hypothetical adoption of EVs, as well as PV electricity generation), the monthly series of average PUN in peak hours was modeled assuming no adoption of EVs and complete replacement of ICEVs by EVs in 12 years and 6 years.
The graphical results of modeling are shown in Figure 8A and B, respectively. The green graph displays the situation at each time under the further hypothesis of null PV electricity generation.
|
|
|
Figure 8. Hourly average overall electricity demand in peak hours in the IPEX due to the hypothetical complete replacement of gasoline powered ICEVs with EVs during (A) 6 years and (B) 12 years, starting in 2008, along with observed PV electricity generation. |
The merit-order effect (MOE), widely discussed in our previous work [20], appears to produce a strong impact on the monthly average PUN series, with the largest absolute effects arising under the hypothesis of faster EVs market penetration (Fig. 8B).
The applicability of this autoregressive model is allowed by the fact that, although the diffusion of EVs obviously increases the electricity demand, its overall impact does not exceed the figures used for calibration in the period 2006–2013, as made apparent from Figures 4, 7.
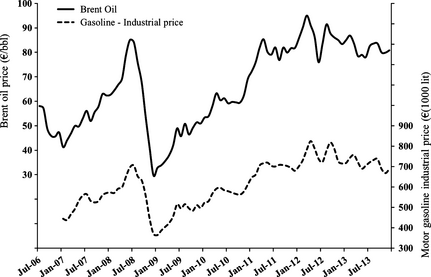
In an effort to produce a quantitative comparison of the overall community costs for the “business as usual” and for the hypothetical scenario of replacement of ICEVs with EVs, it should be first noticed that the motor gasoline industrial price is completely independent of the current demand, being rather closely tied to the Brent oil price (Fig. 9) [22].
|
|
|
Figure 9. Monthly average series of Brent Oil price and motor gasoline industrial price in Italy, starting as of January, 2007. |
Aside from a few months of the year showing a 1-month lag between oil and gasoline prices, the linear regression between the simultaneous prices of Brent oil and gasoline explains as much as 96% of the variance.
Therefore, the motor gasoline price observed during 2008–2013 can be used in the following comparative assessment, using in particular the industrial gasoline price before taxes as the obvious counterpart of the PUN in the IPEX.
The following four scenarios, concerning the peak hours as in our previous study [20], were developed and evaluated.
Business as usual with PV generation
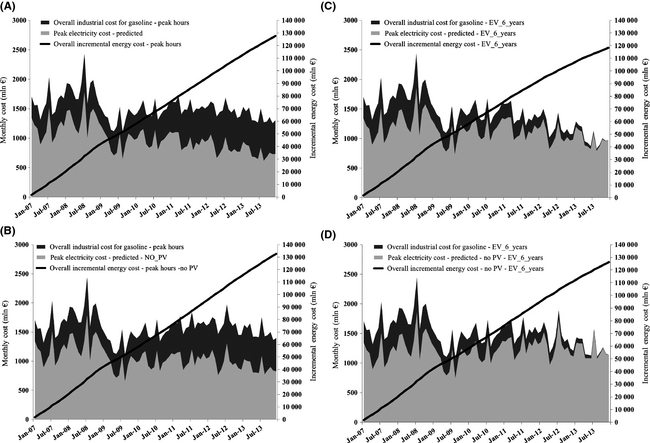
Figure 10A shows the overall industrial cost for gasoline with no market penetration of EVs and monthly gasoline consumption as in the year 2007; the modeled electricity cost with PV generation, and the incremental sum of the previous two components.
|
|
|
Figure 10. Comparative energy cost scenarios: (A) business as usual; (B) business as usual and no photovoltaic; (C) EVs replacing the ICEVs in 6 years; (D) EVs replacing the ICEVs in 6 years and no photovoltaic. See text for more details. |
Business as usual with no PV generation
Figure 10B displays the overall industrial cost for gasoline with no market penetration of EVs and monthly gasoline consumption as in the year 2007; the modeled electricity cost in the absence of solar photovoltaic installations, and the incremental sum of the previous two components.
EVs replacing the ICEVs in 6 years with PV generation
Figure 10C describes the overall industrial cost for gasoline with monthly gasoline consumption linearly dropping to zero during the 2008–2013 time range (no more motor gasoline demand); the modeled electricity cost, and the incremental sum of the previous two components.
EVs replacing the ICEVs in 6 years and no PV generation
Figure 10D finally describes the overall industrial cost for gasoline with monthly gasoline consumption linearly dropping to zero during the 2008–2013 time framework; the modeled electricity cost in the absence of solar photovoltaic installations, and the incremental sum of the previous two components.
The analysis of the four scenarios above sheds light on the evolution of energy (electricity + gasoline) cost in the presence of concomitant penetration of the PV and EV technologies, in a significantly industrialized country.
First, with no replacement of ICE by EV vehicles (Fig. 10A and B), the PV generation during the 2008–2013 period reduced the overall electricity bill by more than 5 billion €. In other words, while the cost of motor gasoline is of course the same, the electricity cost depends on the PV generation, so much that the difference of overall incremental costs during 2007–2013 is greater than 5 billion €.
Assuming complete replacement of ICEVs by EVs in 6 years, during 2008–2013 (Fig. 10C and D), the cost of motor gasoline decreases with time despite the overall increase in its unit industrial price and eventually vanishes at the end of the period. However, the electricity cost increases due to the increasing electricity demand, to such an extent that at the end of the period it approaches the cost observed during year 2007.
The overall incremental costs during the 2007–2013 range with the complete replacement of ICEVs by the EVs and no PV generation would amount to about 1.4 billion €, which is lower than in the business as usual situation with PV generation (Fig. 10A vs. D).1
In the presence of PV generation, the difference between the overall incremental costs during 2007–2013 with regard to the “business as usual” situation with PV generation (Fig. 10A and C) amounts to about 9.5 billion €, reflecting the greater and beneficial impact of the PV generation with increasing electricity demand, as already found out in our previous study [20].
The robustness of the results relies upon the robustness of equation 2 in our previous study [20], which explained 78% of the variance of the observed peak PUN series with significance much greater than 99.99%.
The significance of the differences shown in Figure 10(A–D) is understood by taking into consideration that the computed standard error on the estimated peak PUN is about 9 €/MWh.
Figure 6 shows that the average of the hourly additional electricity demand in peak hours during the 6 years replacement period is around 3000 MW. During 6 years there are about 19,000 peak hours, therefore the uncertainty of the results is on the order of 3000 · 9 · 19,000 € = 0.5 billion €, that is about one order of magnitude lesser than the above discussed differences among the values for the overall incremental energy cost shown in Figure 10(A–D).
The advantageous synergy of the PV generation and the electrification of private mobility is therefore clearly demonstrated by the comparison of the overall incremental energy costs estimated with replacement of ICEVs by EVs during 2008–2013, with PV generation (Fig. 10C) and without PV generation (Fig. 10D). In the former case, the overall incremental costs are about 8 billion € lower than without PV generation.
Summarizing, while the complete replacement of ICEVs by the EVs is always a good choice from the energy cost viewpoint, increasing the PV generation during such replacement boosts the economic savings due to the amplification of the impact of the PV generation on the wholesale power market along with the increasing electricity demand.
Outlook and Perspectives
In this study we attempt to quantify the economic convenience of the replacement of internal combustion engine vehicles with EVs by assessing the impact of the EVs market penetration on the prices formed in the IPEX both in the presence and in the absence of significant photovoltaic generation. The results, pointing to the very advantageous synergistic adoption of EVs and renewable energy sources, are significant and relevant for policymakers, infrastructure developers, and power generators.
The environmental, health, and climatic benefits were deliberately omitted in the discussion, but their relevance is obvious, as well as no mention is made about more uncertain issues such as “gray” energy flow implied by the vehicles replacement or energy need for vehicle disposal.
As the solar revolution continues with electrification of transportation now slowly, but inexorably, taking place [23], Governments in both developed and developing nations should wisely continue to encourage the adoption of electric mobility through a number of well-known incentives (tax breaks, free parking, free access to reserved areas etc.). The outcomes for their countries will be beneficial not only in terms of reduced pollution and better quality of life in urban areas, but eminently advantageous from an economic viewpoint.
Incentives will be rapidly repaid by the fall of hydrocarbon imports, as well as by the fast reduction in electricity costs as the impact of PV generation on the power market is synergistically magnified by a growing electricity demand.
In a medium-sized, well-developed market such as Italy, where the solar PV installations have grown from nearly zero to some 18 GW of nominal power in a few years, quantitative figures could be assessed. Such figures suggest that the benefits of the PV generation upon the power price – having been severely limited by the decrease in the power demand – will be significantly amplified by a program of replacement of ICE vehicles with BEVs. Such program would support the power demand and, in turn, produce increasing financial savings on the power side, while abating the gasoline bill and producing a self-sustainable virtuous cycle.
Acknowledgments
This article is dedicated to the memory of Hermann Scheer (1944–2010), for all he has done for the progress of low-cost solar energy to the benefit of mankind. Selected results of this work were first presented at the Sun New Energy Conference SuNEC 2014 (Sicily, September 8–9, 2014).
Conflict of Interest
None declared.
Note
- 1 This difference significantly increases to about 6.5 billion € when compared to the “business as usual” situation with no PV generation (Fig. 10B and D), reflecting the persistence of a very relevant economic benefit from the replacement of ICEVs with the EVs, regardless of PV generation.
References
- Revell, T. Norway experiences electric car boom in sustainable transport revolution. Available at http://www.blueandgreentomorrow.com (accessed 5 February 2014).
- The Electric Drive Transportation Association (EDTA) reports. Available at http://www.electricdrive.org/index.php?ht=d/sp/i/20952/pid/20952 (accessed 4 March 2015).
- The chart that shows why china is desperate to switch to electric Cars, Todd Woody. Available at http://www.theatlantic.com/technology/archive/2014/05/the-chart-that-shows-why-china-is-desperate-to-switch-to-electric-cars/371153/ (accessed 19 May 2014).
- Meza, E.China paving way for electric vehicles. Available at http://www.pv-magazine.com/news/details/beitrag/china-paving-way-for-electric-vehicles_100015734/#ixzz3AMT8zRDe (accessed 14 August 2014).
- Schreffler, R. Japanese auto makers rule global hybrid, EV markets. Available at http://wardsauto.com/vehicles-amp-technology/japanese-auto-makers-rule-global-hybrid-ev-markets (accessed 10 June 2013).
- Kane, M. Pure electric car sales in Germany up 25.8% year over year in april. Available at http://insideevs.com/pure-electric-car-sales-in-germany-up-25-8-year-on-year-n-April/ (accessed 4 March 2015).
- Anderson C. D., andJ. Anderson. 2010. Electric and Hybrid Cars: A History. McFarland & Company, Jefferson, NC.
- For a chart provided by the US Department of Energy showing the trend of U.S. alternative fueling stations by fuel type from 1992 to 2013. Available at http://www.afdc.energy.gov/data/10332 (accessed 4 March 2015).
- Navigant Research. 2014. Electric Vehicle Batteries. Boulder, CO.
- Heun, M. K., and M. de Wit. 2012. Energy return on (energy) invested (EROI), oil prices, and energy transitions. Energy Pol.40:147–158.
- IHS. Q3 2014 PV Demand Market Tracker, October 2014.
- Prabhu R.. (Mercom Capital Group). PV installations in 2015 to reach 54.5 GW. PV Magazine, 6 January 2015. Available at www.pv-magazine.com/news/details/beitrag/pvinstallations-in-2015-to-reach-545-gw_100017671/#ixzz3TKxzcJTJ (accessed 4 March 2015).
- Meilhan, N. Will the Electric Car Rule the Future?. April 2012, Frost and Sullivan, by Frost and Sullivan, Available at http://www.slideshare.net/FrostandSullivan/frost-sullivan-will-the-electric-car-rule-the-future-april2012 (accessed 21 March 2012).
- Sartbaeva, V. L., S. A. Kuznetsov, and P. P. Wells. 2008. Edwards, Hydrogen nexus in a sustainable energy future. Energ. Environ. Sci.1:79–85.
- Hawkins, T. R., B. Singh, G. Majeau-Bettez, and A. H. Strømman. 2013. Comparative environmental life cycle assessment of conventional and electric vehicles. J. Ind. Ecol.17:53–64.
- Faria, R., P. Moura, J. Delgado, and A. T. de Almeida. 2012. A sustainability assessment of electric vehicles as a personal mobility system. Energ. Conver. Manage.61:19–30.
- Ji, S., C. R. Cherry, M. J. Bechle, Y. Wu, and J. D. Marshall. 2012. Electric vehicles in China: emissions and health impacts. Environ. Sci. Technol.46:2018–2024.
- Pecan Street Research Institute. Report: impact of electric vehicle charging on electric grid operations could be more benign than feared. Austin TX. http://www.pecanstreet.org/2013/10/report-impact-of-electric-vehicle-charging-on-electric-grid-operations-could-be-more-benign-than-feared/ (accessed 21 October 2013).
- Khan, S., and M. Kushler. 2013. Plug-In Electric Vehicles: Challenges and Opportunities. American Council for an Energy-Efficient Economy, Washington, DC.
- Pagliaro, M., F. Meneguzzo, F. Zabini, and R. Ciriminna. 2014. Assessment of the minimum value of photovoltaic electricity in Italy. Ener. Sci. Engineer.2:94–105.
- Italian Ministry of Economic Development. Consumi Petroliferi. Available at http://dgerm.sviluppoeconomico.gov.it/dgerm/consumipetroliferi.asp (accessed 18 August 2014).
- Italian Ministry of Economic Development. Prezzi Medi Nazionali Annuali. Avialable at http://dgerm.sviluppoeconomico.gov.it/dgerm/prezzimedi.asp?prodcod=1 (accessed 4 March 2015).
- European Commission, Communication on Clean Power for Transport, 24 January 2013. Available at http://eur-lex.europa.eu/LexUriServ/LexUriServ.do?uri=COM:2013:0017:FIN:EN:PDF (accessed 5 November 2013).
Document information
Published on 01/06/17
Submitted on 01/06/17
Licence: Other
Share this document
Keywords
claim authorship
Are you one of the authors of this document?
