Abstract
Based on a large number of researches and engineering practices both domestic and overseas, it is shown that the building parameters to be determined during scheme phase can exert a great effect on the building energy consumption. In this paper, through a combination of the popular design method of building parameterization at present and the design goal of energy saving during the scheme phase, the author carries out researches on the design methods and tool development which are applicable to parameterization of building energy saving in this stage. In connection with the characteristics of both modeling process of parameterization and energy saving design, and by means of steady calculation as well as simulation, this paper establishes an simplified model to calculate the overall energy consumption of air-conditioning, heating, lighting and equipments, and ultimately gives suggestions on design of scheme for energy saving by optimization with the genetic algorithm (GA). On the basis of the model, a software platform is developed by computer language QT and openGL interface and is oriented to the design users and sets up the MMI (human–computer interaction) software interface for parameterization of building energy saving, which achieves automatic modeling of parameterization and promotes research on practical design cases.
Keywords
Scheme phase ; Parameterization of energy efficiency ; Prediction model of energy consumption ; Genetic algorithm ; Human–computer interaction
1. Introduction
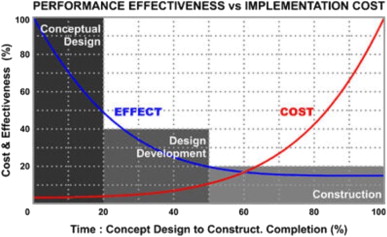
The scheme design is not only the first step of the architectural design, but also a crucial decision-making phase that contains all the design requirements of the designer and mobilizes all the design elements (Xia, 2008 ). In this phase, it will basically determine the building shape, space, skin and other parameters which are expressive and concerned by the designers on the one hand, and essential factors for the building energy consumption on the other hand. Many scholars have discussed the necessity of incorporating the energy saving into the scheme phase in their researches (de Wilde, 2004 ; Hong et al ., 2000 ; Augenbroe, 2001 ). The research of Wilde, a Dutch scholar, shows that 57% of the energy-saving technical measures should be considered in the scheme phase (de Wilde, 2004 ). With the constant development in the design progress, the potential of energy saving becomes smaller and smaller, while the costs for the same energy-saving benefits become higher and higher, as shown in Fig. 1 .
|
|
|
Fig. 1. Relationship between building performance and cost of implementation. Source : Literature Survey ( Autodesk ). |
In addition, parametric design is widely popular. However, presently many programs focus on the diversity of body and skin unilaterally, while ignoring the function, energy-saving and environmental protection, which runs counter to the original intention of parametric design on the inherent rules and logics. Therefore, setting the lowest energy consumption principle as a design control law in the architectural design may unify parameterization design and energy-efficient purposes, and achieve the parametric design optimization of building form, skin, space, thus seeking a new direction for parameterization design of architectural style (Fig. 2 ).
|
|
|
Fig. 2. Modules of energy-saving design algorithm. |
Since the 1980s, scholars from various countries began to carry out the researches on thermal environment and control system simulation technology, sequentially followed by simulation in the field of CFD (Computational fluid dynamics), lighting, natural ventilation and other related researches—all of these have gradually begun to be widely applied in engineering since 2000 (DeST, 2006 ). However, the application of building performance simulation software in the scheme phase is still rare at current. The main reason is that there is few simulation aid tools designed specifically for the scheme phase in the preliminary design or detailed design stage, thus failing to provide the detailed building information required by most of the existing simulation tools. In addition, as some important parameters which can greatly impact the performance of the building itself, such as the shape, orientation, facade design, functional classification, etc., are mainly determined in the scheme phase, and the energy saving part in the preliminary design and detailed design phase mainly refer to node design, thermal insulation materials, glass options, as well as system design of mechanical and electrical equipment, there is only a little room left for the architectural design to promote energy efficiency improvement. Therefore, in the scheme design stage, the international academic community and engineering circle have realized the necessity and importance of combining simulation aiding tools and architectural design in the research and practice of building energy saving (Chunhai, 2008 ; de Wilde, 2004 ; Zhou, 2009 ; Yu, 2009 ). Besides, in recent years the architectural designers have never stopped the research on the design theory innovation by considering the complex and non-linear characteristics of the architectural design process and production mode. Among which, the parametric design of building in scheme phase has drawn more and more attention, and has been widely applied in the practice (Huang and Xu, 2009 ; Xu et al ., 2010 ; Zhou and Zhang, ; Di and Du, 2010 ).
How to closely link the technology and design during the design process and how to reflect the evaluation of building performance in the control rules of the scheme design—these are the important issues to combine the ecology, energy-saving design concepts and parameterization. Based on the most energy-efficient procedures, this paper establishes the procedures and technical system to generate energy-saving parameterization design in the scheme phase, builds the MMI (human–computer interaction) software platform tool based on the model, and carries out the analysis of application case.
2. Parameterization algorithm of energy efficient design
The calculation model of scheme phase shall meet the following requirements: firstly, the physical information of building can be input in the form of parameters instead of detailed modeling; secondly, the calculation of building energy consumption is rapid, and it can reflect the correct trend of parameter optimization; thirdly, the output results can be directly used to make effective modification suggestions to the design parameters.
During the parametric design process, the control law of scheme generation should be determined. The algorithm of building energy saving parameterization includes the overall building energy consumption model and the scheme optimization method from the aspect of energy saving.
The algorithm adopts a simplified model of the overall energy consumption. The overall energy consumption includes heating, air conditioning and lighting energy consumption.
The genetic algorithm is adopted in the optimization process. Specifically, it can optimize the parameter combination of most energy-efficient building by adopting the building energy consumption level as the criteria of survival of the fittest during the genetic algorithm, which can eliminate the unqualified schemes which fail to meet the users input conditions by means of adding punishment on the schemes.
2.1. Energy consumption model
2.1.1. Building envelope prediction model
During the scheme phase, the heat gain from the building envelope is generally obtained by calculating the heat transfer under steady state, that is, to neglect temperature change in a relatively long time step and deem it as a steady-state process. In Zeng Jianlongs doctoral thesis (Zeng, 2006 ), it has considered the external impact of design on the envelope, including the indoor air temperature, indoor heat gains, ventilation rate, and established the mathematical relationship between these design parameters and heat transfer of envelope.
In the formula, the heat transfer load for the translucent and opaque envelops, are calculated, respectively.
Among them, the formula on the heat of opaque envelope is shown as follows (W/m2 ):
|
|
( 1) |
The formula on the heat of translucent building envelope is shown as follows (W/m2 ):
|
|
( 2) |
The heat gain of building envelope by plusing both is shown as follows:
|
|
( 3) |
in the formula, e represents the absorption rate of the solar radiation on outer surface; α represents the convective heat transfer coefficient on outer surface; qsolar represents density of solar radiation received on building surface; K represents the heat transfer coefficient.
With the improved optimization formula (Chunhai, 2008 ; Zhou, 2009 ) for the cumulative load forecasting the relative error between the final predictions and detailed cumulative load generated by simulation software DeST is less than 6% (Zhou, 2009 ).
The corrections to be considered include: (1) overall temperature difference of heat transfer during the thermal process of building envelope at night; (2) correction on the night radiation; (3) correction on the air convection and heat transfer coefficient on the roof surface; (4) correction on machine halt during the weekend. The improved optimization formula is shown as follows:
|
|
( 4) |
among which, e represents the absorption rate of the solar radiation on outer surface; α represents the convective heat transfer coefficient on outer surface; K represents the heat transfer coefficient; SHGC represents the shading coefficient; ϖ represents the glazing ratio; A represents the building façade area; τ represents the cooling period; F represents the construction area; β considers the correction value by machine halt during the weekend; α considers the correction value by the air convection and heat transfer coefficient on the roof surface face; considers the correction by radiation at night; represents the overall temperature difference by air convection at night.
2.1.2. Building cooling/heating load prediction model
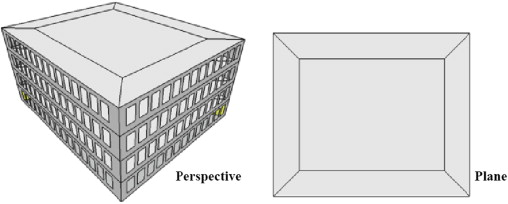
Considering a simple building divided by four exterior zones and one interior zone (Fig. 3 ), prediction equations of the cooling load in cooling season can be simplified to
|
( 5) |
|
|
( 6) |
where, o represents occupancy; pd represents human load; qlt represents lighting load; qeq represents equipment load; Δic represents the enthalpy difference between indoor air and outdoor air; fa represents the new air volume per capita; inf represents infiltration rate. N ⌢ is non-negative operator, because all the building zones are in cooling or non-air-conditioned state in the cooling season. However, either heating or cooling load may exist in either exterior or interior zones, in the heating season, therefore, the load predication equations (not given in the paper) for heating season are more complicated due to the judgment of the load type for each zone.
|
|
|
Fig. 3. A simple rectangular building. |
2.1.3. Cooling/heating EER prediction model
According to large numbers of testing data of practical commercial buildings in Beijing provided by Building Energy Research Center of Tsinghua University, cooling/heating EER prediction model is established in the form of providing EER check tables.
EERcc is the EER of cooling in the cooling season, also, EERhc and EERhh (check tables are not given) are the EER of cooling in the heating season, and of heating in the heating season, respectively. EER value of each cooling/heating source is converted to that of electricity.
2.1.4. Daylighting and lighting energy demand prediction model
Since the utilization of natural light to save lighting energy consumption is a mature technology widely used in saving of natural resources, it is necessary to consider the energy saving potential of this technology in building energy consumption prediction model. Based on the combination of energy consumption of building predictive model for natural lighting control and the energy saving evaluation standard on DA (Daylight Autonomy)of natural lighting, this paper adopts detailed simulation software to regress fitting results, and establishes the empirical formula to calculated the DA of natural lighting, thus predicting the lighting energy consumption.
It adopts DA all the year around as the evaluation criteria to assess the energy saving potential of natural light. This criterion refers to the ratio of the cumulative time during which the interior illumination is not less than required and the total time required for indoor lighting (Reinhart ).
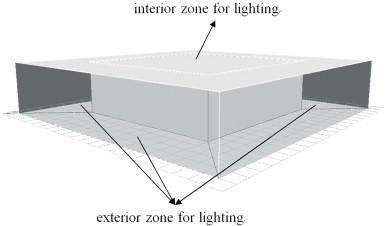
From the lighting point of view, the model divides the building into exterior and interior zones to fit DA of natural lighting and design the formula of parameter relationship. Besides, different mathematical relationships have been established for the models with orientation. The lighting model including interior zone and exterior is shown in Fig. 4 .
|
|
|
Fig. 4. Simplified model of day lighting simulation. |
Relationship between lighting energy consumption and DA of day lighting is shown as follows:
|
|
( 7) |
among them, ρ represents the artificial lighting power density, DA represents Daylight Autonomy of day lighting; F represents the lighting area.
Including the total building energy consumption of exterior zone and interior zone for lighting:
|
|
( 8) |
among which, DAi refers to DA of day lighting of each building orientation; Fexi refers to the area of exterior zone for lighting; Fin refers to the area of interior zone for lighting.
There are two major kinds of artificial lighting control modes combined with the day lighting–dimming control and on–off control. For those two control modes, there are also two different methods to calculate the DA. Under the condition of day lighting, when the room illumination value does not meet the illumination requirement, the dimming control will supplement it by the artificial lighting to reach the illumination requirement. And, the day lighting autonomy under dimming control equals the ratio of indoor illuminance value and the required illuminance value. However, the mode of on–off control is totally dependent on artificial lighting, and the day lighting autonomy is zero at this time.
By using Software DAYSIM, and ECOTECT to simulate, and based on results from different cases, it obtains the relationship between DA and design parameters (window-to-wall ratio, glass transmittance and room depth) ( Yu, 2009 ):
|
|
( 9) |
among which, h represents storey height; r represents the room depth; δ represents the glass transmittance. The coefficients β are obtained by fitting. And each orientation has a series of β value. By substituting the DA value into Eq. (8) , the building lighting energy consumption can be calculated.
And the coefficients β is obtained by linear interpolation when the glazing ratio is given. For example the glazing ratio is 0.36, the coefficients β is calculated as follows:
|
|
( 10) |
2.1.5. Building total energy demand prediction model
With the sub-models described above, the annual total energy demand of a building is calculated as
|
|
( 11) |
2.2. Optimization
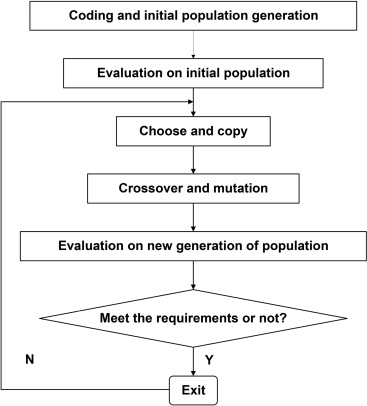
The practice of using the genetic algorithm as the optimization of building performance parameterization design scheme starts from architect and theorist Karl Chu and John Frazier. They introduced the research results of genetic algorithm into the building design and established Evolution Architecture. In which, the building is seen as a kind of life, and its growth process would follow evolution process of the generation, inheritance and mutation as same as other species in nature. The genetic algorithm flow is shown in Fig. 5 .
|
|
|
Fig. 5. Genetic algorithm flow. |
When applying the genetic algorithm into the scheme design of an architectural design, it should appropriately select the encoding operator and transfer problem into model. By taking the building design information to be optimized (physical size of the building, building envelope performance, matching of equipment and system, etc.) as genes, building energy consumption as a fitness function, energy consumption level as the criteria for survival of the fittest; it ultimately obtains the most energy-efficient building scheme. In practical applications, there are still shortcomings in genetic algorithms and the algorithm is also constantly being improved. This paper introduces two new methods into the standard genetic algorithm.
2.2.1. Multi-island genetic algorithm
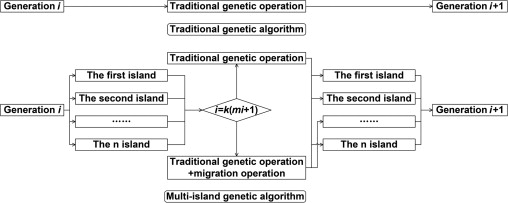
The genetic algorithm is designed to calculate the local optimal solution first by convergence rather than the global optimal solution. By taking multiple islands as the population generation method, the genetic algorithm assigns the population into the different islands respectively to find the local optimal solution, which can quickly converge to the global optimal solution.
MIGA (Multi-Island Genetic Algorithm) is an improved algorithm based on the traditional genetic algorithm. The characteristic of MIGA is that population is divided into more than one group which is called “island”. Genetic processes are performed on different islands and individuals will be selected to migrate between different islands regularly. Comparison between MIGA and traditional genetic algorithm is shown in Fig. 6 . In MIGA, an initial value is set to achieve a preliminary optimal solution, then genetic operation is began from a new start point through variation and migration. Through the repeated operation, precocity is avoided, diversity of the optimal solution is ensured, and the possibility to get the global optimal solution is improved (Meng, 2008 ).
|
|
|
Fig. 6. Process of multi-island genetic algorithm. |
2.2.2. Interactive genetic algorithm
In order to reflect the impact of peoples subjective feelings on the selection, it modifies the evolutionary algorithm to the interactive genetic algorithm. Although the interactive genetic algorithm is suitable to solve the implicit evaluation, there exists a core problem to be solved in the practical application of this method, that is, user fatigue. In the interactive genetic algorithm, whether the individuals level of performance meets the needs depends on the judgment of the user. When the operation time is relatively long and the scheme is highly repetitive, the user is easy to face fatigue, so that the fitness value of evolutionary individual cannot truly reflect of the superiority and inferiority of evolutionary individual, thus affecting the quality of evolutionary results. Therefore, fatigue is problem to be solved in that it limits the range of the population and evolutionary algebra calculated by the algorithm.
Currently, the solution to this problem has two main angles. One way is to estimate by using of the fitness value, that is, to use the evaluation of small amount of individual populations to estimate other individuals, thereby reducing the workload of the user selection; another way is to accelerate the algorithm convergence rate, thus reducing the time required for evaluation.
The multi-island genetic algorithm can greatly accelerate the speed of algorithm convergence and in the following part the paper will study how to reduce user fatigue mainly from the selection on evolutionary individual.
During the scheme design process, designers mainly need to make choice in the architectural appearance. First, it should provide the design parameters weighing on the visual impact, and then calculate the difference among different population schemes, and lastly output the schemes with large differences for users to choose.
The estimation of distance-based fitness: according to the closeness evaluation between individuals, the evaluation of individuals within a certain range is deemed to be the same. Distance formula is shown as follows:
|
|
( 12) |
among which, L represents the close distance among individuals; ρ represents to weight of parameters, P represents to the different design parameters.
3. Software platform
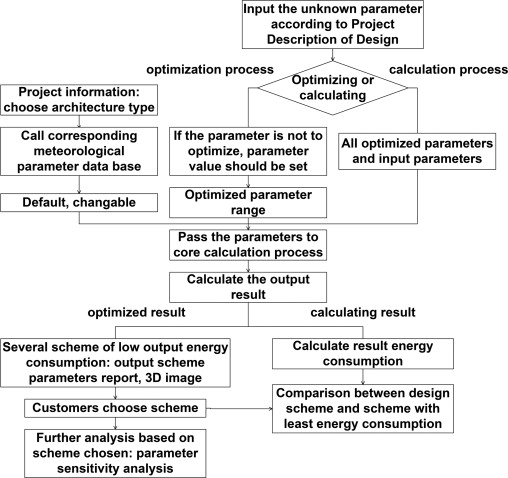
Based on the above scheme algorithm and analysis on the architectural design process, architectural design standards and architectural design habits, it has developed the software interface for designer in the scheme design by using QT computer language and openGL-based interface, and established the platform for cooperation of energy saving optimization and scheme design. The information transfer process of software design is shown in Fig. 7 .
|
|
|
Fig. 7. Software workflow. |
3.1. Main features of software
To achieve the goal of combining the energy-saving design in scheme phase and parameter optimization, the design and development of energy saving optimization software highlight the following characteristics:
- Based on the parameter optimization, combine the energy consumption calculation model and the parametric design in scheme stage
Through using the function variables to represent the design parameters, the input of different functions can acquire multiple design schemes. The changing rules and directions of design parameters are the key to the generation of parametric design schemes (Fig. 8 ).
|
|
|
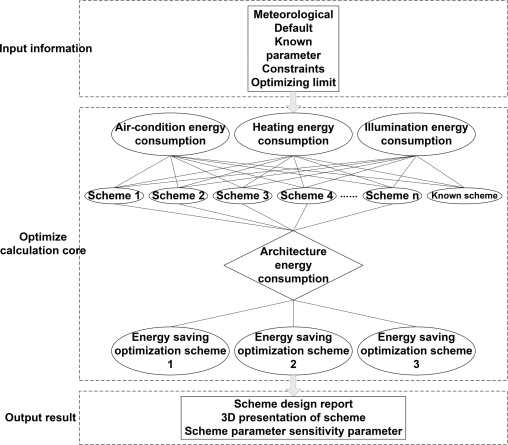
Fig. 8. Software structure. |
Starting from the design parameters, the software establishes the calculation model of overall building energy consumption and design parameters, and proposes design parameter optimization direction through optimization analysis, thus generating or improving the design.
- Responses to different design stages
During the design process, the amount of input and output information of project is different with the different time the energy-saving optimization tools involved. In response to the design task in different stages, the software provides users with the selective optimal design parameters or interfaces of specified design parameters. Thus, the design parameters which have been determined in this stage will not enter the optimization process, but directly specified by users.
- Multi-dimensional analysis
In the scheme phase, due to the uncertainty of a lot of design information, it may give the designer more inspiration if we can provide multi-faceted analysis. In this sense, software can help to provide a number of options with lower energy consumption, while calculating energy consumption levels. The results include the design parameter optimization report, summary on scheme features, three-dimensional image display of scheme, and design parameter sensitivity analysis.
- Graphical interface
In order to generate a visual expression on the scheme, the software develops a graphical interface. Based on three-dimensional interface development program and openGL program, it can operate in windows, vista and other operating systems. The program can also output the optimization calculation results into a curve showing the impact of the design parameters on building energy consumption, and design statements of energy-saving program, which can facilitate the user to get a better understanding of relationship between building energy consumption and design parameters.
3.2. Software structure
The core algorithm of optimization software for energy saving scheme is composed of building energy consumption model and genetic evolutionary algorithm. In the initial setup of the algorithm, it should also set the upper and lower limits of the optimization parameters. If setting the upper and lower limits as the design value of parameters, it can also complete the energy consumption calculation by this algorithm. The building energy consumption calculation section includes energy consumption of air conditioning, heating and lighting, day lighting systems, building atrium design, and other passive design approaches. The optimization calculation adopts the multi-island genetic algorithm, which cannot only improve the operation speed, but also increase the probability raging from search to the global optimal solution.
The optimization software interface of energy saving scheme is designed to build energy-saving computing solution in scheme stage and interactive platform in design process. The information transmission interface includes input and output.
Limit of the input parameters includes the design assignment requirements, the designer preferences, weather conditions, indoor environment control settings, work and rest of indoor personnel and equipments and other basic information. Users can choose whether to optimize parameters or calculate energy consumption.
Through algorithm optimization, the results will be output to the display interface. The interfaces include three-dimensional image display, design guidelines text and analysis curve of parameter sensitivity. As to the scheme optimization process, it can provide multiple options of lower energy consumption for users to choose. After output the feedback program of the selected scheme into the sensitivity analysis curve, it can see the energy-saving benefits obtained by changing design parameters. Meantime, it can output the text design guidelines and propose the best values and optimization direction of design parameters from the aspect of energy-saving.
The following case is an optimization calculation case, some parameter settings of which are in Table 1 . Calculation is performed to achieve an optimal scheme design and get some design suggestions.
| City | Beijing |
|---|---|
| Construction area | 10000 (m2 ) |
| Storey height | 3 (m) |
| Curtain wall/Window | Window |
| Building function | Office building |
| Lighting control mode | Combined with natural lighting+Adjustable continuously |
| Air conditioning system | FCU |
| … | … |
3.2.1. Reports
| Energy consumption level | 32.51 kWh/(m2 a) | ||
|---|---|---|---|
| Physical shape parameter | |||
| Number of floors | 8 | Atrium area ratio | 0.10 |
| South length | 30 (m) | Atrium south-to-west length ratio | 0.33 |
| South window-to-wall ratio | 0.20 | Courtyard/ atrium location | West |
| West window-to-wall ratio | 0.10 | Courtyard/ atrium type | Atrium |
| North window-to-wall ratio | 0.10 | Peripheral zone depth | 4 (m) |
| East window-to-wall ratio | 0.20 | ||
| Roof window-to-wall ratio | 0.00 | ||
| Thermal parameter | |||
| U value of south wall | 0.90 | SHGC value of south facade | 0.40 |
| U value of west wall | 0.20 | SHGC value of west facade | 0.50 |
| U value of north wall | 0.20 | SHGC value of north facade | 0.50 |
| U value of east wall | 0.20 | SHGC value of east facade | 0.40 |
| U value of roof | 0.60 | SHGC value of skylight | 0.30 |
| U value of south window | 2.20 | Comprehensive shading coefficient for air conditioning on the side atrium wall | 0.20 |
| U value of west window | 1.60 | Heat transfer ratio on the court side curtail wall | 3.00 |
| U value of north window | 1.00 | Comprehensive shading coefficient for heating on the side atrium wall | 0.80 |
| U value of east window | 1.20 | System mating | 6 |
| U value of skylight | 3.00 | Whether night ventilation is energy-saving in air-conditioning season or not | Yes |
| Whether night ventilation is energy-saving in heating season or not | Yes | ||
| Total calculation time | 3437.00 ms | ||
| No. | Suggestions |
|---|---|
| 1 | Summary of the characteristic of the most energy saving architecture scheme; |
| 2 | Building with small number of floors; |
| 3 | Length at north and south sides is shorter than that at west and east sides; |
| 4 | The best orientation facing towards due south; |
| 5 | The area of west court side and skylight occupies 10% of the roof area; |
| 6 | A small value in depth; |
| 7 | Thermal property of atrium on curtail wall: moderate in summer, higher in winter, and lower heat transfer coefficient; |
| 8 | Ability of heat insulation of outer wall: lower on the south wall, higher on the west, north and east wall; |
| 9 | Ability of heat insulation of outer window: moderate on the south wall, higher on the west, north and east wall; |
| 10 | Low window-to-wall ratio in south; |
| 11 | Low window-to-wall ratio in west; |
| 12 | Low window-to-wall ratio in north; |
| 13 | Low window-to-wall ratio in east; |
| 14 | Transmittance of outer window: moderate in the south, west, north and east window; |
| 15 | Cold source of air conditioning season: ground source heat pump (screw compressor); |
| 16 | Hot source of heating season: ground source heat pump (screw compressor); |
| 17 | Cold source of heating season: ground source heat pump (screw compressor); |
3.2.2. Parameter sensitivity curve
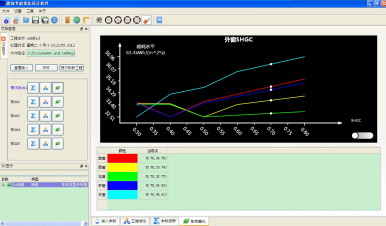
Parameter sensitivity curve type includes: number of floors, building orientation, window-to-wall ratio, heat transfer coefficient of each façade, U value of wall, SHGC value of window, atrium area ratio, courtyard area ratio, peripheral zone depth, side length ratio, cooling and heating source forms. And the sensitivity analysis of windows SHGC value is shown in Fig. 9 ( Table 4 ; Table 5 ).
|
|
|
Fig. 9. Sensitivity analysis on design parameter. |
| Case no. | Initial limit conditions | |
|---|---|---|
| Flat shape | Whether to adopt the combination of natural light for illumination control | |
| 1 | Rectangular plan | No |
| 2 | Rectangular plan | Yes |
| 3 | Square plan | No |
| 4 | Square plan | Yes |
| 5 | Concave/convex plan | No |
| 6 | Concave/convex plan | Yes |
| Case 1 | Case 2 | Case 3 | Case 4 | Case 5 | Case 6 | |
|---|---|---|---|---|---|---|
| Orientation | South by east to 22.5° | South by east to 45° | South by east to 22.5° | Due south | South by east to 22.5° | South by west to 45° |
| Window-to-wall ratio | Min. | Min. | Min. | Min. | Min. | Min. |
| Thermal protection and insulation of wall | Max. | Max. | Moderate in south and west direction, lower in north, and maximum in east | Moderate in south and west direction, and maximum in west and north direction | Moderate in east, and maximum in other three directions | Moderate in east, and maximum in other three directions |
| Thermal protection and insulation of window | Lower in south and west direction, higher in north and east direction | Lower in south and west direction, higher in north and east direction | Lower in south, and higher in other direction | Lower in south and east direction, and higher in other directions | Lower in south and west direction, higher in north and east direction | Lower in east direction and higher in other direction |
| SHGC value of window | Min. | Min. | Min. in south and north direction, moderate in east and west direction | Min. in south and north direction, moderate in east and west direction | Min. | Min. |
| Atrium/courtyard | Area ratio of court side in north is 10% | Area ratio of court side in south is 10% |
4. Case applications
In the following part, it will take the office buildings in Beijing as the cases to analyze characteristics of energy conservation schemes under different design constraints and directions of optimization parameters, such as flat shape, or whether to adopt the combination of natural light lamps. The features of energy conservation schemes in six kinds of restrictions are analyzed.
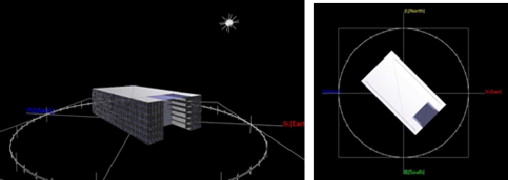
Output optimization results of software are shown in Fig. 10 , Fig. 11 , Fig. 12 , Fig. 13 , Fig. 14 ; Fig. 15 .
|
|
|
Fig. 10. Case 1. |
|
|
|
Fig. 11. Case 2. |
|
|
|
Fig. 12. Case 3. |
|
|
|
Fig. 13. Case 4. |
|
|
|
Fig. 14. Case 5. |
|
|
|
Fig. 15. Case 6. |
5. Summary and outlook
The architectural scheme phase is the key to building performance optimization and it should impart great importance on the shape control and internal logic during the parametric design process. However, as it lacks the aided design tools for parameterization design process and features during the scheme design, it results in a shortage in consideration of the physical shape on energy saving during the scheme phase, thus failing to fully explore the energy saving potential of parameters during the scheme phase. To solve this problem, this paper adopts an energy saving optimization model based on parameter characteristics during the scheme phase and generates the architectural scheme by genetic algorithm. Also, through building a software interface, it improves the actual operability of the combination of algorithms and design cases. The tools provided in this paper are based on a fast computer program designed to provide orientations of scheme optimization and multi-program comparison results with a more detailed simulation and high accuracy of software, which is suitable for scheme phase.
Acknowledgement
This research was supported by National 12th-Five S&T Projects of China (Grant nos. 2012BAJ09B03 and 2011BAJ04B06 ).
References
- Augenbroe, 2001 Augenbroe, G. 2001. Building simulation trends going into the new millennium. In: Proceedings of the Seventh International IBPSA Conference, Brazil, pp. 15–27.
- Autodesk, Autodesk, Inc. & Ecotect. Ecotect 5.60 [CP]. 〈http://ecotect.com/〉 .
- DeST, 2006 DeST; Development Team of Tsinghua University. Analysis Methods of Building Environmental System Simulation—DeST [M]; Building Industry Press, Beijing, China (2006)
- de Wilde, 2004 P. de Wilde; Computational Support for Selection of Energy Saving Building[D]; Delft University of Technology, Netherlands (2004)
- Di and Du, 2010 Bingbo Di, Xiaohui Du; Analysis on parameters acquisition in the parameterization design of skin; Huazhong Architecture, 6 (2010), pp. 22–25
- Hong et al., 2000 Tianzhen Hong, S.K. Chou, T.Y. Bong; Building simulation: an overview of developments and information sources; Building and Environment, 35 (2000), pp. 347–361
- Huang and Xu, 2009 Weixin Huang, Weiguo Xu; “Shape-forming” in nonlinear architectural design; Architectural Journal, 11 (2009), pp. 96–99
- Meng et al., 2008 Xiangzhong Meng, Xiuhua Shi, Xiangdang Du; Research of active vibration control optimization based on genetic algorithm; Computer Measurement & Control (2008), p. 01
- Reinhart, Reinhart, C.F. Daysim software [CP]. 〈http://irc.nrc-cnrc.gc.ca/ie/lighting/daylight/daysim_e.html〉 —User Manual.
- Chunhai, 2008 Xia, Chunhai, 2008. Research on Design Methods of Energy-efficient Design for Building Scheme. Ph.D. Thesis. Tsinghua University, Beijing.
- Xu et al., 2010 Weiguo Xu, Weixin Huang, Mingyu Jin; The technical exploration of “non-linear architectural design”; City Building, 6 (2010), pp. 10–14
- Yu, 2009 Yu, Qiong, 2009. Research on Design Approaches of Building Energy Efficiency in Scheme Phase. Master Thesis. Tsinghua University, Beijing.
- Zeng, 2006 Zeng, Jianlong, 2006. Research on Performance-Adjustable Envelope. Dissertation for the Doctoral Degree, Tsinghua University, Beijing.
- Zhou and Zhang, Zhou, Kai, Zhang, Yi. Parameterization Design in Temporary Project Headquarters for Yujiabao Financial District in Central Business District of Binhai District, Tianjin. Times Architecture, 2010.05
- Zhou, 2009 Zhou, Xiaoru, 2009. Research on Design Approaches of Building Energy Efficiency in Scheme Phase Based on Overall Energy Requirements. Master Thesis. Tsinghua University, Beijing.
Document information
Published on 12/05/17
Submitted on 12/05/17
Licence: Other
Share this document
Keywords
claim authorship
Are you one of the authors of this document?
