Abstract
Approximately 20,000 ha of densely built-up areas still remain in Japan. However, the advance of improvements in these areas has been very slow. Thus, making draft improvement plans through citizen–administration partnerships is indispensable to promote improvements. The planning support tool proposed in this study supports a consensus-building process during the creation of draft improvement plans. We develop a disaster mitigation performance evaluation method (DMPEM) for built-up areas at the district level and incorporate this method into a disaster mitigation support Web-GIS. However, DMPEM requires lengthy calculation time because it uses the probabilistic Monte Carlo computation method. Using this tool in real-time planning is therefore difficult. In this study, we first develop a system that reduces the calculation time required by DMPEM. Second, the support tool is used to make draft plans through citizen–administration partnerships in districts where residents are conducting various disaster mitigation activities. Finally, we investigate the usefulness of the tool for consensus building through the promotion of lively discussions among residents and clarify the issues associated with practical use of the tool.
Keywords
Planning Support system ; Web-GIS ; Disaster mitigation ; Densely built-up areas ; Workshop
1. Introduction
1.1. Background and purpose
Japan has one of the highest earthquake risks of any country in the world. The country has already experienced large-scale earthquakes, such as the Kanto Earthquake in 1923, Hanshin/Awaji Earthquake in 1995, and Tohoku Earthquake in 2011. Thus, there is an urgent need to increase disaster preparation and planning efforts to enhance the safety of those who may otherwise become victims of urban earthquake disasters. A large number of densely built-up areas that are extremely vulnerable to earthquakes (approximately 20,000 ha) still remain in Japan, and the implementation of corrective measures in these areas has been very slow.
Collaboration between local governments and residents is essential to promoting urban improvements. Building consensus is one of the most difficult planning challenges because of the various stakeholders involved. Consequently, implementing safety measures in densely built-up areas is difficult. The planning support tool proposed in this study is designed to facilitate consensus building through on-site group discussions that involve residents, government officials, and experts in a shared examination of the risks and drafting plans for a target area.
To support this type of group discussion, we have developed a disaster mitigation performance evaluation method (DMPEM) that incorporates a Web-GIS tool for use in built-up areas at a district level. The DMPEM is composed of two methods: a fire spread risk evaluation (FSRE) (Ohgai et al ., 2004 ; Ohgai et al ., 2007 ; Gohnai et al ., 2006 ) and an evaluation of emergency response and evacuation (EERE) activities (Gohnai et al., 2007 ), both of which we originally developed. With both methods, evaluating the effectiveness of disaster mitigation activities at the micro level of the areas requires considerable computation time because of the probabilistic Monte Carlo calculation method. Therefore, the availability of DMPEM during group discussions focuses on examining draft improvement plans, which is the most critical issue that needs to be addressed in developing the Web-GIS tool.
This study aims to achieve the following objectives:
- To develop a Web-GIS tool incorporating DMPEM that will aid consensus building in on-site group discussions focused on examining draft improvement plans.
- To investigate the usefulness of the proposed tool.
1.2. Perspective for developing a Web-GIS tool
PC performance is the key to reducing the DMPEM computation time. Using a high-performance PC, such as a supercomputer, is a simple method. We assume that local governments use this tool for system construction, management purposes and other practical uses. Considering the financial difficulties of local governments in recent years, using costly, high-performing PCs is not feasible. Therefore, we adopt a method using the type of PCs to which local governments generally have access to distribute the calculation process.
1.3. Review of previous research
The developing Planning Support Systems (PSS) and decision support systems (DSS) aim to facilitate the examination of plans in the field of urban planning. In particular, studies on system developments using the GIS technique have multiplied all over the world since 1960s, along with advances in computer technology. Studies on the development of PSS and DSS that incorporate GIS techniques have been reviewed and organized (Harris and Batty, 1993 ; Klosterman, 1995 ; Klosterman, 1997 ) and recently reorganized (Klosterman and Pettit, 2005 ).
In Japan, PSS and DSS have been integral to the field of urban planning since the 1980s. In particular, studies incorporating GIS, computer graphics and virtual reality have been conducted since 1990s. For example, a PSS was developed to understand the characteristics of a subject area and evaluate and share townscape images after an improvement is identified through a community workshop using virtual reality (Arima et al., 2007 ). PSS was developed to promote consensus building among community-based organizations exploring townscape designs and its effectiveness in promoting lively discussions focused on exploring draft plans for townscape images has been verified (Shen and Kawakami, 2010 ).
Although studies have been conducted on various PSSs, only a few of them consider the development of PSS and DSS for urban disaster mitigation. The development of PSS for disaster mitigation aimed at improving densely developed areas started after the 2000s. Murakami et al. (2001) developed a PSS to improve densely built-up areas. There was the pioneer study on developing PSS for disaster mitigation. Although experts, such as urban planning consultants and local government officials, use PSS, providing DMPEM information on urban areas to community-based participants is important when exploring draft improvement plans for disaster mitigation (Pearce, 2003 ). A comparison of the DMPEM data that summarize the current conditions and the DMPEM data that summarize the conditions after the improvements is important to understand how safety has been improved, particularly when residents have been involved in discussing the improvement plans (Kato et al ., 2002 ; Karashima et al ., 2014 ). After reviewing previous studies of PSS that incorporate DMPEM in Japan, Kato (2008) developed a PSS that can compare the current conditions with those after the improvements. However, PSS has not been used in on-site discussions, such as workshops, not has it been used to improve densely built-up areas.
Ohgai et al ., 2004 ; Ohgai et al ., 2007 and Gohnai et al ., 2006 ; Gohnai et al ., 2007 sought to develop PSS for use in on-site community-based activities and explore draft plans in venues, such as workshops. Although the fire spread simulation tool enables users to provide simulation results during discussions, the FSRE and EERE tools, which can evaluate quantitative disaster risks, cannot provide results during a discussion. Therefore, the draft plans being explored by the participants must be entered, the urban areas represented in the draft plans must be evaluated, and the analysis results must be provided before concluding the discussion to achieve the desired results during a discussion. The present study develops a PSS that can be used to explore draft plans for densely built-up areas by incorporating community-based activities and drawing on the results of previous studies on DMPEM development. However, using the FSRE and EERE in on-site workshops is difficult because of lengthy computation time. Therefore, the usability of these tools is yet to be verified for the promotion of consensus building.
2. Development of a system incorporating the DMPEM
2.1. Outline of the Web-GIS tool
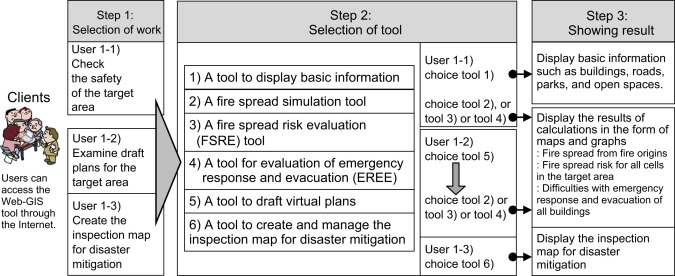
Figure 1 shows an outline of the Web-GIS tool developed in this study. This tool consists of the following six sub-tools:
- A tool for displaying the basic information of the subject area in the form of maps and providing users with geographic information on buildings and roads in the subject area.
- A tool for creating and managing the inspection map for disaster mitigation, enabling residents to easily create and manage the inspection map while plotting resources and issues related to disaster mitigation.
- A fire spread simulation tool for calculating fire spread from fire origins depending on conditions, such as wind velocity and direction, using the cellular automata (CA) model referenced above, and for providing participants with visual and numerical information on different simulation results.
- An FSRE tool for calculating the fire spread probabilities of all the cells within a subject area and for providing participants with visual information on fire spread risk in the form of maps and graphs.
- An EERE tool for calculating the probability of non-arrival at evacuation sites from all the buildings within a subject area and for providing visual information on the difficulties encountered during emergency response activities, such as evacuation and firefighting, due to building collapse and road blockages.
- A tool for creating virtual draft plans, such as rebuilding, using earthquake-resistant or fireproof materials, and road widening, through an Internet browser.
|
|
|
Figure 1. Outline of the Web-GIS tool. |
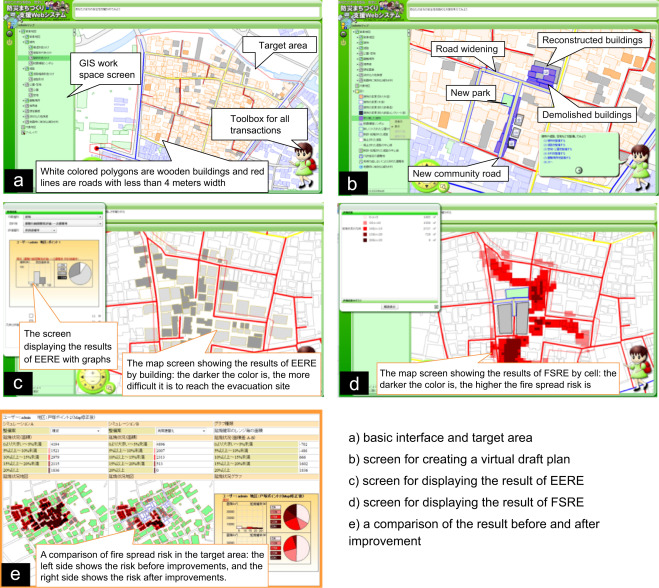
When a user first accesses the system over the Internet, the system asks the user to choose an area to be examined. Once the target area is selected, all processes are conducted using sub-tools based on the GIS data for the area (hereafter called “the target area”). Figure 2( a) provides an example of the basic interface used to display the target area. A user can select a task using the toolbox. When “Examine draft plans of the target area” is selected, a tool is activated to create virtual draft plans, and then operations, such as reconstruction or demolition of buildings, widening of roads and establishment of new parks, can be performed, as shown in Figure 2( b), using the functions incorporated into the system. Figure 2 (c) and (d) provide examples of the screen displays of EERE and FSRE results, respectively. The comparison of these results can be provided to users as shown in Figure 2 (e). Group discussion participants can examine the draft plans using visual and quantitative information provided by the sub-tools.
|
|
|
Figure 2. Examples showing the main interfaces: (a) basic interface and target area, (b) screen for creating a virtual draft plan, (c) screen for displaying the result of EERE, (d) screen for displaying the result of FSRE and (e) a comparison of the result before and after improvement. |
We assume that the spatial unit of the geographic database is that which used daily by the local government. Consequently, any citizen in the local community can use the system at any time, with certain access restrictions. However, the current system is at an experimental stage; hence, we use the data of a particular target area.
2.2. Methods of calculating FSRE and EERE in the DMPEM
2.2.1. FSRE
The method of evaluating fire spread risk proposed in this study is based on the CA model of fire spread in built-up areas, which we developed as a tool to aid community-based planning for disaster mitigation (Ohgai et al., 2007 ). The fire spread simulation using the CA model is based on an arbitrary fire origin with wind direction and velocity. In addition, all simulations differ slightly in their results because of the Monte Carlo computation used in the model, although these simulations may be conducted under identical conditions. The results are stochastic and therefore do not objectively represent fire spread risk by building or block. To objectively evaluate fire spread risk by building or block in the subject area, the calculation of the index should be based, at a minimum, on the results of a number of simulations with the same conditions from all the fire origins within the target area and with different wind directions. Therefore, using the following method, we calculate the probability of fire spread by grid cell and then adopt this value as the fire spread risk.
In the proposed model, the target area is composed of 3 m by 3 m grid cells as shown in Figure 3 . The system deals with buildings that are much longer and wider than the cell using several cells. Fire spread simulation starts with a flammable cell (i.e., a cell at the center of a wooden building) within the area. The speed of the spread inside and outside the building is different. The flammability of a cell is determined by the ratio of the area occupied by wooden or fire-prevention wooden buildings in the cell. The speed of the spread inside and outside a building is influenced by this ratio; a more detailed explanation can be found in Ohgai et al. (2007) . This model considers the different speeds of fire spread attributed to the fire-resistant characteristics of different materials, using building structure parameters that represent the combustibility of cells: wooden=1.0, fire-prevention wooden=0.6, and fireproof=0.0. A more detailed explanation can be found in Ohgai et al. (2007) . For the conditions of simulation in evaluating fire spread risk, the fire spread time from one fire origin is set at 120 min and wind speed is set at 3 m/s. Simulation under the same conditions is repeated 50 times on each of the four wind directions (north, south, east, and west). The fire spread time at 120 min is based on our experimental simulation results. Although setting the time at less than 120 min saves computation time, the fire spread result will not be suitable for objectively evaluating the risk because the size of the spread area will be too small. However, if the time is set at 3 or 4 h, the computation time clearly increases greatly, as the size of the spread area grows. Therefore, 120 min is a suitable time for our simulation using the CA model; a more detailed explanation using simulation results can be found in Ohgai et al. (2007) . With regard to wind velocity, an average value in the region that includes the target area should be used. The number of 50 iterations is based on our previous research (Ohgai et al., 2007 ), which obtained a stable evaluation value. Therefore, the number of iterations per one fire origin is 200, making the number of simulations 200 multiplied by the number of flammable cells within the area. This requirement for evaluating fire spread risk at the micro level quantitatively results in a very lengthy computation time.
|
|
|
Figure 3. Basic concepts needed for the expression of an actual built-up area in the form of cells (Ohgai et al., 2007 ). |
Based on the above-mentioned calculations, the burning times of all the cells within the target area are obtained. Based on the results, the probability of fire spread per unit area (Prb ) in each cell is calculated using the below equation, (Gohnai, 2007 ). The fire spread risk of the cells is represented as the probability.
|
|
( 1) |
where Nb is the burning time of a cell, Pf is the number of fire origin cells in the target area, Wd is the number of wind directions, In is the number of iterations (Pf times Wd times In is equal to the total number of all simulation), As is the size of the target area and Au is an area set to calculate the probability per unit area. As observed in Eq. (1) , if the variable Au is not introduced, then the probability Prb becomes smaller as the size of the target area becomes larger. Therefore, the probability must not be dependent on the size of the target area. Introducing the variable, we define the probability as the number of times that a cell burns as the fire spreads from all fire origin cells within a certain distance from the cell concerned. The area of a circle with a radius of 100 m is used as Au because the fire will not spread beyond a radius of 100 m from the fire origin when the wind velocity is 3 m/s and the fire spread time is 120 min. This fact is verified in our experimental simulations. A fire origin refers to a cell selected from the cells covering a wooden or fireproof wooden building. In other words, Pf is equal to the number of wooden or fireproof wooden buildings.
2.2.2. EERE
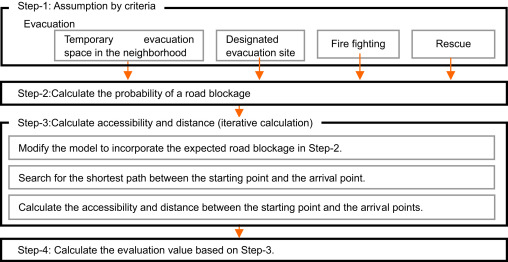
The method of evaluating the difficulty of emergency responses and evacuations is based on our previous research. The calculation flow is shown in Figure 4 . We briefly explain the calculation procedure; a more detailed explanation can be found in Gohnai et al. (2007) .
|
|
|
Figure 4. Calculating the effectiveness of an emergency response and evacuation process. |
First, for the evaluation, the user can select from the following four cases: (1) temporary evacuation space in the neighborhood, (2) designated evacuation site, (3) firefighting and (4) rescue. Next, the probability of the buildings collapsing and causing road blockages is calculated using data, such as road widths and building structures. The third step is an iterative calculation. Random numbers are used to set the conditions describing building collapse and road blockages by comparing the probability set per case and using the Dijkstra method to obtain the shortest path from the buildings to the destination (i.e., from the building to the nearest destination). The possibility of arrival and the distance traveled to each destination are then obtained for each building. Finally, the probability of non-arrival is also calculated per building. In this evaluation, several iterations are needed (2000–5000) to probabilistically obtain reliable values because of the probabilistic calculation process in the third step.
2.3. Development of the system to enable on-site use for group discussions
2.3.1. Outline of the system for distributed processing
As noted in Section 2.2 , a lengthy computation time is needed to calculate FSRE and EERE because of the probabilistic Monte Carlo calculation method. In addition, for FSRE calculations, GIS processing must generate the input data in grid cell form and output the data for visual display of the results in map and graph forms. For EERE, GIS must generate the network data as inputs to the calculation. These processes are needed whenever a user virtually applies improvements, such as rebuilding or road widening, during group discussion. Therefore, GIS geographic processing is another critical issue in enabling system use on-site. Consequently, we introduce distributed processing.
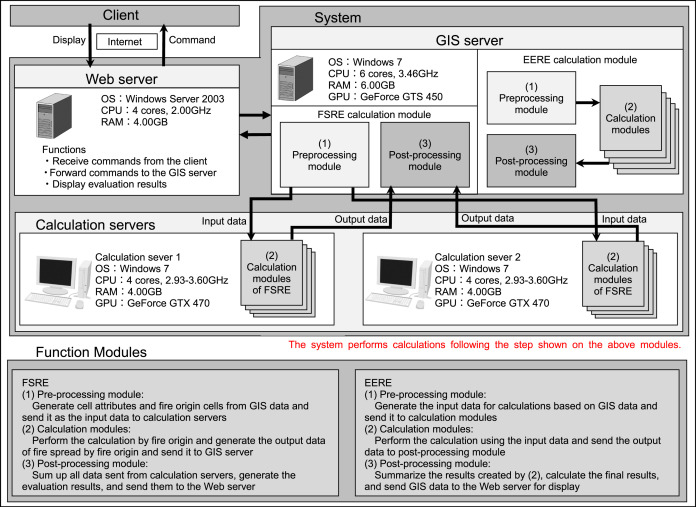
Figure 5 shows the system environment we develop using distributed processing. The system consists of one Web server, one GIS server, and two calculation servers, which can mutually exchange data through a high-speed local area network. The Web server mainly processes requests from clients through the Internet. Another important function of the system is command processing to pre-process FSRE and EERE modules within the GIS server. The GIS server pre- and post-processes FSRE and EERE and calculates the EERE. The two calculation servers share the important task of processing iterative calculations for a large number of fire spread simulations.
|
|
|
Figure 5. The system environment for performing of FSRE and EERE calculations. |
For example, in the case of FSRE, after receiving a request from a client or an Internet user, the Web server delivers the command to the pre-processing module of the GIS server. The module generates the input data of the cell attributes or fire origin cells. The two calculation servers continue asking the GIS server at a fixed time interval for fire simulation tasks from one fire origin. As long as the task is on the GIS server, the calculation servers perform the fire spread simulation calculations and return the results to the GIS server. The post-processing module of the GIS server then generates the output data for display and sends them to the Web server. Finally, the Web server scans the received data results and displays them in the form of maps and graphs. Through this process, a user can see the simulation results of the fire spread risk.
2.3.2. Parallel processing
As noted in Section 2.2.1 , the calculation of FSRE is performed by running iterations of the fire spread simulations for each fire origin. Simulations from one fire origin are independent of those from other fire origins. In other words, one simulation does not influence other simulations. Furthermore, in the calculation of EERE, the arrival probability and the distance traveled are calculated per building, based on the search for the shortest path from buildings to destinations, as shown in Section 2.2.2 . These processes are mutually independent. One calculation per building is unrelated to another. The same process is repeated for a number of times equal to the number of buildings.
Therefore, the system must take full advantage of the characteristics noted above to enable on-site use for group discussion. For this purpose, we adopt parallel processing using a CPU with multi-core units. In the case of FSRE, several modules for fire spread simulation are conducted simultaneously per fire origin. These calculation modules of FSRE and EERE are written in C++ programming language. Other modules related to geo-processing are written in Visual Basic because of constraints on the GIS software used to develop the system.
2.4. Test for the on-site use of the system
This section examines the possibility of the on-site use of the developed system by measuring the computation time. The specifications of the PCs and the Web server are the same as those in Figure 5 . The network bandwidth is 1 Gbps. The specifications of the Client PC are as follows: OS: Windows 7, CPU: Corei7-2600, 3.4 GHz, RAM: 8 GB, Radeon HD 6670.
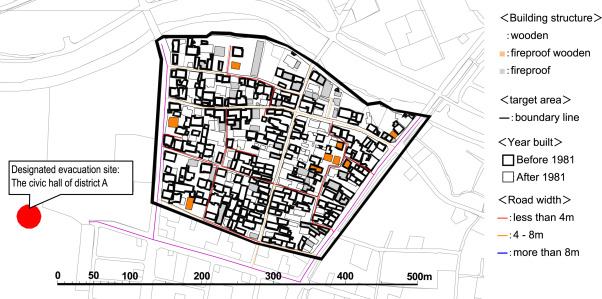
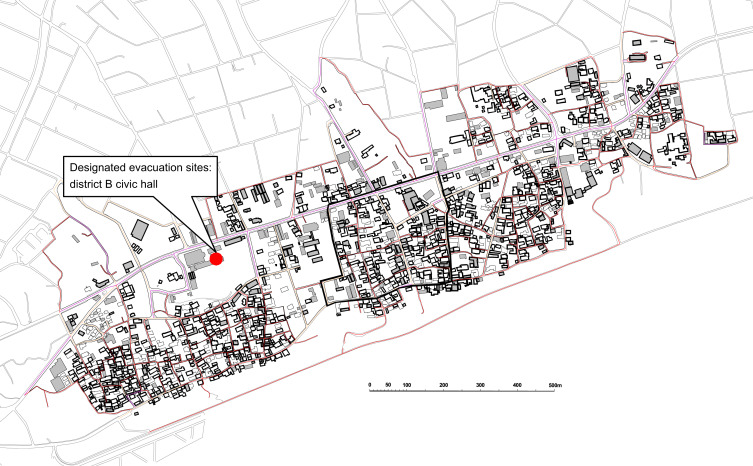
We use two different districts, A and B, as test cases. Both districts are typical, densely built-up areas, with high risk of disaster during earthquakes, but with certain differences in terms of area size and number of buildings (Table 1 and Figure 6 ; Figure 7 ). The “Year built” in the legends of Figure 6 ; Figure 8 indicate the year a building was built. Japan׳s Building Standard Law was changed in 1981, when the standard for earthquake resistant buildings was changed. Structures that have a building certification issued after 1981 have high resistance. Buildings׳ vulnerability to earthquakes is therefore classified into these two categories.
| District | District area [ha] | Number of buildings [buildings] | Total road length [m] |
|---|---|---|---|
| A | About 7.4 | 386 (wooden buildings:322) | 2320 |
| B | About 75 | 1389(wooden buildings:1174) | 26,850 |
|
|
|
Figure 6. Case study of district A. |
|
|
|
Figure 7. Case study of district B. |
|
|
|
Figure 8. Subject area for experimental on-site use of the tool. |
Regarding the conditions of the FSRE test simulations, the wind velocity is set at 3 m/s and the number of iterations per one wind direction per fire origin at 10. The decision to set the number at less than 50 iterations, as noted in Section 2.1 , is based on the need to obtain an acceptable degree of dispersion of calculated probabilities that will not interfere with assessing the improvement of draft plans, while increasing the possibility of the on-site use of the system.
In district A, the time that elapses after a client sends a processing request to the Web server until the result is received on the browser is approximately 8 min for FSRE and approximately 4 min for EERE (Table 2 ). If the size of the target area is similar to that of district A, then the system will be available for on-site use during group discussions. Compared with the response times of the system in the early stages of development, the strategy used in developing the system with distributed and parallel processing makes it possible to significantly shorten the computation time.
| District | Computation time | |
|---|---|---|
| FSRE [min.] | EERE [min.] | |
| A | About 8 | About 4 |
| B | About 80 | About 8 |
Meanwhile, in district B, the results can be calculated for approximately 80 min for FSRE and approximately 42 min for EREE. As the target area becomes larger, the calculation takes much more time. If the size of the target area is over 10 ha, then using the system in on-site group discussions becomes difficult. However, although the size of the area is similar to or larger than that of district B, the system can be used if government employees or experts conduct a pre-examination when preparing information to be provided to participants during group discussions.
Workshops and workshop discussions are usually held simultaneously with several groups. The FSRE and EERE modules in the system perform the calculations in the order that the tasks are generated. Therefore, if different tasks in two districts with similar sizes are generated at almost the same time, then one task will take almost twice the time of the other task to complete. These issues of real-time computations are described in the conclusion.
3. Experimentation using the developed tool
In this chapter, we assess the usability of the tool in group discussions by describing the results obtained from the application of the tool in actual group discussions of draft improvement plans in built-up areas at high risk during earthquake disasters.
3.1. Subject area
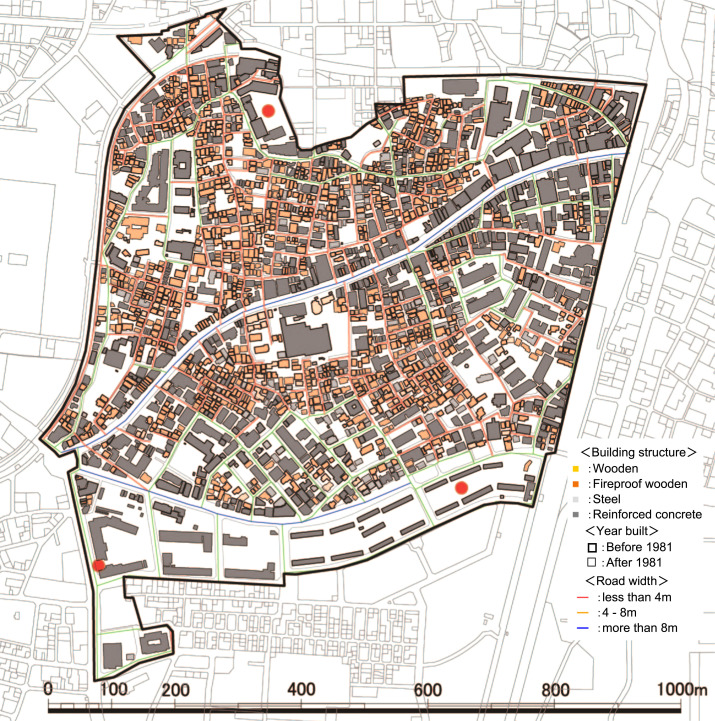
The subject area is the Totsuka district, Shinjuku ward, Tokyo (Figure 8 ). The area is divided by the main street into north and south portions. Both areas contain densely built-up old wooden houses and several narrow and dead-end roads. The community-based association in this area is well organized and conducts various activities in support of disaster mitigation.
3.2. Outline of the workshop and method of using the tool
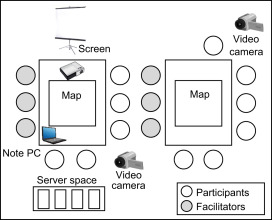
In 2011, the residents of Totsuka district, in collaboration with Waseda University, performed field studies and listed the issues affecting their district. Based on the results, a workshop was held to examine draft plans to improve the safety of the district (Table 3 ). The participants were divided into two groups: Group A, which explored the draft plans using the tool, and Group B, which explored the draft plans without the tool. Each group consisted of five to nine persons, with two or three facilitators (the main facilitator, a tool operator, and an assistant). Group A used a note-PC, projector, and screen to demonstrate the tool interface (Figure 9 ). To minimize the risk of Internet disconnection, we provided the servers and created the LAN environment. Furthermore, video cameras were placed beside each group to record the discussions and compare the discussions both groups.
| Date | Oct. 7, 2011 (First workshop) | Nov. 11, 2011 (Second workshop) |
|---|---|---|
| Participants | 17 | 11 |
| Theme |
|
Examining the draft plan. |
| Contents | Participants compare the FSRE and EERE for current conditions with basic information. | After examining the draft plans for each of the areas extracted during the first workshop, facilitators use the tool to calculate the FSRE and EERE, and participants check the results on-site while using the tool in group discussion. |
| Participants understand the high-risk areas and the causes, and extract the areas for draft plan examination in the next workshop. |
|
|
|
Figure 9. Layout for second workshop. |
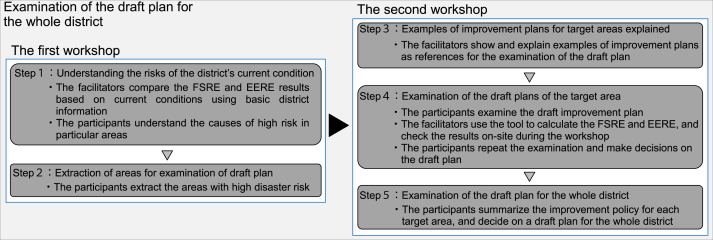
The workshop process consisted of the following five steps, which were divided into two sections. The first workshop consisted of steps 1 and 2, and the second workshop consisted of steps 3–5 (Figure 10 ).
- Step 1: Understanding the current district conditions
This step sought to help participants determine which areas were at high risk during earthquake disasters and the reasons for such risks in the subject area. Using the tool, the facilitators showed all the participants of both groups the FSRE and EERE results on the screen.
The calculation of the FSRE and EERE for the entire district during the on-site use of the tool in the group discussions was impossible because of the large size of the subject area (approximately 60 ha). Therefore, the facilitators used stored FSRE and EERE results that they calculated before the workshop. Based on these data, the facilitators alternately showed the results of the FSRE and EERE and basic information, such as building structures and road widths, on the screen.
In this way, the facilitators explained the causes for high risks in particular areas (for example, densely built-up old wooden buildings), as shown in the FSRE and EERE results.
- Step 2: Extraction of areas to examine draft plans
Based on the work completed in step 1, the facilitators asked both groups to discuss high-risk areas where improvements were essential. The participants then marked the locations of high-risk areas or the opinions that participants expressed on this subject, on a paper map. Based on these results, the facilitators selected areas on which the participants should focus later when creating draft plans.
- Step 3: Explanation of sample improvement plan for the subject area
This step was designed to help the participants understand the work they had to perform when exploring draft plans. For this purpose, the facilitators prepared several examples of improvement plans as reference materials for the participants to use when examining the draft plans. Based on these examples, the facilitators provided both groups with the FSRE and EERE results on the screen using the tool, while explaining the contents of the improvements and providing examples of the effects of these improvements. The results of the FSRE and EERE examples used in the first workshop were calculated before the second workshop.
- Step 4: Exploration of draft plans of the target area
Using the examples described in step 3, the participants explored the draft plans for decreasing earthquake disaster risks in the target areas selected in step 2. As shown in Section 2 , if the target area is approximately 10 ha, then FSRE and EERE can be calculated and the results can be displayed during group discussions. We verified the usability of the tool in this step under the assumption that disaster mitigation performance is evaluated using the FSRE and EERE results and that the subsequent revision of the draft plan helps enhance consensus among the participants. To this end, the following procedure was undertaken. Participants in Group A stated their opinions with regard to the improvements using a paper map, while referring to the given examples. At the same time, the facilitators incorporated information on the improvement content based on the opinions of the participants on the tool. The facilitators then performed the evaluation computation and showed the FSRE and EERE results. Based on these results, the participants revised the draft plans. Thus, the participants repeatedly examined and revised the draft plan, making it more effective and reasonable.
Meanwhile, the participants in Group B explored the draft plans by referring only to examples and a paper map, without using the tool. However, the facilitators in this group wrote the opinions of the participants on the improvements on the paper map.
- Step 5: Exploration of the draft plans for the entire distric
The participants explored the draft plans for each target area extracted in Step 2, using the method described in Step 4, and summarized a draft plan that explored each target area. The participants then decided on a draft plan for the entire district.
|
|
|
Figure 10. The flow of group׳s discussion when using the tool to examine draft plans. |
3.3. Analysis of the method of using the tool
3.3.1. Results of questionnaires
Questionnaires were completed by each participant after the second workshop. As noted in Section 3.2 , prior to the group discussions during the first and second workshops, all the participants in both groups confirmed the basic information describing the subject area and the FSRE and EERE results, which reflect the present conditions and the conditions after the improvements in the subject area using the facilitator-operated tool. In addition, only Group A explored the draft plans through on-site use of the tool in the discussion during the second workshop. Therefore, the participants in Group A answered all the questions, and the participants in Group B answered all but question 7. As a result, the effectiveness of the support tool differed between the two groups, and we assumed that the evaluation of the questionnaire by Group A was better than that by Group B after question 4.
Table 4 shows the results of the tabulation. Although the number of samples is small, the ratios of “extremely useful” and “useful” are over 90%, for almost all the questions in both groups. Comparing Groups A and B, the evaluation by Group A is worse for all the questions than Group B. This tendency seems to be caused by two participants with harsh opinions in Group A. From positive evaluations in relation to questions 1 and 2 in both groups, we found that confirmation of the information provided by the tool in map form helped participants understand the risk to the target area and its causes. The results from question 3 showed that all the participants felt the need for improvements more strongly after the workshop. The results for question 4 showed high usability in activating the discussion evaluation in both groups.
| No | Questions | A+B | Only A | Only B | |||||||||
|---|---|---|---|---|---|---|---|---|---|---|---|---|---|
| (1) | (2) | (3) | (4) | (1) | (2) | (3) | (4) | (1) | (2) | (3) | (4) | ||
| 1 | Do you think that you were able to clearly understand the risks caused by earthquake disasters in the target area by checking the results of the FSRE and EERE using the support tool? | 7 | 4 | 0 | 0 | 3 | 2 | 0 | 0 | 4 | 2 | 0 | 0 |
| 2 | Do you think that the support tool was useful in understanding the causes of high risks in particular places? | 6 | 5 | 0 | 0 | 3 | 2 | 0 | 0 | 3 | 3 | 0 | 0 |
| 3 | Do you think that improvements of target areas such as road widening and reconstruction are essential, compared with your thoughts before the workshop? | 8 | 3 | 0 | 0 | 3 | 2 | 0 | 0 | 5 | 1 | 0 | 0 |
| 4 | Do you think that the support tool was useful in activating the group discussions? | 5 | 6 | 0 | 0 | 2 | 3 | 0 | 0 | 3 | 3 | 0 | 0 |
| 5 | Do you think that by using the support tool you were able to extract the genuine opinions associated with the improvement plans? | 3 | 7 | 1 | 0 | 1 | 4 | 0 | 0 | 2 | 3 | 1 | 0 |
| 6 | Do you think that the support tool was useful in summarizing the opinions among participants? | 3 | 7 | 1 | 0 | 1 | 4 | 0 | 0 | 2 | 3 | 1 | 0 |
| 7 | Do you think that checking the results of the FSRE and EERE on-site for examining draft plans was useful in animating the group discussions (only group A)? | 2 | 3 | 0 | 0 | 2 | 3 | 0 | 0 | ||||
| 8 | Do you think that the process of this WS was useful in promoting lively group discussions and summarizing the opinions of participants? | 2 | 9 | 0 | 0 | 0 | 5 | 0 | 0 | 2 | 4 | 0 | 0 |
| 9 | Do you think that the support tool was generally useful in examining the draft plan of the target area? | 6 | 5 | 0 | 0 | 2 | 3 | 0 | 0 | 4 | 2 | 0 | 0 |
| 10 | Do you think that you would want to use the support tool in group discussions examining draft plans? | 5 | 6 | 0 | 0 | 2 | 3 | 0 | 0 | 3 | 3 | 0 | 0 |
Comparing the responses to questions 5 and 6, all the participants in Group A answered “extremely useful” or “useful.” However, a participant in Group B answered “not very useful.” Based on this result, the method by which the participants could check the FSRE and EERE results for the draft plans on-site, as used by Group A, was useful for extracting and summarizing their opinions. The results for question 7, which asked about the usability of the method, received positive evaluations from Group A, which we generally considered to include many members with strong opinions. In addition, one participant noted that being able to check the results of the evaluation on-site during the group discussion was useful for promoting a lively discussion.
However, comparing the responses to question 4 with those to questions 5 and 6, the effectiveness of the tool in supporting the extraction and summarization of the opinions of the participants is slightly lower than in promoting lively discussions. However, we believe that the time that was available for examining the draft plans (approximately 30 min) was inadequate for verifying the effectiveness of the support tool in extracting and summarizing the opinions of the participants. The results for questions 9 and 10 showed that using the support tool for examining the draft plans was highly effective.
Summarizing the results of the above analysis, no significant difference was observed in the results of the questionnaire evaluations by the two groups. However, the concrete opinions of the participants are more important. From the opinions shared in the free description section of the questionnaire, we received the following two evaluations: “Most important is to understand the current condition of the subject area, and the tool is useful for this.” “On-site confirmation of the results of FSRE and EERE reflecting the improvement contents is useful for understanding the effect of draft plans”.
These comments reveal that the most important issues for residents include understanding the disaster risk and the cause of the current conditions in the subject area. However, acquiring this understanding is difficult. The disaster mitigation performance evaluations (DMPE) showed the risk using color strength. Therefore, residents can easily understand the areas are at high risk. In addition, by comparing the current condition and basic information with the DMPE, they can easily understand the high-risk areas and the causes, such as the areas with old wooden buildings, which are dense, and their narrow roads, which are also dense and have high risk. Using DMPE elicits these concrete opinions. On-site confirmation of the FSRE and EERE results reflects the contents of the improvement, and residents can easily understand where a high risk decreases and how much of the risk has decreased. The effects of a draft plan expressed as numerical values and in graphical form can easily be understood.
The effects of using DMPE elicit these concrete opinions (high evaluation). In this way, two simple, very important things emerge: “understanding the risk of the current condition” and “understanding the effects of draft plans.” The support tool is useful for two things: promoting lively discussions and exploration of the next draft plan.
3.3.2. Draft plans examined in each group
Group A examined three draft plans for the target area; however, group B examined only one draft plan during the second workshop. The contents of the discussion in Group A were investigated using the examined draft plans and video camera recordings. The results are summarized in the following sections.
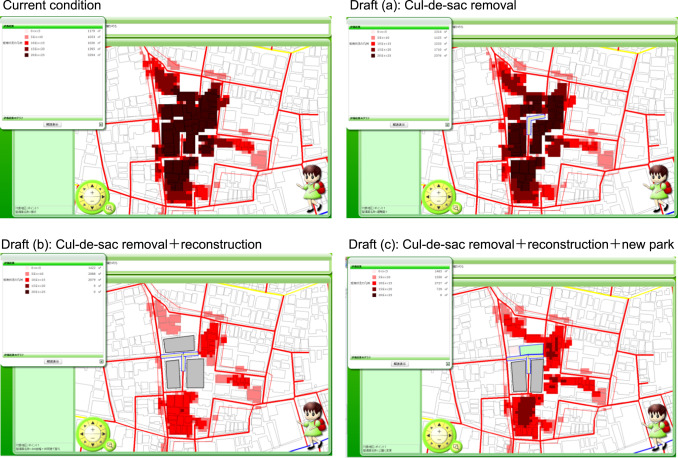
Group A participants first considered the establishment of a new road and removal of a cul-de-sac as shown in Figure 11 (a). This draft plan was influenced by an example presented by the facilitator prior to the group discussion. An intense discussion established that participants wanted to use the tool to explore the draft plan. The participants reviewed the results of the FSRE and EERE calculations and understood that the risk would be slightly reduced from the current conditions but without large improvement. Through the above-described examination, a common understanding was reached among the participants that the risk of fire spread and the possibility of building collapse would only change slightly because the densely built-up areas with old wooden buildings would remain, although the dead-end road would be improved.
|
|
|
Figure 11. Draft plans explored by group A. |
Next, a draft plan for reconstruction, along with the new road, was examined, as shown in Figure 11 (b). Based on the calculations, the participants understood that the risk would significantly decrease in this scenario. This understanding led the participants to feel it vital to discuss more effective improvements in reconstruction with new roads. In the discussion, a participant expressed a positive opinion that the placement of a new park would retain the effectiveness of the above improvement. Figure 11 (c) shows a draft plan reflecting the opinion. These FSRE and EERE results were not verified because of time limitations.
Participants in Group B could not use the tool to create draft plans and confirm the FSRE and EERE results. Therefore, opinions related to specific improvements were not immediately stated, and the progress of the discussion was slow. One participant said, “In the past, when a fire occurred, a fire-engine could not get through the narrowest road in the subject area. It is a serious problem”. After this remark, a draft plan that included widening narrow roads that were significant as evacuation routes in the subject area was explored.
As shown by the above explanation, the developed tool offers potential value. It can provide participants with the results of FSRE and EERE after improvements trigger discussions. Participants can understand the effects of the explored draft plans by confirming the results of the FSRE and EERE after improvements are made. These effects promote the exploration of draft plans that contribute to greater safety and a higher-quality living environment.
4. Conclusions
In this study, we developed a Web-GIS tool that incorporates FSRE and EERE for on-site use in group discussions. This system enables the calculation of the FSRE and EERE in approximately 8 and 4 min respectively, in district A (approximately 7 ha). Therefore, if the target area is not large, then FSRE and EERE can be calculated and the results can be displayed on-site during group discussions.
The following four findings emerged from the experimentation using the support tool:
- By comparing the basic information and results of the FSRE and EERE under current conditions, workshop participants are able to understand the earthquake disaster risk and the causes of the current conditions.
- By fully understanding the disaster risk and its causes, participants recognize the urgent need to improve protective measures in densely built-up areas.
- Providing the results of FSRE and EERE analysis after implementing protective measures is effective in promoting lively discussions.
- In particular, calculating the FSRE and EERE for the draft plans examined by the participants and displaying the results during on-site group discussions are useful in leading participants to seriously consider alternative draft plans.
Future research should address the following three issues. Two technical issues exist with regard to the system development aspect: the FSRE takes more time to calculate than the EERE, and the on-site use of the tool during group discussions may be difficult when the target area is larger than approximately 10 ha. However, at the beginning of our system development, the calculation time of DMPEM required several hundred hours. The current calculation time is approximately 10 min if the target area is approximately 10 ha, so the calculation time has been shortened dramatically. Several steps can be undertaken to further reduce the calculation time. For example, some of the technical methods include adopting GPU parallel processing in the calculation method and using high-performance PCs. Other methods involve innovations in the utilization of support tools, such as ensuring that task registration by all groups does not occur at the same time during the workshop, in consideration of the target area size (i.e., facilitators should not set target areas that are too large). If the computation time is further shortened through technical innovations, we expect that the tool can accommodate larger areas and run several simultaneous calculations during workshops with several groups.
While conducting this research, we found that the usefulness of the support tool in extracting and compiling opinions from participants is still insufficient. Therefore, several workshops must be held to accumulate more data to adequately verify the usefulness of the proposed tool.
Acknowledgments
This research was partially supported by the Ministry of Education, Science, Sports and Culture , Grant-in-Aid for Scientific Research (B), 23360267 , 2011.
References
- Arima et al., 2007 T. Arima, et al.; Utilization and evaluation of virtual reality in urban design workshops: workshop support system for space grasping and image share; J. Archit. Plan., Archit. Inst. Jpn., 617 (2007), pp. 79–85 No. 2
- Gohnai, 2007 Y. Gohnai; Development of a Support System for Community-based Disaster Mitigation Planning Integrated with a Fire Spread Simulation Model using Cellular Automata; Ph.D. thesis Toyohashi University of technology (2007)
- Gohnai et al., 2006 Y. Gohnai, et al.; Development of a Support System for Community-based Disaster Mitigation Planning Integrated with a Fire Spread Simulation Model Using CA; J.P. Leeuwen, H. Timmermans (Eds.)Springer Verlag, New York (2006), pp. 35–51
- Gohnai et al., 2007 Gohnai, Y., et al., 2007, An evaluation method for emergency response activities during earthquakes in japanese local cities: A tool for supporting community-based planning disaster mitigation. In: Proceedings of the 10th International Conference in Computers in Urban Planning and Urban Management, July 11–13, Iguassu, Brazil.
- Harris and Batty, 1993 B. Harris, M. Batty; Locational models, geographic information and planning support systems; J. Plan. Educ. Res., 12 (1993), pp. 184–198
- Karashima et al., 2014 K. Karashima, et al.; A workshop support tool combining disaster-mitigation performance evaluation and virtual reality for the improvement of densely built-up areas; Int. J. Soc. Syst. Sci., Spec. Issue: Geoinform. Spat. Plan., 6 (1) (2014), pp. 51–69
- Kato, 2008 T. Kato; Technologies in Urban Regeneration-Community-Based Urban Planning Support System Enhanced by Urban Vulnerability Assessment Technologies; Y. Sadahiro (Ed.), Spatial Data Infrastructure for Urban Regeneration, Library for Sustainable Urban Regeneration, 5, Springer, Tokyo (2008), pp. 103–126
- Kato et al., 2002 T. Kato, et al.; The role and function of planning support system for district improvement plan for earthquake damage mitigation; J. Technol. Des., Archit. Inst. Jpn., 16 (2002), pp. 313–318
- Klosterman, 1995 R.E. Klosterman; The appropriateness of geographic information systems for regional planning in the developing world; Comput., Environ. Urban Syst., 19 (1) (1995), pp. 1–13
- Klosterman, 1997 R.E. Klosterman; Planning support systems: a new perspective on computer-aided planning; J. Plan. Educ. Res., 17 (1997), pp. 45–54
- Klosterman and Pettit, 2005 R.E. Klosterman, C.J. Pettit; An update on planning support systems; Environ. Plan. B: Plan. Des., 32 (4) (2005), pp. 477–484
- Murakami et al., 2001 M. Murakami, et al.; Development of a GIS-based city planning support system for congested areas of wooden houses; J. Archit. Plan., Archit. Inst. Jpn., 547 (2001), pp. 185–192
- Ohgai et al., 2004 A. Ohgai, et al.; Cellular Automata Modeling for Fire Spreading as a Tool to Aid Community-based Planning for Disaster Mitigation; J.P Leeuwen, H. Timmermans (Eds.)Kluwer Academic Publishers, Dordrecht (2004), pp. 193–209
- Ohgai et al., 2007 A. Ohgai, et al.; Cellular automata modeling of fire spread in built-up areas: a tool to aid community-based planning for disaster mitigation; Comput. Environ. Urban Syst., 31 (2007), pp. 441–460
- Pearce, 2003 L. Pearce; Disaster management and community planning, and public participation: how to achieve sustainable hazard mitigation; Nat. Hazards, 28 (2003), pp. 211–228
- Shen and Kawakami, 2010 Z. Shen, M. Kawakami; An online visualization tool for internet-based local townscape design; Comput., Environ. Urban Syst., 34 (2010), pp. 104–116
Document information
Published on 12/05/17
Submitted on 12/05/17
Licence: Other
Share this document
Keywords
claim authorship
Are you one of the authors of this document?
