(Tag: Visual edit) |
(Tag: Visual edit) |
||
| Line 115: | Line 115: | ||
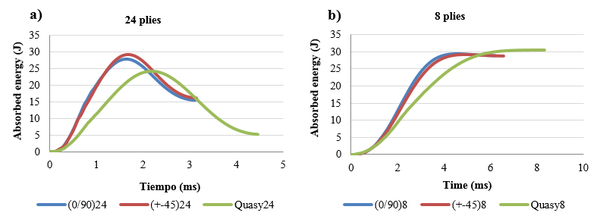
a) The absorbed energy by the laminate coincides with the impact energy which means that all the kinetic energy has been transferred from the impactor to the specimen but without penetration. This behavior can be observed in the curve for the 8-ply laminate in Fig. 3. | a) The absorbed energy by the laminate coincides with the impact energy which means that all the kinetic energy has been transferred from the impactor to the specimen but without penetration. This behavior can be observed in the curve for the 8-ply laminate in Fig. 3. | ||
| − | + | [[File:Captura de pantalla 2022-09-05 195455.png|centre|thumb]] | |
| − | + | ||
| − | + | ||
| − | + | ||
| − | + | ||
| − | + | ||
| − | + | ||
| − | + | ||
<div class="center" style="width: auto; margin-left: auto; margin-right: auto;"> | <div class="center" style="width: auto; margin-left: auto; margin-right: auto;"> | ||
| − | <span style="text-align: center; font-size: 75%;">'''Figure 3.''' Absorbed energy-time diagram [(0/90)n]s (n=2, 3, 6), (30 J)</span></div> | + | <span style="text-align: center; font-size: 75%;">'''Figure 3.''' Absorbed energy-time diagram [(0/90)n]s (n=2, 3, 6), (30 J).</span></div> |
b) If there is no penetration in the material, the energy decreases until it becomes stable. The value of energy at the end of the test corresponds to the permanent absorbed energy through various damage mechanisms as delamination, matrix cracking or fiber breakage [9]. The difference between the impact energy and the absorbed energy is named excessive energy and it is the responsible for the impactor rebound [10]. In other words, the excessive energy produces elastic deformation in the laminate. This is the case for the 16-ply and 24-ply laminates in Fig. 3. | b) If there is no penetration in the material, the energy decreases until it becomes stable. The value of energy at the end of the test corresponds to the permanent absorbed energy through various damage mechanisms as delamination, matrix cracking or fiber breakage [9]. The difference between the impact energy and the absorbed energy is named excessive energy and it is the responsible for the impactor rebound [10]. In other words, the excessive energy produces elastic deformation in the laminate. This is the case for the 16-ply and 24-ply laminates in Fig. 3. | ||
| − | |||
In the case that penetration occurs, the curve of energy performs in a different way. The penetration energy is located at the point where the curve remains almost constant in the force-time diagram but the energy increases with a constant rate as a result of the friction between the impactor and the perforation edges. A typical absorbed energy-time curve with penetration for a [0/90]<sub>2s</sub> laminate is presented in Fig. 4. | In the case that penetration occurs, the curve of energy performs in a different way. The penetration energy is located at the point where the curve remains almost constant in the force-time diagram but the energy increases with a constant rate as a result of the friction between the impactor and the perforation edges. A typical absorbed energy-time curve with penetration for a [0/90]<sub>2s</sub> laminate is presented in Fig. 4. | ||
| − | <div class="center" style="width: auto; margin-left: auto; margin-right: auto;"> | + | <div class="center" style="width: auto; margin-left: auto; margin-right: auto;">[[File:Captura de pantalla 2022-09-05 195553.png|centre|453x453px]]<span style="text-align: center; font-size: 75%;">'''Figure 4.''' Abs. energy-time diagram with perforation [(0/90)2]s (50 J).</span> </div> |
| − | + | ||
| − | + | ||
| − | + | ||
| − | <span style="text-align: center; font-size: 75%;">'''Figure 4.''' Abs. energy-time diagram with perforation [(0/90)2]s (50 J)</span></div> | + | |
Force-displacement diagram. | Force-displacement diagram. | ||
| Line 142: | Line 130: | ||
The force-displacement diagram shows the laminate’s stiffness through the slope of the curve. Thereby a higher rigidity implies a steeper slope and a minor displacement of the material during the test [11]. | The force-displacement diagram shows the laminate’s stiffness through the slope of the curve. Thereby a higher rigidity implies a steeper slope and a minor displacement of the material during the test [11]. | ||
| − | |||
| − | |||
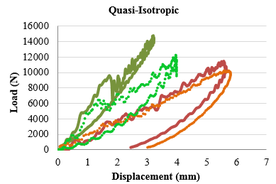
Fig. 5 represents three typical force-displacement curves encountered in an impact event. The first part of the curve is linear and represents the stiffness of the non-damaged laminate. The second part of the curve can perform in two different ways resulting in closed and open type curves, respectively. Open type force-displacement curves have a horizontal section at the end due to damage perforation in the specimens. 8-ply laminate in Fig. 5 shows an open force-displacement curve. In contrast, for specimens having rebounding there is an elastic recovery because the impact energy is unable to cause perforation and both, force and displacement decrease resulting in closed curves in which the enclosed areas represent the absorbed energy [12]. 16-ply and 24-ply laminates in Fig. 5 show closed force-displacement curve. | Fig. 5 represents three typical force-displacement curves encountered in an impact event. The first part of the curve is linear and represents the stiffness of the non-damaged laminate. The second part of the curve can perform in two different ways resulting in closed and open type curves, respectively. Open type force-displacement curves have a horizontal section at the end due to damage perforation in the specimens. 8-ply laminate in Fig. 5 shows an open force-displacement curve. In contrast, for specimens having rebounding there is an elastic recovery because the impact energy is unable to cause perforation and both, force and displacement decrease resulting in closed curves in which the enclosed areas represent the absorbed energy [12]. 16-ply and 24-ply laminates in Fig. 5 show closed force-displacement curve. | ||
Revision as of 19:01, 5 September 2022
1 Introduction
Carbon fiber reinforced polymers are suffering an increased demand in many industrial applications, especially in automation and aeronautics because of the lightness, strength and low conductivity. Nevertheless, one of the principal advantages of using laminated composites materials is the capability to design their stiffness and strength by altering the ply stacking sequence in accordance with particular requirements. Each individual ply presents high dependency between the fiber orientation and its mechanical properties and as a result, anisotropic laminates are fabricated with a superior strength in the fiber direction. These heterogeneous materials present a complex behavior characterized by different failure mechanisms in accordance with the type and intensity of the load but also, the properties of the components, the thickness and stacking sequence play an important role in damage modes.
Composites suffer high or low velocity impact loading during production and service due to hailstones, bird strikes or accidental drop of tools. The energy absorbed during impact is employed in delamination, matrix cracking and breakage of fibers which can lead to the total collapse of the structure if proper design precautions are not taken [1]. In fact, low-speed impacts produce mainly internal damages which are difficult to detect through visual inspection but deteriorate the mechanical properties of the material and reduce its lifetime. Non-destructive evaluation techniques (NDT) applicable to composite structures during fabrication and maintenance provide useful data about the state of barely visible impact damages (BVID) and prevent fatal damage. Ultrasonic phased array based on the phenomena of refraction, reflection and diffraction of waves inside the material, is the preferred technique to detect defects in composite structures.
In the present study, it has been evaluated the impact response of carbon epoxy laminates at low velocity impact. Aeronautical industry is still using conventional ply orientations: 0º, +-45º and 90º angles so, the impact damage resistance of cross ply, angle ply and quasi-isotropic laminates is discussed in this paper.
2 Experimental procedure
2.1 Materials and specimen preparation
The specimens were fabricated from commercially available (Hexcel Composites Ltd) carbon/epoxy pre-impregnated tapes named as M21E/34%/UD268/IMA-12K/300/ATL and used in the primary structure of the Airbus A350 XWB. The M21E is a high performance, very tough epoxy resin suitable for primary aerospace structures on account of its excellent damage tolerance, especially at high energy impacts, see Ref [2]. The reinforcement consists on UD continuous high tensile strength carbon fibers IMA-12K with low weight and excellent corrosive properties. The roll was 300 mm wide and 0.262 mm thick.
The material was laid up by hand in 200 mm wide by 200 mm long plates with different stacking sequences depending on the direction of the fibers: Cross Ply (0º and 90º), Angle Ply (+45º and -45º) andQuasi-isotropic (0º, 90º, +45º and -45º); different thicknesses modifying the number of plies: 2 mm, 4 mm and 6 mm and different sequences of the plies: Sublaminate and Ply Level. A complete list of the laminates selected is presented in Table 1. The value of ‘n’ in Table 1 determines de number of plies, being the thickness of each one 0.25 mm approximately. In this way, n=2 corresponds to an 8-ply laminate for stacking sequences Cross Ply and Angle Ply (2 mm thickness), but 16-ply laminate for Quasi-isotropic (4 mm thickness). Plies with the same direction of the fibers are grouped together in Ply Level sequences. Diverse performances under low-velocity impact considering this huge variety of specimen configurations permits to determine the scaling, stacking and thickness effect in the impact damage resistance.
The basic in-plane stiffness and strength of M21E/IMA unidirectional laminate under tensile and compressive loading provided by the materials manufacturer Hexcel Composite Ltd. [2] are presented in Table 2.
The standard cure cycle recommended by Hexcel Composites Ltd. was used for these laminates. The plates were cured at 7 bar hot-pressing system together with slow heating (1-3 ºC/min), hold at 180 ºC for 120 min and followed by a cooling rate of 2-5 ºC/min. The impact test may be used to screen materials for damage resistance, or to inflict damage into a specimen for subsequent damage tolerance testing. According to the ASTM7136 [3] and ASTM7137 [4] methods, followed for Drop-Weight Impact damage measuring and Compressive Residual Strength testing of Polymer Matrix Composites respectively, the dimensions required for the specimen were 100 mm x 150 mm.
Table 1. Laminates for the impact damage resistance study
| Specimen | Sublaminate | Ply Level | n |
| Cross Ply | [(0/90)n]s | [0n/90n]s | ABBAB |
| Angle Ply | [(+45/-45)n]s | [(+45)n/(-45)n]s | BBAAB |
| Quasi-isotropic | [(0/90/+45/-45) n] s | [(0)n/(90)n/(+45)n/(-45)n]s | AAABB |
Table 2. Stiffness and strength properties for the M21E/IMA carbon fiber/epoxy system provided by the manufacturer Hexcel.
| Specimen | Sublaminate | Ply Level | n |
| Cross Ply | [(0/90)n]s | [0n/90n]s | ABBAB |
| Angle Ply | [(+45/-45)n]s | [(+45)n/(-45)n]s | BBAAB |
| Quasi-isotropic | [(0/90/+45/-45) n] s | [(0)n/(90)n/(+45)n/(-45)n]s | AAABB |
2.2 Drop-weight Impact test
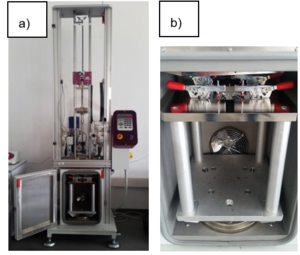
Drop-weight impact tests were performed to study the damage resistance of the different laminates using an instrumented drop-weight testing system, CEAST 9340 with a hemispherical striker tip (∅16 mm), see Fig 1a. The drop-weight column represents real impact situations regarded as common danger in aerospace industry such as accidental bird strikes, hailstorms or falling of a tool during maintenance or fabrication. Modifying the weights and the drop height, different impact energies can be induced into the specimen, causing total penetration or local surface damages. The maximum drop weight available is 37.5 Kg and the energy range is from 0.88 J to 405 J. All the tests followed the ASTM D7136/D7136M standard method for measuring the damage resistance of a fiber-reinforced polymer matrix composite to a drop-weight impact event. Four toggle clamps in the impact support fixture maintain the laminates attached during the test and the impact location is situated in the center of the specimen (Fig. 1b). Some initial tests at different energies were required to select the level of energy which causes enough damage area in every laminate for being detected with ultrasonic inspection but avoiding penetration. Finally, the impacts were performed at two different energies: 20 J and 30 J but with a constant mass (crosshead (2.5 Kg) + 5 Kg + 0.5 Kg). The impactor was dropped at the center of the specimen from a selected height and was captured after the first rebound. The impact velocity and the drop height are connected with the impact energy and they are described in Table 3.
Table 3. Characteristics of the impact test: Velocity and drop height as a function of impact energy.
| Impact energy (J) | Velocity (m/s) | Drop height (m) |
| 20 | 2.15 | 0.236 |
| 30 | 2.64 | 0.354 |
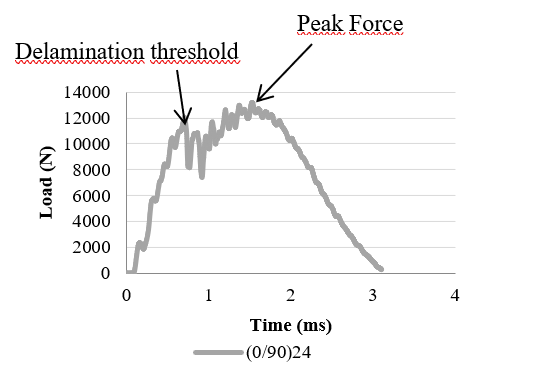
The damage resistance is quantified in terms of the resulting size and type of damage and can be evaluated using the characteristic curves of drop-weight experiments: force-time, force-displacement and absorbed energy-time. The values of the force, energy, time and displacement were recorded during every test with the CEAST DAS 64k acquisition system. The damage response parameters: peak force, absorbed energy and delamination threshold were obtained from the graphics. Peak force refers to the maximum force value registered during the contact between the impactor head and the specimen; the absorbed energy is the amount of energy transferred from the impactor to the laminate at the end of the test and the delamination threshold represents a critical force value which indicates the delamination beginning and corresponds with an abrupt drop in the force-time diagram.
2.2.1 Impact curves interpretation
Force-time diagram.
The contact force is the response of the laminate to the force applied by the impactor [5], see Fig. 2. Contact force histories are registered and represented in the force-time diagram. Several smooth fluctuations in the curve indicate the presence of damage [6] whereas the first abrupt drop in the curve corresponds with the delamination initiation when the stiffness of the laminate falls suddenly because of the impact damage [7]. The maximum force value in the diagram is named peak force and indicates the highest damage caused [8]. After that point, the curve presents a lower slope as a result of a strength decrease.
It should be noted that the delamination threshold ceases to be evident in the curve when the impact energy exceeds certain value and different failure modes occur at the same time in the specimen [7].
Absorbed energy-time diagram.
The absorbed energy can be defined as the value of energy transferred from the impactor to the laminate at the end of the test and corresponds with the last value of energy registered.
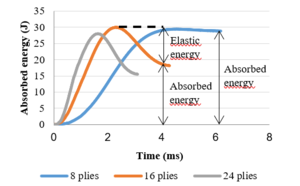
Generally, the impact energy is absorbed in two different ways in a composite material: as elastic deformation and as dissipated energy in form of permanent damage. At the beginning of the test, the energy curve rises until its maximum value which is connected to the impact energy. Once the absorbed energy-time curve reaches the maximum value, two different performances are possible:
a) The absorbed energy by the laminate coincides with the impact energy which means that all the kinetic energy has been transferred from the impactor to the specimen but without penetration. This behavior can be observed in the curve for the 8-ply laminate in Fig. 3.
b) If there is no penetration in the material, the energy decreases until it becomes stable. The value of energy at the end of the test corresponds to the permanent absorbed energy through various damage mechanisms as delamination, matrix cracking or fiber breakage [9]. The difference between the impact energy and the absorbed energy is named excessive energy and it is the responsible for the impactor rebound [10]. In other words, the excessive energy produces elastic deformation in the laminate. This is the case for the 16-ply and 24-ply laminates in Fig. 3.
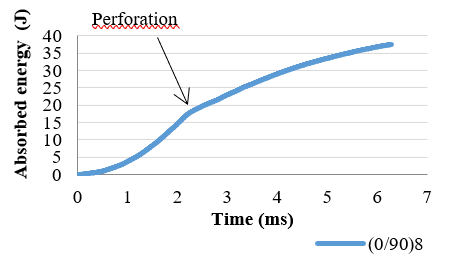
In the case that penetration occurs, the curve of energy performs in a different way. The penetration energy is located at the point where the curve remains almost constant in the force-time diagram but the energy increases with a constant rate as a result of the friction between the impactor and the perforation edges. A typical absorbed energy-time curve with penetration for a [0/90]2s laminate is presented in Fig. 4.
Force-displacement diagram.
The force-displacement diagram shows the laminate’s stiffness through the slope of the curve. Thereby a higher rigidity implies a steeper slope and a minor displacement of the material during the test [11].
Fig. 5 represents three typical force-displacement curves encountered in an impact event. The first part of the curve is linear and represents the stiffness of the non-damaged laminate. The second part of the curve can perform in two different ways resulting in closed and open type curves, respectively. Open type force-displacement curves have a horizontal section at the end due to damage perforation in the specimens. 8-ply laminate in Fig. 5 shows an open force-displacement curve. In contrast, for specimens having rebounding there is an elastic recovery because the impact energy is unable to cause perforation and both, force and displacement decrease resulting in closed curves in which the enclosed areas represent the absorbed energy [12]. 16-ply and 24-ply laminates in Fig. 5 show closed force-displacement curve.
2.3 Ultrasonic Phased Array
The ultrasonic inspection method is based on the capability of the transductor to generate ultrasonic waves inside the inspected material through the vibration of piezoelectric elements. Data acquisition requires optimization as there are some factors which affect significantly the propagation of the ultrasonic waves such as propagation velocity, attenuation and acoustic impedance.
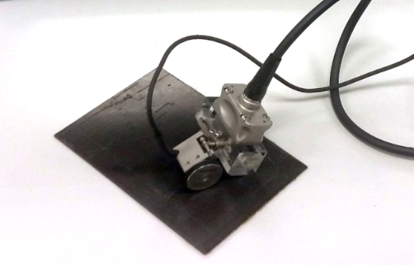
The device used in this work is the Olympus OmniScan MX2 with 64 elements at 5 MHz. The purpose of the ultrasonic inspection is to identify the area affected by the low velocity impact in the material. C-Scan images are the most useful view in this work because provide a two dimensional presentation of data displayed as a top or planar view of the specimen where the damage extension can be represented completely. A mechanical scanner with encoders was used to track the transducer’s coordinates to the desired index resolution as it is shown in Fig. 6.
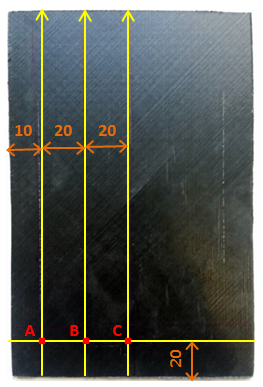
The method selected for the inspection is a raster scan as it is described in Fig. 7. A total of three sweeps have been necessary to obtain a complete view of the damage extension in the plane. A superposed band between sweeps is required to avoid the loss of information about the damage in these zones. The origin has been defined as ‘A’ and it is convenient to maintain a security zone near the edges.
A C-Scan imagen is characterized by a scale where color represents the registered signal amplitude or depth at each point. In this work, each color corresponds to a different depth in which the reflection of the ultrasonic beam occurs. The maximum value in the scale is 6 mm marked by the thickest laminate. Delamination causes the beam reflection due to a discontinuity in the material, but other failure mechanisms are more difficult to detect and require different inspection techniques.
3 Ressults and discussion
Peak force Absorbed energy
3.1 Impact energy and thickness effect
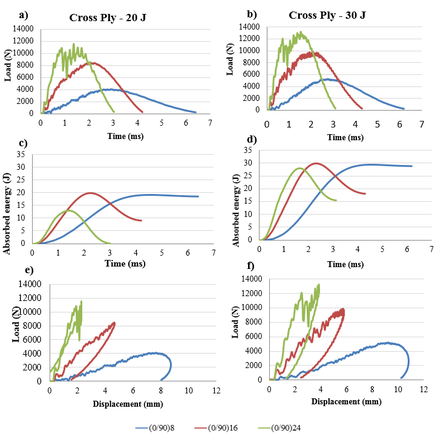
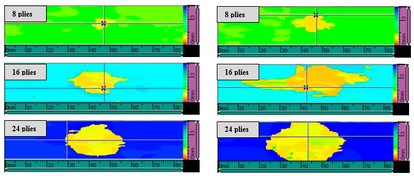
Force and energy diagrams of a Cross Ply configuration after 20 J and 30 J impacts respectively, are presented in Fig 9. Three different thicknesses: 8 plies, 16 plies and 24 plies are considered for each impact energy. The typical impact curves were analyzed and then the corresponding ultrasonic image was used to determine the damage extension (Fig. 10). It is possible to establish a relationship between the impact energy and the damage incurred in the laminate. When the impact energy is 30 J the peak force value is higher due to a greater contact force and this is true for the range of thicknesses evaluated in this study (Fig 9.a). As a result, more severe impacts cause more serious damages. Similarly, it is observed that the absorbed energy increases with the increase in the impact energy what means more energy available to harm the material (Fig 9.d). In the same way, force-displacement diagrams exhibit further displacements and minor elastic rebounding for the 30 J impacts (Fig 9.f) which proves a more damaged state through greater permanent deformations. The same conclusion can be reached from the ultrasonic images (Fig. 10) where the delamination area is bigger at higher impact energies.
Very low levels of impact energy are unable to cause delamination and all the impact energy is absorbed as elastic deformation [13]. In this study, both 20 J and 30 J impacts are energetic enough to create and propagate the damage in the laminate apart from the elastic deformation.
Differences in the curves and damage areas can be observed according to the thickness effect. It was found that peak force and delamination threshold increased when the number of plies increases and this is true for 20 J and 30 J impacts (Fig 9a, 9b). From the energy diagram (Fig 9c, 9d) the best performance corresponded to the 24-plies laminates which absorbed the smallest quantity of energy, however, the 8-plies laminates was near the perforation threshold. Defects were propagated in the direction of the minor energy consumption; thereby delamination spread in a horizontal plane in 24-plies laminates because of its rigidity and only damaged the composite on the surface. In thick laminates shear stresses are more important than bending and cracks appear on the upper surface in contact with the impactor where shear stresses are maximum. However, damage was propagated through-thickness in 8-plies laminates affecting the whole section. Bending deformation dominates in thin composites and matrix cracks appear on the back surface owing to bending and propagate towards the surface shaped like an inverted pine [14]. These results are in concordance with ultrasonic images (Fig 10) where yellow color represents approximately 1 mm in depth for the three thicknesses.
Figure 10. Ultrasonic images of the impact area for a Cross Ply configuration. a), c) and e): 20 J impact; b), d) and f): 30 J impact
3.2 Stacking sequence effect
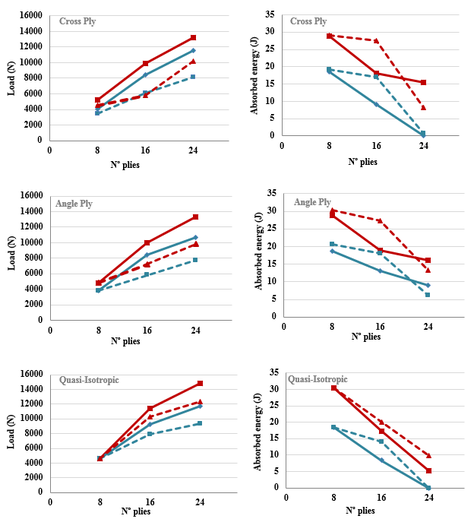
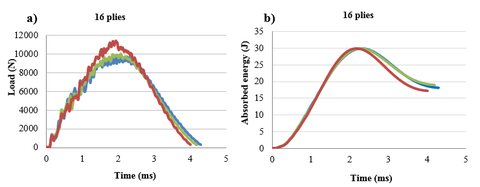
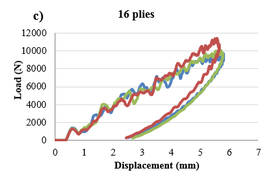
Fig.11 exhibits a comparison between the responses of three plates with the same thickness (16 plies) but different stacking sequences at 30 J impact energy. In the current experiment it was observed that all the curves followed the same trend with a peak force near 1000 N approximately but quasi-isotropic laminate showed a little improvement with an increased peak force (Fig.11a) and a lower permanent deformation (Fig 11c). In the same way, quasi isotropic laminates absorbed less energy at the end of the test (Fig 11b) and, in consequence, more energy is employed in elastic deformation. Although these results indicate that there is no noticeable dependence of the impact damage resistance on the stacking sequence, a slight advantage is given to quasi-isotropic laminate. Unidirectional laminates with all the fibers oriented in the same direction no suffer delamination, but increasing the differences of angle between two adjacent plies, higher delamination areas occur [15]. In that way, cross ply (0/90) and angle ply (+45/-45) laminates present the greatest differences of angle being more susceptible to delamination compared to quasi-isotropic (90/+45; -45/0).
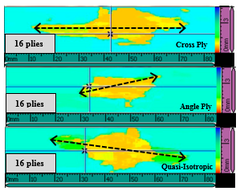
The shapes of the projected delamination areas are presented in Fig 11 resulting from the C-Scan ultrasonic inspection. Delamination grows in different direction depending on the fiber orientation; thereby delamination follows 0º direction in cross ply, 45º in angle ply and 45º in quasi-isotropic. This result is in agreement with the one obtained by Sebaey et al [16].
Fig 12 shows the stacking effect in composites evaluated for a different number of plies. It was found that 24-plies laminates maintain close responses for a cross ply and angle ply sequences but quasi-isotropic differs to a greater extent and more energy is consumed in elastic deformation (Fig 12a). In contrast, absorbed energy curves for 8-plies laminates show no noticeable differences with each other (Fig 12b). This result indicates that although stacking effect could be neglected for thin laminates, cross ply and angle ply sequences present an unfavorable impact response increasing the thickness owing to a higher rigidity which encourages delamination failure and it is especially significant when the angle between fibers is larger.
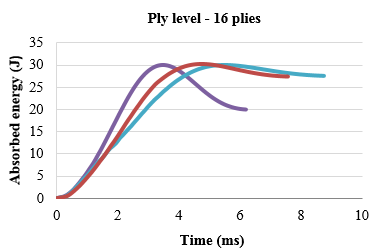
In order to evaluate the stacking sequence effect with ply level laminates, in Fig 13 there are represented the respective energy curves. The same results were obtained, being the quasi-isotropic laminate the once with higher elastic deformation. Comparing the absorbed energy in Fig 11b (sublaminate) and Fig 13, it was found that ply level sequences absorbed more permanent energy to create damage in the material.
3.3 Sublaminate / Ply level sequence
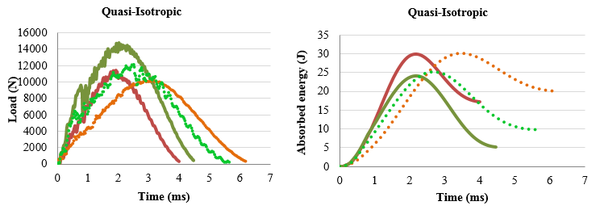
The typical load and energy curves of an impact event (30 J) for quasi-isotropic laminates with two different thicknesses: 16 and 24 plies are presented in Fig. 14. Continuous lines refer to sublaminate composites and dotted lines refer to ply level composites. The former have different fiber orientation in each adjacent laminate while the latter have laminates grouped in blocks with the same fiber orientation. It was observed that sublaminate composites showed a better impact response comparing to ply level which means a higher peak force, less absorbed energy and a minor deformation. It is a result of differences in fiber orientations which provide a barrier effect against defect propagation. On the other hand, blocks behave as unidirectional laminates where cracks can propagate more easily. Delamination only appears in the interface between blocks but once they occur, they spread suddenly.
In Table 4 there is a summary of the numeric results of peak force and absorbed energy obtained from the different impact tests carried out in this work.
| Impact energy: 20 J | Impact energy: 30 J | |||
| Sublaminate | Peak Force (N) | Absorbed energy (J) | Peak Force (N) | Absorbed energy (J) |
| (0/90)8 | 4090,8 | 18,6 | 5237,8 | 28,8 |
| (0/90)16 | 8441,5 | 9,1 | 9885,1 | 18,1 |
| (0/90)24 | 11532,2 | 0,1 | 13232,9 | 15,5 |
| (+45/-45)8 | 3850,6 | 18,6 | 4791,4 | 28,8 |
| (+45/-45)16 | 8407,2 | 13,2 | 10029,2 | 18,9 |
| (+45/-45)24 | 10656,4 | 8,9 | 13348,8 | 16,1 |
| Quasi SL 8 | 4588,1 | 18,3 | 4657,8 | 30,5 |
| Quasi SL 16 | 9303,2 | 8,3 | 11427,7 | 17,2 |
| Quasi SL 24 | 11701,7 | 0 | 14818,3 | 5,1 |
| Ply Level | Peak Force (N) | Absorbed energy (J) | Peak Force (N) | Absorbed energy (J) |
| (0n/90n)8 | 3424,1 | 19,2 | 4489,1 | 29,2 |
| (0n/90n)16 | 6058,1 | 17,1 | 5791,9 | 27,6 |
| (0n/90n)24 | 8181,6 | 0,8 | 10218,3 | 8,1 |
| (+45n/-45n)8 | 3784,1 | 20,5 | 4819,8 | 30,4 |
| (+45n/-45n)16 | 5838,2 | 18,1 | 7238,4 | 27,4 |
| (+45n/-45n)24 | 7788,1 | 6,2 | 9801,7 | 13,3 |
| Quasi PL 8 | 4588,1 | 18,3 | 4657,8 | 30,5 |
| Quasi PL 16 | 7898,1 | 14,1 | 10253,1 | 20,1 |
4 Conclusions
Damage impact resistance of carbon/epoxy pre-impregnated has been studied in this work. Laminates with different thicknesses and stacking sequences were tested in a drop weight column at low velocity impact. The damage response parameters: peak force, absorbed energy and delamination threshold were obtained from the impact curves and C-Scan images from ultrasonic inspection showed the area affected by the low velocity impact in the material. The ultimate purpose in this paper was to analyze how impact energy, thickness and stacking sequence affect to the impact response.
In all the cases, the results showed larger damaged areas and higher values of absorbed energy when the impact energy increases. In addition, absorbed energy caused different damages in the material depending on the thickness: delamination in upper plies was more significant in thicker laminates because of the high rigidity whereas in thinner laminates the damage expanded through the thickness resulting in a lower impact resistance.
Although stacking sequence has an insignificant effect on impact response, quasi-isotropic composites presented a slight improvement as compared with cross ply and angle ply owing to a minor angle variation between adjacent plies (90/+45 and -45/0).
Finally, delamination spread more easily in ply level sequences which behave as unidirectional laminates as a consequence of the blocks of plies with the same fiber orientation. As a result ply level composites provide lower impact resistance than sublaminate.
5 Acknowledgments
This research was supported by the Spanish Ministry of Economy and Competitiveness (National RDI Plan DPI2016-77715-R), and by University of Castilla-La Mancha (Grant no. GI20174014). I. García-Moreno also would like to acknowledge the financial support of the Castilla-La Mancha Government (JCCM) and the European Regional Developmen Fund (ERDF).
6 References
[1] N.S Kavitha and V.Prakash Raghu, Size scale effects on post-impact residual strength of hybrid glass/carbón/epoxy Nano-composites, ScienceDirect, Procedia Materials Science 3 (2014) 2134-2141
[2] Resources H. Prepeg data sheets. hexply m21e epoxy matrix. Product data, <www.hexcel.com>. <www.hexcel.com>.
[3] ASTM D7136 (“Measuring the Damage Resistance of a Fiber-Reinforced Polymer Matrix Composite to a Drop-Weight Impact Event”)
[4] ASTM 7137 (“Standard Test Method for Compressive Residual Strength Properties of Damaged Polymer Matrix Composite Plates”).
[5] C. Atas, O. Sayman, An overall view on impact response of woven fabric composite plates, Composite Structures 82 (2008) 336-345
[6] Lee J, Soutis C, Experimental Investigation on the Behaviour of CFRP Laminated Composites under Impact and Compression After Impact (CAI), EKC2008 Proceedings of the EU-Korea Conference on Science and Technology pp 275- 286, 2008
[7] Shen Zeng, Characterization of Low Velocity Impact Response in Composite Laminates, University of Hertfordshire, 2014
[8] Shyr Tien-Wei, Pan Yu-Hao, Impact resistance and damage characteristics of composite laminates, Composite Structures 62 (2003) 193-203
[9] Liu Dahsin, Raju Basavaraju B, Dang Xinglai, Size effects on impact response of composite laminates, Int. J. Impact Engng Vol. 21, Nº 10, pp. 837-854, 1998
[10] Ullah Khan Shafi, Jang- Kyo Kim, Impact and Delamination Failure of Multiscale Carbon Nanotube-Fiber Reinforced Polymer Composites: A Review, Int’l J. of Aeronautical & Space Sci. 12 (2), 115-133, 2011
[11]Farooq Umar, Myler Peter, Prediction of load threshold of fibre-reinforced laminated composite panels subjected to low velocity drop-weight impact using efficient data filtering techniques, Faculty of Engineering and Advanced Sciences, University of Bolton, BL3 5AB, United Kingdom, 2015
[12] Atas Cesim, Sayman Onur, An overall view on impact response of woven fabric composite plates, Composite Structures 82 (2008) 336-345
[13] Hosur M.V, Murthy C. R. L, Ramamurthy T. S, Shet Anita, Estimation of impact- induced damage in CFRP laminates through ultrasonic imaging, NDT & International, Vol. 31, Nº 5, 1998
[14] Wisnom M. R., The role of delamination in failure of fibre-reinforced composites, Pjil. Trans. R. Soc. A (2012) 370, 1850-1870
[15] Agrawal Sandeep, Singh Kalyan Kumar, Sarkar PK, Journal of composite materials, 2013
[16] Sebaey T. A, González E. V, Lopes C. S, Blanco N, Miamí P, Costa J, Damage resistance and damage tolerance of dispersed CFRP laminates: Effect of ply clustering, Composite Structures 106 (2013) 96-103
Document information
Published on 19/10/17
Accepted on 19/10/17
Submitted on 19/10/17
Volume 01 - Comunicaciones Matcomp17 (2017), Issue Núm. 1 - Comportamiento en Servicio de los Materiales Compuestos, 2017
DOI: 10.23967/r.matcomp.2017.10.007
Licence: Other
Share this document
Keywords
claim authorship
Are you one of the authors of this document?
