(Created page with "==Abstract== By using data of daily electricity consumption and temperature for the period 2003–2007 in Shanghai, the variation of energy consumption and the correlations b...") |
m (Scipediacontent moved page Draft Content 761497789 to Yi-Ling et al 2015a) |
(No difference)
| |
Revision as of 11:20, 15 May 2017
Abstract
By using data of daily electricity consumption and temperature for the period 2003–2007 in Shanghai, the variation of energy consumption and the correlations between energy consumption and temperature are analyzed. The results indicate that winter and summer are the two peak seasons of energy consumption due to the urban residential heating and cooling demand. The base temperature of electricity and daily temperature is 10°C in winter and 22°C in summer respectively. When the outdoor temperature is below 10°C, the heating demand becomes obvious, and with over 22°C the cooling demand. The spatial distribution of cooling degree-days (CDD) and heating degree-days (HDD) clearly shows urbanization effects. By the influence of urbanization the central city experiences greater CDD in summer and lower HDD in winter. The projected temperature for 2011–2050 implies a significant increase in CDD and a decrease in HDD. This may have implications on the future energy demand if the current energy consumption pattern does not change.
Citation
Hou, Y.-L., Mu, H.-Z., Dong, G.-T., et al., 2014. Influences of urban temperature on the electricity consumption of Shanghai. Adv. Clim. Change Res. 5(2), doi: 10.3724/SP.J.1248.2014.074.
Keywords
electricity consumption ; temperature ; heating and cooling period ; Shanghai
1. Introduction
It is generally agreed that climate is one of the key factors influencing the energy consumption (Colombo et al ., 1999 ; Hekkenberg et al ., 2009 ). Amongst various climatic factors, which may affect the energy consumption, temperature is the most dominant one (Yan, 1998 ). Cline (1992) provided the earliest study on the impacts of climate change in his seminal book The Economics of Global Warming. Akbari et al. (1992) reported that the peak cooling electricity load in some U.S. cities would increase by 0.5% to 3% with an ambient temperature increase of 0.6°C. Deschênes and Greenstone (2007) provided the first panel-data based approach for estimating the impacts of climate change on residential electricity demand. Their estimates suggest an increase in residential energy consumption in the range of 30%–35% based on the Hadley 3 A1FI predictions, and about 15% with the CCSM A2 predictions. Chen et al. (2006) reported that the winter heating energy consumption reduced by 5% to 30% in northern China and by more than 30% in the Yangtze delta from 1985 to 2004 due to global warming. The IPCC Fifth Assessment Report (IPCC, 2013 ) assessed that the globally averaged combined land and sea surface temperature as calculated by a linear trend, shows a warming of 0.85 (0.65–1.06)°C. Shanghai, with the influences of the heat island effect and global warming, shows an annual mean temperature of 16.9°C for the period of 1981–2010, with the highest temperature of 40.0°C in the 2010 summer and the lowest temperature of −8.0°C in the 1991 winter.
With the economic development and the improvement of living standards, an increase in electricity consumption is needed. Data from CEIC (CEIC Data Co., Ltd) indicate that the number of air conditioners in Shanghai has increased dramatically in the period 2001–2010. The number of air conditioners per 100 households was 200 in urban and 147 in rural area in 2010, respectively, while the electricity consumption was 134×109 kW h in 2011 (SMSB and SONBSS, 2012 ).
For a better energy management, the government of Shanghai is implementing the 12th Five-Year Plan, which is encouraging clean energy production and CO2 emissions control. Therefore, the investigation of the influence of urban temperature on energy consumption will benefit energy conservation.
In the first part of this study the relationship between temperature and electricity consumption are investigated. Based on this relationship, the base temperatures for cooling and heating demand are derived. In the following sections, relationships between the energy consumption and two climatic indices, namely cooling degree-days (CDD) and heating degree-days (HDD), are used to investigate the correlation with energy consumption in hot and cold months, respectively. With CDD, the climate influence on the cooling energy consumption is assessed and with HDD the heating requirement is estimated. Finally, by applying the future projection of temperature data, the trend in CDD and HDD for 2011–2050 are predicted.
2. Data and methods
Shanghai municipality, with an area of around 6,340 km2 and a population of over 23.8 million, is located in the center of the eastern coastline of China. Since the 1980s, Shanghai has experienced a rapid urbanization. Until 2012, the built-up area has covered 1,563 km2 .
2.1. Data
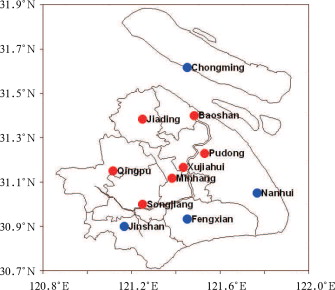
In this study, the daily and monthly mean temperature data for 1981–2010 were obtained from the Shanghai Climate Center. The Xujiahui observatory has the longest instrument records in China since 1873. Since 1950, another ten meteorological observation stations have been established in urban and rural Shanghai (Fig. 1 ). With the rapid urbanization, some rural stations are now located in the urban area, such as Xujiahui, Minhang and Baoshan stations. This network provides daily, hourly and even more detailed meteorological observations. Table 1 shows the station’s start year, the correlation coefficient of annual mean temperature at each station with that of Xujiahui station, as well as the standard deviation during 1981–2010. The spatial consistency of temperature is analyzed by calculating the correlation coefficient between Xujiahui’s annual mean temperature and the other stations. All correlation coefficients in Table 1 are statistical significant at 0.01, which means that all stations change consistently with each other. Stations in the central city have a larger variance than those in the suburbs, reflecting the typical urbanized characteristics of the air temperature in Shanghai.
|
|
|
Figure 1. Study area and locations of the meteorological stations (red: urban station; blue: rural station) |
| Element | Xujiahui | Minhang | Baoshan | Jiading | Chongming | Nanhui | Pudong | Jinshan | Qingpu | Songjiang | Fengxian |
|---|---|---|---|---|---|---|---|---|---|---|---|
| Start year | 1873 | 1959 | 1959 | 1959 | 1959 | 1956 | 1960 | 1959 | 1959 | 1959 | 1954 |
| Correlation coefficient | 1 | 0.98 | 0.99 | 0.99 | 0.97 | 0.97 | 0.98 | 0.97 | 0.99 | 0.98 | 0.95 |
| Standard deviation | 0.87 | 0.97 | 0.81 | 0.83 | 0.70 | 0.65 | 0.83 | 0.69 | 0.76 | 0.89 | 0.56 |
A high-resolution temperature projection (25 km) was derived by using a regional climate model (RegCM3), which was driven by a global model (CCSR/NIES/FRCGCMIROC3.2_hires) under the A1B scenario. The projection data cover the period of 2011–2050.
A time series of daily electricity consumption E (in 106 kW h), spanning the period 2003–2007, has been used. This data comprises the electricity consumption in all economic sectors for Shanghai and was derived from the State grid Shanghai municipal electricity power company.
2.2. Methods
Monthly CDD and HDD are calculated based on the following formula:
|
|
Where M is the number of days in a month, Ti is the daily mean temperature of day i and Tbase is the base temperature which will be determined later.
A piecewise linear fitting method is used to detect the breakpoint of the temperature series (Tomé and Miranda, 2004 ). This methodology uses a least-squares approach to compute the best continuous set of straight lines that fit a given time series, subject to a number of constraints on the minimum distance between breakpoints and on the minimum trend change at each breakpoint. In this paper, the breakpoint will be regard as the base temperature.
3. Results
3.1. Relationship between temperature and electricity consumption
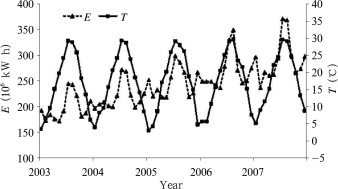
During 2003–2007, the monthly mean temperature of Shanghai has a significant seasonal cycle (Fig. 2 ), with the highest in August 2006 (29.7°C), and the lowest in January 2005 (3.1°C).
|
|
|
Figure 2. Variation of monthly electricity consumption (E) and monthly mean temperature (T ) in Shanghai from 2003 to 2007 |
From 2003 to 2007, the electricity consumption experienced a regular seasonal change similar to the temperature. In summer, there is a peak in electricity use due to high cooling demand. Further, a relatively lower peak in electricity use is found in winter mainly because of the growth in heating demand. The sub-peak of consumption in winter coincides with the minimum temperature; spring and autumn are transition seasons with a relative low consumption level; in summer, the cooling demand increases together with the temperature. This cycle repeats year by year. The monthly peak in electricity consumption in summer is much higher than that in winter. This dramatic increase in monthly electricity use might be caused by the growing economic development.
The variation in daily electricity use shows also a weekly cycle with minimum on the weekend and maximum on the central working days (Figures are not shown). The data is divided into two different subsamples which separate the working days from the weekends. The relationship is nonlinear, and the weekend data show a better correlation with temperature than the working day data.
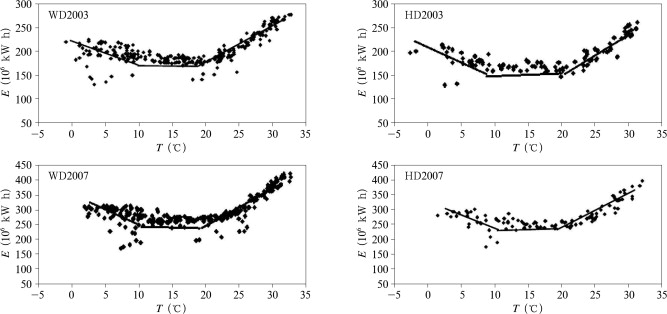
The piecewise linear fitting method is used here to test the breakpoints of the electricity consumption. The features are very similar and thus only results of the beginning (2003) and ending (2007) years are presented in Figure 3 . Based on the findings, the electricity consumption goes up dramatically when the temperature is above 20°C or below 10°C. Hence, the sensitive temperature for cooling is 20°C and the sensitive temperature for heating is 10°C.
|
|
|
Figure 3. Daily electricity consumption against daily temperature on working days (WD) and weekends (HD) in Shanghai in 2003 and 2007 |
3.2. Observed trends in HDD and CDD
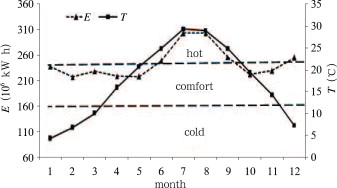
Figure 4 shows the 5-year mean (2003–2007) monthly temperature and electricity consumption. According to the results of section 3.1 , the variation in electricity consumption is not sensitive to temperature when the mean temperature ranges between 10°C and 20°C. Based on this, the months from June to September are regarded as the hot months in which cooling would be required to achieve thermal comfort in Shanghai, while December to February are defined as cold months when heating might be required. Combined with the local climate of Shanghai and the design standard for energy efficiency of residential buildings in hot summers and cold winters (CABR, 2001 ), a base temperature of 10°C is defined for heating and 22°C for cooling.
|
|
|
Figure 4. Monthly electricity consumption and temperature and related base temperature zones (2003–2007 mean) |
Variations in the annual CDD and HDD during 1981–2010 are shown in Figure 5 . Here, only the cold months and the hot months have been calculated to represent a whole year’s HDD and CDD. An increasing trend (8.0°C d per year) in CDD and a decreasing trend (–6.1°C d per year) in HDD are observed. For CDD, the trend is in line with the increasing trend in mean temperature in Shanghai, which can be linked to the combined effect of global warming and local urbanization. The heating requirement is a little bit lower than the cooling requirement. For example, the average annual HDD is 424°C d, while CDD is around 500°C d.
|
|
|
Figure 5. Time series of CDD (a) and HDD (b) in Shanghai during 1981–2010 |
3.3. Spatial distribution of CDD and HDD
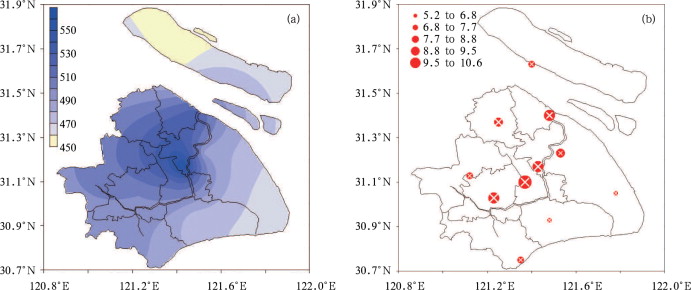
Figure 6 a shows the spatial distribution of the annual CDD for the base temperature of 22°C. The urbanization effects in Shanghai are remarkable. For areas near the coast, the CDD are lower compared to those in the western and central regions. The greater CDDs are observed in the central city, where a heat island effect usually dominates in summer. The CDD in the urban area increased at a rate of 9.5°C d per year in 1981–2010 (Fig. 6 b).
|
|
|
Figure 6. Spatial distribution of annual CDD for a base temperature of 22°C (a, in °C d), and the linear trends (b, in °C d per year, cross denotes the significance at the 0.05 confidence level) during 1981–2010 |
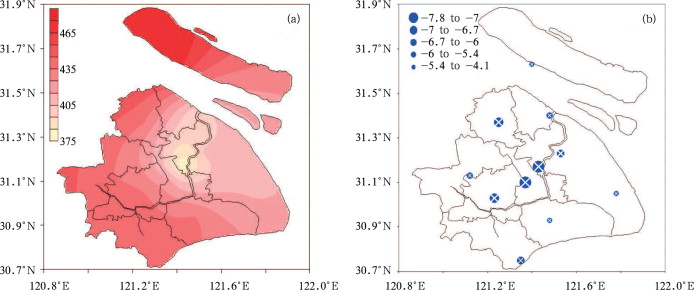
Figure 7 a shows the spatial distribution of annual HDD at the base temperature of 10°C. Different from CDD, the lower values of HDD occur at the central city area and Pudong. This is because by the influence of the urban heat island effect, these regions are relatively warmer in winter. The maximum value of HDD is at Chongming station. In term of the linear trends, Shanghai’s HDD decreased significantly in 1981–2010 (Fig. 7 b). In the central city a decreasing rate of –7.1°C d per year is observed.
|
|
|
Figure 7. Spatial distribution of annual HDD for a base temperature of 10°C (a, in °C d), and the linear trends (b, in °C d per year, cross denotes the significance at the 0.05 confidence level) during 1981–2010 |
3.4. Correlation analysis
In order to explore the dependence of electricity consumption per capita on CDD, a correlation analysis was carried out. During warm months, a positive correlation (0.58) between monthly CDD and monthly electricity consumption is observed. The results show that for an increase of CDD by 1°C d, about 402×103 kW h electricity was consumed. No significant correlation was found between monthly HDD and electricity consumption.
3.5. Projected trends
For the period of 2011–2050, the annual CDD and HDD of Shanghai are generated by calculating the average values of the grid points within the area of Shanghai. The variations in the annual CDD and HDD during 2011–2050 are shown in Figure 8 . In warm months, the CDD would increase at a rate of 6.9°C d per year, while the HDD would decrease at a rate of 2.1°C d per year in cold months.
|
|
|
Figure 8. Projected CDD (a) and HDD (b) for Shanghai from 2011 to 2050 |
4. Conclusions
In this paper, the relationship between electricity consumption and daily mean temperature in Shanghai was analyzed through the definition of the base temperature of CDD and HDD in warm months and cold months. Electricity demand shows significant seasonal variations.
First, the seasonal variations of electricity demand and temperature are compared. In summer, a high peak exists in electricity consumption due to great cooling demand. The relatively lower peak in electricity use is found in winter, mainly due to the growth in heating demand. It is observed that the base temperatures of electricity consumption are 22°C in summer and below 10°C in winter respectively.
Second, the spatial distribution of CDD and HDD clearly shows the urbanization effects. By the influence of urbanization, the central city area experiences greater CDD in summer and lower HDD in winter. These results could be useful in the decision making of the electricity demand.
Finally, the projected mean temperature for 2011–2050 implies a significant increase in CDD and a decrease in HDD. This may have implications on the future energy demand if the current energy consumption pattern does not change.
Acknowledgements
This work was supported by the National Natural Science Fundation of China (No. NSFC70933005), CAS Pilot Special Project (No. XDA05090204), China Clean Development Mechanism Fund (No. 1212117). Thanks go to Prof. GAO Xue-Jie providing the projection data. Special thanks go to Prof. XU Jia-Liang for offering numerous suggestions for improvement.
References
- Akbari, 1992 H.S. Akbari; Cooling our communities: A guidebook on tree planting and light color surfacing, Lawrence Berkeley National Laboratory (1992) Accessed http://escholarship.org/uc/item/98z8p10x
- CABR (China Academy of Building Research), 2001 CABR (China Academy of Building Research); Design standard for energy efficiency of residential buildings in hot summer and cold winter zone (in Chinese) (2001)
- Chen et al., 2006 L. Chen, X.-M. Fang, X.-Q. Fang, et al.; Impacts of climate warming on heating climatic conditions and energy requirements over China in the past 20 years; Journal of Natural Resources (in Chinese) (7) (2006), pp. 590–597
- Cline, 1992 W.R. Cline; The Economics of Global Warming; Institute for International Economics, Washington (1992)
- Colombo et al., 1999 A.F. Colombo, D. Etkin, B.W. Karney; Climate variability and the frequency of extreme temperature events for nine sites across Canada: Implications for power usage; J. Climate, 12 (8) (1999), pp. 2490–2502
- Deschênes and Greenstone, 2007 O. Deschênes, M. Greenstone; Climate Change, Mortality and Adaptation: Evidence from Annual Fluctuations in Weather in the U.S. MIT; Department of Economics Working Paper No. 07-19 (2007)
- Hekkenberg et al., 2009 M. Hekkenberg, R.M.J. Benders, H.C. Moll, et al.; Indications for a changing electricity demand pattern: The temperature dependence of the electricity demand in the Netherlands; Energy Policy, 37 (4) (2009), pp. 1542–1551
- IPCC, 2013 IPCC; Climate Change 2013: The Physical Science Basis Summary for Policymakers; Working Group I Contribution to the IPCC Fifth Assessment Report (2013) SPM-3
- SMSB (Shanghai Municipal Statistics Bureau) and SONBSS (Survey Office of the National Bureau of Statistics in Shanghai), 2012 SMSB (Shanghai Municipal Statistics Bureau), SONBSS (Survey Office of the National Bureau of Statistics in Shanghai); Shanghai statistical yearbook (2012) Accessed http://www.statssh.gov.cn/tjnj/nj12.htm?d1=2012tjnj/C0501.htm
- Tomé and Miranda, 2004 A.R. Tomé, P.M.A. Miranda; Piecewise linear fitting and trend changing points of climate parameters; Geophysics. Res. Lett, 31 (2) (2004), pp. 78–82
- Yan, 1998 Y.-Y. Yan; Climate and residential electricity consumption in Hong Kong; Energy, 23 (1998), pp. 17–20
Document information
Published on 15/05/17
Submitted on 15/05/17
Licence: Other
Share this document
Keywords
claim authorship
Are you one of the authors of this document?
