(Created page with " ==Abstract== The presented work addresses the topic of energy savings in existing public buildings, when no significant retrofits on building envelope or plants can be done...") |
(No difference)
|
Revision as of 10:42, 12 May 2017
Abstract
The presented work addresses the topic of energy savings in existing public buildings, when no significant retrofits on building envelope or plants can be done and savings can be achieved by designing intelligent ICT-based service to monitor and control environmental conditions, energy loads and plants operation. At the end of 2010 the European Commission, within the Seventh Framework Program, has founded a project entitled “Smart Energy Efficient Middleware for Public Spaces” (SEEMPubS). To achieve this goal the project will implement, in a set of demonstrator buildings, an interoperable web-based software and hardware solution for real-time monitoring and control of lighting, heating, ventilation and air conditioning services, through both wired and wireless sensor networks. In this paper the first phase of the project, concerning the selection of the environments to be used as demonstrator and the definition of the control and monitoring strategies to reduce energy consumptions for lighting and air conditioning, are presented.
Abbreviations
ICT , information and communication technologies ; HVAC , heating, ventilating and air conditioning
Keywords
Energy efficiency ; Existing public buildings ; Control strategies ; Dynamic simulations
1. Introduction
One of the major challenges in todays society concerns the reduction in energy use and CO2 footprint in existing public buildings without significant construction works. In this context, key challenges are concerned with the design and the development of a monitoring and control infrastructure to manage appliances so as to effortlessly optimize energy efficiency usage (without compromising comfort for occupants) and to offer to decision makers dedicated tools to plan and manage energy saving strategies. Within this frame, at the end of 2010 a project entitled “Smart Energy Efficient Middleware for Public Spaces” (SEEMPubS) was funded by the European Commission (SEEMPubS official website) . The project specifically addresses reduction in energy usage and CO2 footprint in existing public buildings and spaces by implementing an intelligent ICT-based building monitoring and managing system. Actions of retrofitting on building envelopes or services to reduce energy consumptions are not always possible or economically convenient in existing buildings and in particular in historical buildings where conservation is a matter of priority. In SEEMPubS a system to monitor and control buildings services and appliances will be designed and implemented with the aim of optimizing energy usage without compromising occupants comfort and offering decision makers strategies and tools needed to plan energy saving measures.
The proposed system will make use of “LinkSmart”, which is a service-oriented middleware developed in a previous European project (Jahn et al ., 2009 ; Lardies et al ., 2009 ) and designed to support the development of networks of embedded systems, simplifying the interconnection of heterogeneous devices that communicate using different protocols. The project will use the LinkSmart middleware potential to create services and applications across heterogeneous devices to develop an energy-aware platform.
The SEEMPubS platform will provide functions and tools to add energy efficiency features to the Building Management System (BMS), by monitoring environmental and energy data in real time, and by controlling the operation of active systems like lighting and HVAC services, taking advantage of natural resources (daylight and solar energy) to ensure the best possible comfort conditions with the most efficient use of energy.
A real-time energy-awareness service for all users of the Public Spaces will be also created and it will combine awareness services with a community portal to actively involve people in energy saving issues.
The functionality of the designed platform will be demonstrated in existing buildings at the Politecnico di Torino Campuses (Italy). Buildings built in different periods, from historical to contemporary constructions, were chosen as pilot study, to take into account potentials and drawbacks resulting from the use of smart ICT based systems in buildings with different features and constraints.
In the paper the activity carried out during the first year of the project to define the new BMS architecture and in particular the control strategies proposed for implementation in the existing buildings is presented. Furthermore a special focus is set on the procedure adopted to evaluate the effectiveness of the proposed control strategies: dynamic simulations have been carried out to assess the saving potentials with respect to the energy performance goals.
2. Control strategies and control logics
The activity carried out during the first year of the project was mainly focused at preparing the groundwork for the development, implementation and validation of the BMS in the Politecnico buildings. To demonstrate the effectiveness of the new system in reducing energy consumption, increasing occupants comfort and simplifying facility managers activities, some rooms, from each Campus site, were selected as case studies (Virgone et al., 2010 ). Rooms were chosen on the basis of the following criteria:
- representativeness with respect to Politecnico Campus and other Public Buildings,
- energy saving potentials,
- characteristics of the existing services.
Both private and public spaces in historical and modern buildings were selected, in particular classrooms, student offices, single offices and open plan offices were chosen as demonstrator. Energy saving potentials related to the control of HVAC services, lighting plants and other electrical appliances, were supposed according to the rooms architectural and plants features (volume, orientation, type of envelope, type of heating and lighting plant, shading system, etc.), the type of activity carried out, the occupancy patterns and the solar/daylight availability.
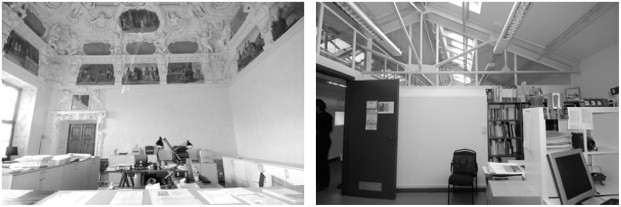
In Figure 1 some images of the rooms that will be used for the study are presented.
|
|
|
Figure 1. Internal view of some rooms that were selected for the study in the historical Politecnico di Torino Campus (Valentino Castle). |
Six pairs of rooms were selected for the study. Each test room has a reference room—a room with similar architectural characteristics, building services, type of activity, etc. The six reference rooms will run with the already present systems and with manual controls, whereas the six similar test rooms, will be equipped with the new BMS for lighting, heating/cooling and electrical appliances control and monitoring. The monitoring of the energy consumptions in each couple of room will provide information on the savings achievable with the designed control system.
Further analyses on the selected rooms were carried on to determine the future control strategies: indoor and outdoor microclimatic and lighting conditions were monitored during different periods of the year and an overall energy auditing was carried out to determine the present energy performance of the Politecnico buildings (Virgone et al., 2011 ).
2.1. Lighting control strategies
To define the most appropriate lighting control strategies, a general overview of the state of the art on lighting control was first carried out (Destefanis et al ., 2011 ; Dubois and Blomsterberg, 2011 ; Doulos et al ., 2008 ; Guo et al ., 2010 ; Ryckaert et al ., 2010 ; Tiller et al ., 2010 ). The most recurrent solutions for energy savings are:
- time switching,
- daylight harvesting,
- occupancy control,
- a combination of the previous.
Time switching is the strategy that entails to turn automatically on and off luminaires at scheduled times to avoid useless lighting out of working hours. This is the simplest and more spread solution in public and commercial buildings.
Daylight harvesting is the control strategy that entails to automatically adjust luminaires light flux (dimming) in order to maintain a predetermined illuminance in the room, taking into account the contribution of daylight. The aim of this lighting control strategy is to ensure adequate lighting condition throughout the working hours and to save energy by means of reducing the lighting power as a function of daylighting supply. This strategy is especially effective in those rooms or buildings that are characterised by high daylight availability and all-day working hours.
Occupancy control will turn luminaires on and off when the presence or absence of people is detected in a space. Also in this case the automatic control avoids energy waste produced by the possibility that users leave the spaces forgetting the lights on. The control logic could provide for either switching on and off or for single off, leaving the user, in this second case, the possibility to turn on the light when desired. A lighting control based only on presence detection will be effective in those spaces where user absence is highly probable, and in particular in public or commercial buildings, where users are little motivated at caring about the use of light.
2.1.1. Proposed control logics
According to the information on the rooms features achieved during the first phase of the project, some lighting control logics were initially proposed (Pellegrino et al., 2011 ). In particular, for spaces with high daylight availability and medium/high users absence probability, a combination of daylight harvesting and occupancy control was proposed. For spaces with low daylight availability, a lighting control based on occupancy sensing was proposed, while a particular solution was planned for large classrooms with no daylight: students absence probability during the day is very low, but the classroom area could be only partially occupied when a small number of students attend the lectures. In this case it was supposed to use several occupancy sensors to dim to a minimum the light corresponding to the unoccupied parts of the classroom. In all cases the possibility to override the automatic control via manual command is considered.
Based on these assumptions, some recurrent combinations of lighting control strategies were initially proposed for the selected rooms:
- Time switching and manual control: this mix of control strategies was proposed for the Student Offices where daylight availability is very low and the general lighting is provided by means of High Pressure Metal Halide lamps, which cannot be switched on and off instantaneously and cannot be dimmed.
- Daylight harvesting, occupancy detection and manual control: this combination of control strategies was proposed for the private offices (DIST offices, Administrative offices and DAUIN offices). In these cases the automatic dimming of lights based on a daylight harvesting control strategy could be applied successfully thanks to the high daylight availability and it could be useful to control lights on the basis of rooms occupancy too, as a medium absence probability could be truthfully assumed for these offices
- Occupancy detection and manual control: these control strategies were proposed for the classrooms and for the open-plan offices, as daylight is not allowed to enter the rooms (in classrooms) or is quite low due to the glazing characteristics and the external obstructions produced by the structure of the double façade in the open-plan offices.
- Shading device control based on outdoor illuminance or solar radiation: this control strategy was proposed for the offices with motorized blinds on the roof lights to control overheating and glare from solar radiation.
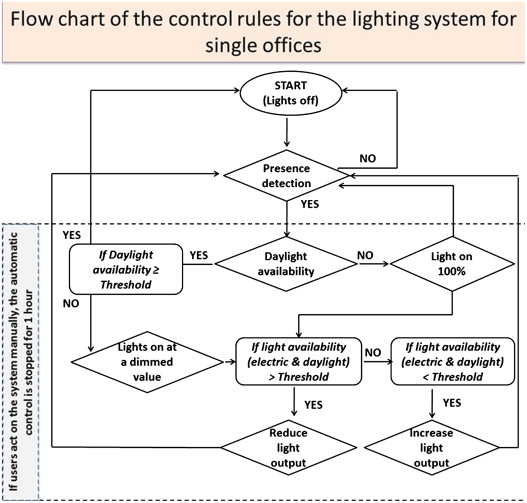
In the following diagrams the lighting control logics proposed for the selected case studies are presented. Figure 2 describes the control logics corresponding to a strategy of both daylight harvesting and occupancy control. The lights will be switched on and off when user presence or absence is detected by the occupancy sensor and will be dimmed up or down to integrate daylighting in order to achieve the required lighting conditions for visual comfort.
|
|
|
Figure 2. Control logic in case of both daylight harvesting and occupancy control. |
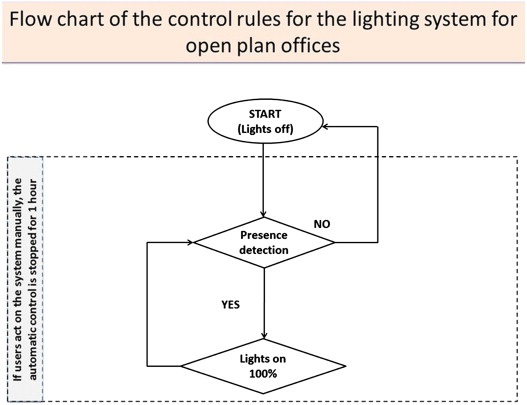
Likewise, Figure 3 shows the control logics for controlling lighting as a consequence of users presence. In these cases the lights will be switched on and off when user presence or absence is detected by the occupancy sensors.
|
|
|
Figure 3. Control logic in case of occupancy control in open plan offices. |
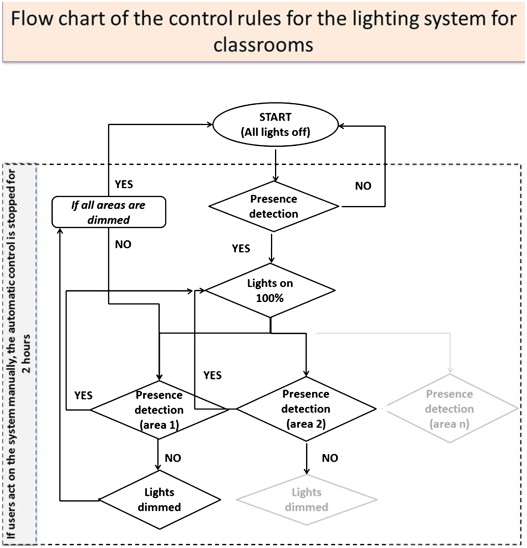
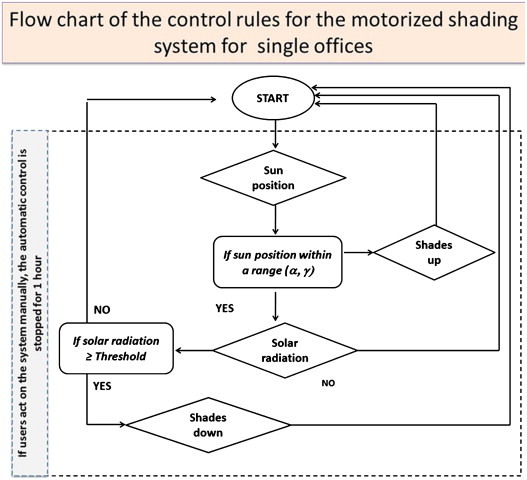
Figure 4 describes the lighting control logics designed for big classrooms with no daylight, and Figure 5 shows the logics for those rooms where, together with the electric lighting, shading devices can be automatically controlled on the bases of the sun position and the solar radiation measured on the building roof.
|
|
|
Figure 4. Control logic in case of occupancy control in classrooms. |
|
|
|
Figure 5. Control logics in case of shading devices. |
2.2. HVAC control strategy
2.2.1. Methodology of work
The goal of the SEEMPubS project is to decrease the energy consumption of buildings while ensuring the comfort of the users. We have to take into account two different factors: 1—the type of heating system used in the selected rooms; 2—the intermittent use of the building.
The economic advantage of intermittent use of heating systems in intermittently-occupied buildings (e.g. schools, office buildings) is no longer in doubt. Nevertheless, optimal energy consumption requires that the heating restart time be defined with great precision. In many cases, to avoid risks, the lowering of the temperature during non-occupancy period is limited, which leads to reductions in energy savings.
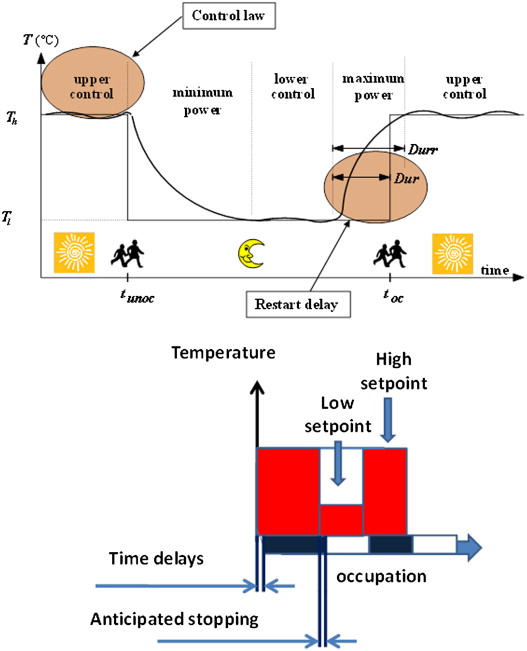
An intermittent heating controller allows the internal temperature to be lowered during non-occupancy periods, while maintaining the desired temperature during occupancy periods, when these periods are clearly defined (Fraisse et al ., 1997a ; Fraisse et al ., 1997b ; Fraisse et al ., 1999 ). The different phases of heating are as follows and are illustrated in Figure 5 :
- Upper control during occupancy period. The internal air temperature Ta must be maintained at the high set-point temperature Th by means of the heating law.
- Minimum power: switching-off of heating at the end of the occupancy period.
- Lower control during the non-occupancy period if the internal temperature reaches the low set-point temperature Tl . The low set-point temperature avoids the risk of condensation or frost.
- Recovery at maximum power, so as to reach the high set-point temperature Th from the beginning of the following occupancy period scheduled. Restart time is optimized by the controller.
- Further possibility to integrate in the process: anticipated stopping of heating with an optimized time delay before the end of occupation period scheduled.
In our case, we want to go further by having a detection of the occupancy. A schedule is always defined allowing turning off the heating when the room is unoccupied, unless a presence is detected. Nevertheless, the user can always act on the system by changing the set point temperature of the fan coils with individual switcher. In fact, lot of classrooms or offices are not used during all the time of the scheduled period. If no presence is detected, the heating is stopped after a little delay.
Furthermore, since access to all the information is simultaneously available, strategies of interoperability may be found allowing for example, the anticipation of the heating stop if the other loads (solar or internal) are enough (Figure 6) .
|
|
|
Figure 6. Intermittency of heating strategy illustration. |
2.2.2. Heating control strategy
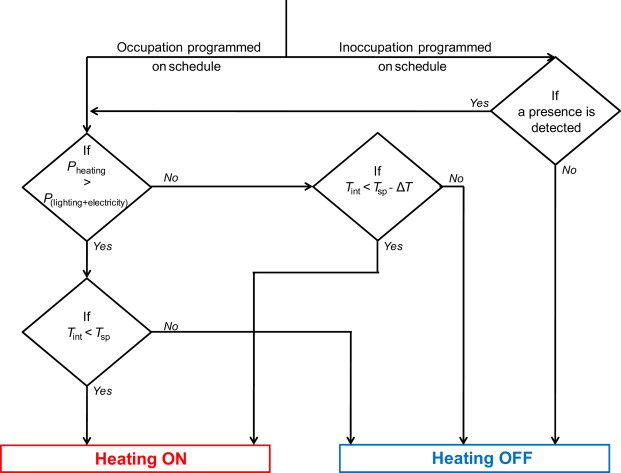
The control strategy proposed is based on a communication between all sub-systems (heating/cooling, lighting, other electricity used). The algorithm logic for heating is presented in Figure 7 :
- The strategy supposes that every room possesses its own panel of circuit breaker: a circuit breaker for heating (in the case of fan coils it is on the ventilator that we act), one for lighting and one for electricity plugs.
- A minimum indoor temperature should be defined which the heating has to restart.
|
|
|
Figure 7. Algorithm for heating strategy. |
Two practical examples of communication between sub-systems are described hereafter:
- The heating schedule is on “unoccupied”, but someone enters the office for work. If necessary, lights will be switched on thanks to the presence detector, which will also switch on the heating system for the comfort of the person using the office.
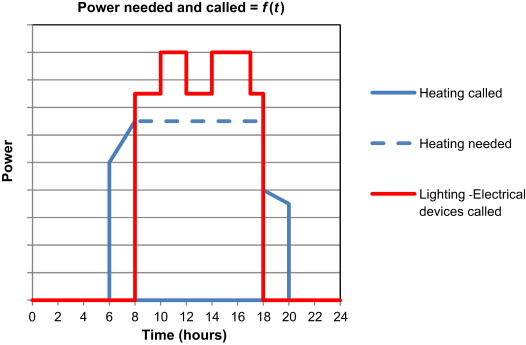
- Another example is to anticipate the heating system switch off when heat gains from lighting and electrical devices (computers, etc.) exceed the heating power needs. A normal feedback control would let the indoor temperature increase above the set-point before stopping the heating systems, with an unnecessary waste of energy. The graphic in Figure 8 explains this point.
|
|
|
Figure 8. Example of interoperability between the electrical loads and the heating system. |
2.2.3. Theoretical application
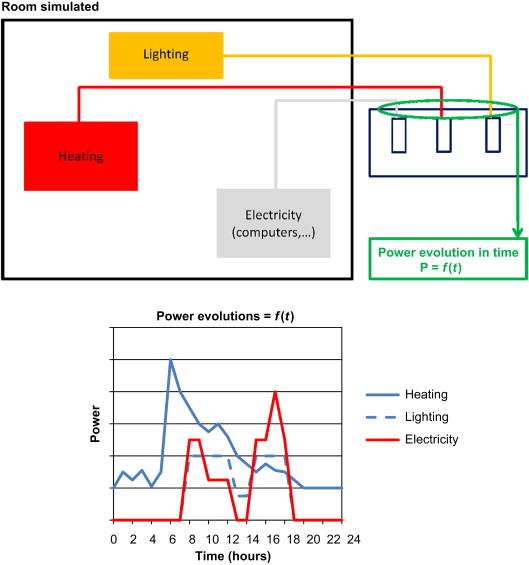
Figure 9 explains the adoption of this strategy on a room.
|
|
|
Figure 9. Evaluation, during time, of the different powers. |
3. Numerical simulations
The potential in saving energy of the proposed control solutions has been assessed by means of building performance simulations. The procedure adopted was as follow:
- analysis of available software and selection of the most appropriate with respect to the simulation goal;
- monitoring of environmental condition in the selected rooms (illuminance, air temperature, relative humidity);
- models construction and simulation of environmental conditions;
- comparison between monitored data and simulation results;
- further setup of rooms model;
- simulation of rooms performance in terms of energy consumption and environmental conditions when applying the new control strategies.
3.1. Lighting simulations
3.1.1. Methodology
To assess the effectiveness of the proposed lighting control solutions, for each analysed room, the savings from future control strategy respect to the present one has been calculated from total annual electric lighting energy consumptions.
In general, the total annual energy used for lighting depends on different aspects, mainly related to: building usage in terms of target illuminance and occupancy profile, user behaviour, lighting plant characteristics, lighting control system and indoor daylight availability. Therefore, to calculate the energy consumption for those rooms where daylight is allowed to enter a dynamic Climate-Based Daylight Modelling (CBDM) approach (Reinhart et al ., 2006 ; Mardaljevic, 2000 ; Mardaljevic et al ., 2009 ) was used to estimate annual daylight availability and, as a consequence, to calculate the electric energy consumption as a function of the type of lighting control system adopted.
Climate-based daylight modelling allows the prediction of various lighting quantities using sun and sky conditions that are derived from standard meteorological datasets. At present there is quite few software that allows a climate-based daylight simulation. Among them Radiance and Daysim are the most well-known and used in the lighting field.
Daysim calculates the annual daylight availability in arbitrary buildings based on the Radiance backward ray tracer, using external daylighting conditions derived from standard meteorological local datasets. It includes specific occupant behaviour model algorithms to mimic occupant use of personal controls such as light switches and venetian blinds and to predict the electric lighting use due to automated lighting controls such as occupancy sensors and photocell controlled dimming systems. In addition to daylighting metrics, among its outputs, the total annual energy used for lighting [kW h] and the LENI value [kW h/m2 year] are included (EN 15193, 2007).
For the SEEMPUBS project both Radiance (Larson and Shakespeare, 1998 ) and Daysim (Reinhart, 2001 ) were used. The first one to validate the models, the second one to estimate the lighting energy use and the savings obtained with the proposed control solutions.
3.1.2. Model validation
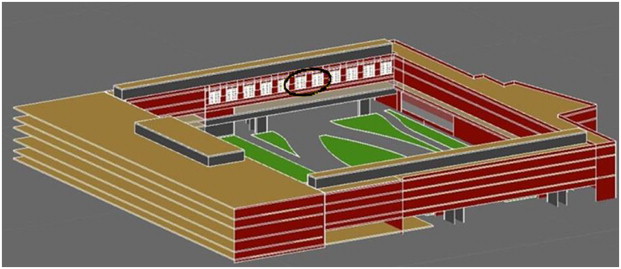
To start the lighting simulation with Radiance or Daysim a 3D model of the selected rooms and their external environment were prepared (Figure 10 ). The rooms' models were prepared using the parametric software Revit and then imported in Radiance and Daysim through the software Ecotect.
|
|
|
Figure 10. 3D model of the building around the simulated rooms. |
To correctly characterise the models opaque and transparent surfaces, in field measurements of luminous reflectances and transmittances were carried out. The models' validation was done comparing the output of the Radiance simulations with the quantities measured inside the rooms, with same sun position and sky condition (Mardaljevic, 1995 ; Reinhart and Herkel, 2000 ; Reinhart and Walkenhorst, 2001 ; Reinhart and Breton, 2009 ).
As an example, Table 1 presents some first results obtained for a clear and an overcast sky condition. The measurements were done in correspondence of two points on a horizontal plane: one near the window (point 1), one far from the window (point 2). The relative differences between calculated and measured values ranges from −12% to 29.4%, therefore confirm an acceptable accuracy of the model used for the lighting simulation.
| Sky condition | Point | Measured illuminance (lx) | Calculated illuminance (lx) | Relative difference (%) |
|---|---|---|---|---|
| Clear sky | 1 | 26618 | 31840 | 19.6 |
| 2 | 1088 | 958 | −12.0 | |
| Overcast sky | 1 | 246 | 276 | 11.9 |
| 2 | 74 | 96 | 29.4 | |
3.1.3. Simulation results for lighting energy demand
Annual energy demand for lighting, in a building or room, depends on several factors:
- indoor daylight availability;
- building usage, in terms of occupancy profile, required illuminance and user behaviour with respect to both electric and daylighting systems;
- lighting plant characteristics, mainly concerned with the installed electric power density and the adopted lighting control system.
To calculate the total annual energy used for lighting Daysim requires to define the arrival and departure time, the presence of lunch or intermediate breaks during working hours and the target illuminance, while, for the users behaviour with respect to lighting and blinds, some different algorithms can be used. Different stochastic user behaviour models, based on field study data, are in fact implemented in Daysim to mimic how building occupants interact with manual controls of lighting plants or shading devices: active users who operates the electric lighting in relation to ambient daylight condition, open blinds in the morning, and partly close them to avoid visual discomfort; passive users who keep the electric lighting switched on throughout the working day and keep the blinds lowered throughout the year. When running a simulation two different options for user behaviour can be selected:
- Active (equals design intention); passive (equals design risk): according to this option the energy demand for lighting is calculated considering an active user but, since there is the possibility that a user is passive, the passive simulation is carried out to see, through the daylighting metrics, how robust a building design is against users working in opposition to it.
- Mixed use: both type of users are considered, the simulation is run twice, once for each user type, and the resulting mean energy use is reported.
The options to simulate lighting and shading control system are:
- shading control: manual, automatic or no movable shading;
- lighting control: six different control strategies are considered: (1) manual on/off switch near the door, (2) switch off occupancy sensor, (3) switch on/off occupancy sensor, (4) photosensor controlled dimming system (5) combination switch off occupancy and dimming system (6) combination on/off occupancy and dimming system.
Furthermore, as for the characteristics of the lighting plant, the following data are required:
- installed lighting power density (W/m2 );
- standby power (W/m2 ) for occupancy sensor, photosensor, etc.;
- ballast loss factor (%);
- delay time of the occupancy sensor (minutes).
In the following some first results of lighting energy demand for one of the rooms selected as demonstrator in the SEEMPubS project are presented. The selected case study for this first analysis is a single office, with internal movable shading device, southwest oriented. Inputs for simulation are:
- Occupancy profile: from 9.00 am to 6.00 pm, with lunch and intermediate breaks.
- User requirements and behaviour: target illuminance of 500 lx, mix of active and passive users behaviour for lighting and active behaviour depending on the users need to avoid direct sunlight on work plan for blinds.
- Lighting control systems: the initially proposed control solution for the considered office was a combination of switch on/off based on occupancy and dimming based on photosensor. In this phase of the study all control options available in Daysim were actually simulated to compare their effectiveness with respect to the manual control, which is the solution used at present in the Politecnico buildings.
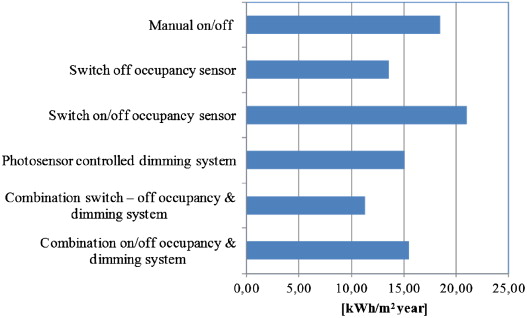
Results are presented in Figure 11 and Table 2 . The control solution proposed at first (combination on/off based on occupancy plus dimming) seems not to provide relevant savings with respect to manual control (16%). This result is consistent if we consider that a user with mixed active and passive behaviour was selected for manual control and that the presence of the shading device in a southwest oriented room may reduce greatly the annual daylight availability.
|
|
|
Figure 11. Energy demand for different control strategies. |
| Control strategies | Energy savings with respect to manual control (%) |
|---|---|
| Switch off occupancy sensor | −26 |
| Switch on/off occupancy sensor | +14 |
| Photosensor controlled dimming system | −18 |
| Combination switch off occupancy and dimming system | −39 |
| Combination on/off occupancy and dimming system | −16 |
The results obtained with Daysim demonstrate that, for this room, the most effective control strategy would be a combination of dimming based on light availability and switch off based on occupancy. In this case energy savings with respect to manual control rise up to 39%.
3.2. HVAC simulations
3.2.1. Software presentation
TRNSYS is a internationally recognized software dedicated to the simulation of dynamic systems, developed by the Solar Energy Laboratory (SEL), University of Madison in the United States (TRNSYS official website) . It allows performing dynamic simulations of the thermal behaviour of a mono or multi-zone building. It can also follow hourly consumption (heating, air conditioning) or production (solar panels) annual energy facilities of a building.
TRNSYS is in fact a software which compiles different modules (called “types”) and allows to link them one to the other to create a realistic model of the building (or the room) tested. Each type has its own part in the simulation. For example, three types are used to create meteorological data of the simulated place, and a special type to model the building (walls and their compositions, windows, etc.).
The new version of TRNSYS (v17) was used to perform those simulations. The new 3D plug-in of this version was used on several cases of the project to go further in the interoperability between parametric architectural software (Revit) and energy simulation software (TRNSYS, Daysim, etc.)
3.2.2. Modelling of two offices in historical building
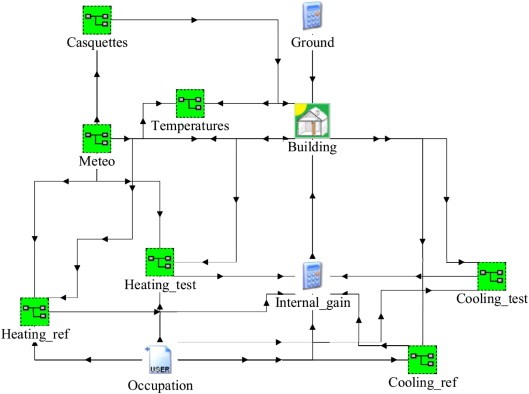
The figure below (Figure 12 ) presents the TRNSYS simulation diagram used to simulate the buildings with the different types to model all the specifications of the Politecnico campus (fan coils, AHU, etc.).
|
|
|
Figure 12. Global TRNSYS simulation model. |
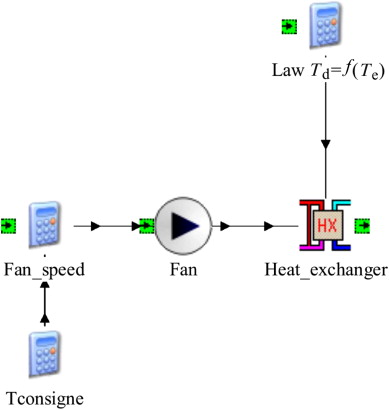
To approach more precisely the reality of the Politecnico campus, two special types were used to simulate fan coils (present in nearly all the rooms of the SEEMPubS project). Those types use the hot water temperature and the flow rate of the fan to calculate the exact energy consumption of the system. A schedule has also been adopted to recreate the occupancy and no occupancy periods of the general heating system of Politecnico (Figure 13 ).
|
|
|
Figure 13. TRNSYS simulation model to simulate fan coils. |
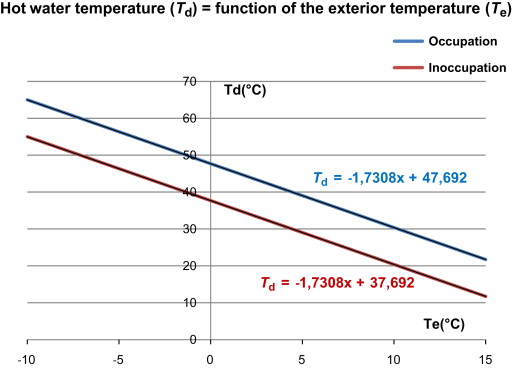
The hot water temperature of the general heating system was supposed to vary as a function of the outdoor temperature in Torino according to a classical heating law (Figure 14 ).
|
|
|
Figure 14. Hot water calculation law used. |
3.2.3. Simulation results
In this section we present the first results of the simulation concerning two offices in the Valentino Castle (Politecnico di Torino). One of the offices, the reference room, represents the present situation of the office (occupancy, fan speed selected manually by the occupant, heating based on a automatic schedule which does not take into account the occupancy, etc.). The second office is used to test the control strategy described in the precedent paragraph.
The aim of this study is to measure the energy saving potential of the control strategy proposed in the SEEMPubS project. To perform this goal, a simulation has been made of one cold week (winter condition) and the heating needs and the internal temperature of the two offices were measured.
An important part of our strategy is based on the management of the heating (or cooling) during periods without occupancy. To see the influence of our strategy an occupancy schedule was created, which simulates four types of day:
- an office day: occupation of the office from 8 am to 6 pm,
- a teaching day: occupancy from 8 am to 10 am, then after lunch from 1 pm to 2 pm, and finally after the afternoon class from 4 pm to 6 pm,
- a conference day: no occupancy during the day,
- weekend: no occupancy.
In the simulation performed here we have in the two offices this repartition:
- an office day: Monday and Friday,
- a teaching day: Tuesday and Wednesday,
- a conference day: Thursday.
- weekend day: Saturday and Sunday.
In the next table (Table 3 ) the results on the heating needs of the two offices during this cold week are presented:
| Reference office | Test office | Savings (%) | |
|---|---|---|---|
| P (W) | 8794 | 6755 | −23 |
| E (kW h) | 169 | 58 | −66 |
| P /A (W/m⊃2;) | 148.4 | 114 | −23 |
| E /A (kW h/m⊃2;) | 2.86 | 0.97 | −66 |
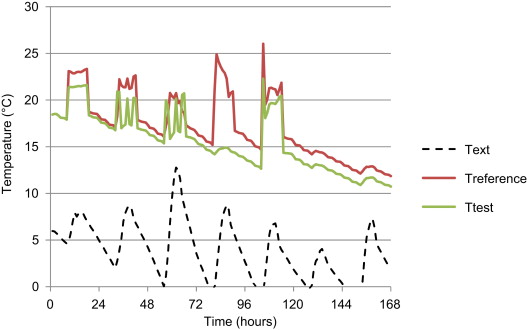
The next figure (Figure 15 ) presents both internal temperatures of the rooms during the week with the external temperature of Torino used to perform the simulation.
|
|
|
Figure 15. Indoor temperatures results of the simulation. |
As we can see in Table 3 , the control strategy used in the test office allows to perform an important energy saving (−66% compare to the reference room). This result is a consequence of the management of periods without occupants. In a classic office like the reference room, the occupancy is managed by a general schedule for the entire building which cut off the heating from 6 pm to 8 am and during weekends but the heating is on every day, no matter if the occupant is out for the day. In the test office, a presence detector is used which allows to turn off the heating if no presence is detected for more than 30 min.
Furthermore, in the classical office, the fan speed is controlled by the occupant who usually put it to the maximal value, which is 3, so the heating will always be to its maximal power to reach the set point temperature in the room (no matter which the real occupation is). On the other hand, in the test office, a regulator is used to choose the fan speed; for example if the set point temperature is 21 °C and the indoor temperature of the room is 20 °C, the regulator will select the minimal speed to reach 21 °C, but if the temperature is 16 °C in the office, it is the maximal speed which will be chosen.
4. Conclusions
Actions of retrofitting on building envelopes or services to reduce energy consumptions are not always possible or economically convenient in existing buildings and in particular in historical buildings where conservation is a matter of priority. Nevertheless savings can be achieved by designing intelligent ICT-based service to monitor and control environmental conditions, energy loads and plants operation.
The paper has presented some activities carried on in the first phase of the SEEMPubS project and in particular it describes the methodology adopted to define and evaluate the control strategies to be applied in the demonstrator buildings of the Politecnico di Torino to prove the efficacy of the ICT-based BMS that will be designed and implemented in the following phases of the project.
Based on the analysis of buildings and rooms' characteristics, new control strategies have been proposed, both for lighting and for heating, in order to provide energy savings in buildings where heavy retrofitting works are not possible, like for historical buildings. The effectiveness of the proposed control strategies is being evaluated through building performance dynamic simulations.
As far as lighting is concerned, the first energy saving results, obtained for a single office southwest oriented, demonstrated that the initially proposed control solution would not provide the expected savings, while better results could be achieved with a different combination of occupancy based and daylight harvesting control. Higher savings are expected for rooms with greater annual daylight availability (for instance rooms with a minor use of shadings).
A further consideration regards the impact of occupancy profile and users' behaviour: at present the algorithms implemented in Daysim have been used to calculate the energy demand, but different results could be obtained by implementing an “ad hoc” occupancy profile or user behaviour algorithm, as was done for thermal simulations.
To conclude with the thermal simulation part, a first answer about energy saving potential of the control strategy imagined for the SEEMPubS project has been achieved in design conditions. This turned out to be about 60% on this test simulation, but it was based on a reference case with a scarce control. This result has to be completed by an analysis of thermal comfort discrepancies induced by this control and by a yearly study, which also includes warmer days.
Acknowledgements
We acknowledge the contribution of whole consortium of the SEEMPubs project which collaborated at the achievement of the presented results.
References
- Destefanis et al., 2011 Destefanis, A., et al., 2011. Initial specification of the intelligent control system, D2.1.1, WP2. Smart Energy Efficient Middleware for Public Spaces SEEMPubS Project, pp.77, 〈http://seempubs.polito.it/〉 (accessed 28.02.11).
- Doulos et al., 2008 L. Doulos, A. Tsangrassoulis, F. Topalis; Quantifying energy savings in daylight responsive systems: the role of dimming electronic ballasts; Energy and Buildings, 40 (2008), pp. 36–50
- Dubois and Blomsterberg, 2011 M.C. Dubois, A. Blomsterberg; Energy saving potential and strategies for electric lighting in future North European, low energy office buildings: a literature review; Energy and Buildings, 43 (2011), pp. 2572–2582
- Fraisse et al., 1997b G. Fraisse, J. Virgone, J. Brau; An analysis of the performance of different intermittent heating controllers and an evaluation of comfort and energy consumption; International Journal of HVAC&R Research, 3 (4) (1997), pp. 369–386
- Fraisse et al., 1997a G. Fraisse, J. Virgone, J.J. Roux; Thermal control of a discontinuously occupied building using a classical and a fuzzy logic approach; Energy and Buildings, 26 (3) (1997), pp. 303–316
- Fraisse et al., 1999 G. Fraisse, J. Virgone, R. Yezou; A numerical comparison of different methods for optimizing heating restart time in intermittently occupied buildings; Applied Energy, 62 (3) (1999), pp. 125–140
- Guo et al., 2010 X. Guo, D.K. Tiller, G.P. Henze, C.E. Waters; The performance of occupancy-based lighting control systems: a review; Lighting Research & Technology, 42 (2010), pp. 415–431
- Jahn et al., 2009 Jahn, M., Pramudianto, F., Al-Akkad, A., 2009. Hydra middleware for developing pervasive systems: a case study in the ehealth domain. In: Proceedings of the 1st International Workshop on Distributed Computing in Ambient Environments (DiComAe 2009). 2009, Paderborn, Germany.
- Lardies et al., 2009 Lardies, F.M., et al., 2009. Deploying pervasive web services over a P2P overlay. In: Proceedings of the 18th IEEE International Workshops on Enabling Technologies: Infrastructures for Collaborative Enterprises. 2009, IEEE Computer Society.
- Larson and Shakespeare, 1998 G.W. Larson, R.A. Shakespeare; Rendering with Radiance. The Art and Science of Lighting Visualization; , 1-55860-499-5Morgan Kaufmann Publishers, S. Francisco, California (1998)
- Mardaljevic, 1995 J. Mardaljevic; Validation of a lighting simulation program under real sky conditions; Lighting Research & Technology, 27 (4) (1995), pp. 181–188 http://doi.org/10.1177/14771535950270040701
- Mardaljevic, 2000 J. Mardaljevic; Simulation of annual daylighting profiles for internal illuminance; Lighting Research & Technology, 32 (3) (2000), pp. 111–118
- Mardaljevic et al., 2009 J. Mardaljevic, L. Heschong, E. Lee; Daylight metrics and energy savings; Lighting Research & Technology, 41 (3) (2009), pp. 261–283
- Pellegrino et al., 2011 Pellegrino, A., et al., 2011. Initial energy control and conservation strategies, D2.3.1, WP2. Smart Energy Efficient Middleware for Public Spaces SEEMPubS Project, pp. 53, 〈http://seempubs.polito.it/〉 (accessed 31.08.11).
- Reinhart and Herkel, 2000 C.F. Reinhart, S. Herkel; The simulation of annual daylight illuminance distributions—a state-of-the-art comparison of six RADIANCE-based methods; Energy and Buildings, 32 (2000), pp. 167–187
- Reinhart and Breton, 2009 Reinhart, C.F., Breton, P.F., 2009. Experimental validation of 3 ds Max® design 2009 and Daysim 3.0. In: Proceedings of the 11th International IBPSA Conference. 27–30 July 2009, Glasgow, Scotland, pp. 1514–1521.
- Reinhart et al., 2006 C.F. Reinhart, J. Mardaljevic, Z. Rogers; Dynamic daylight performance metrics for sustainable building design; Leukos, 3 (1) (2006), pp. 1–25
- Reinhart and Walkenhorst, 2001 C.F. Reinhart, O. Walkenhorst; Validation of dynamic RADIANCE-based daylight simulations for a test office with external blinds; Energy and buildings, 33 (7) (2001), pp. 683–697 http://doi.org/10.1016/S0378-7788(01)00058-5
- Reinhart, 2001 Reinhart, C.F., 2001. Daylight Availability and Manual Lighting Control in Office Buildings Simulation Studies and Analysis of Measurements. Ph.D. Thesis, Technical University of Karlsruhe, Faculty of Architecture.
- Ryckaert et al., 2010 W.R. Ryckaert, C. Lootens, J. Geldof, P. Hanselaer; Criteria for energy efficient lighting in buildings; Energy and Buildings, 42 (2010), pp. 341–347
- http://seempubs.polito.it/ SEEMPubS official website: 〈http://seempubs.polito.it/〉 .
- http://sel.me.wisc.edu/trnsys/ TRNSYS official website: 〈http://sel.me.wisc.edu/trnsys/〉
- Tiller et al., 2010 D.K. Tiller, X. Guo, G.P. Henze, C.E. Waters; Validating the application of occupancy sensor networks for lighting control; Lighting Research & Technology, 42 (2010), pp. 399–414
- Virgone et al., 2010 Virgone, J., et al., 2010. Building definition: criteria, methodologies and description of the selected buildings, D1.1, WP1. Smart Energy Efficient Middleware for Public Spaces SEEMPubS Project, pp. 41, 〈http://seempubs.polito.it/〉 (accessed 30.11.10).
- Virgone et al., 2011 Virgone, J., et al., 2011. Energy audit certification, D1.2, WP1. Smart Energy Efficient Middleware for Public Spaces SEEMPubS Project, 41 p., 〈http://seempubs.polito.it/〉 (accessed 28.02.11).
Document information
Published on 12/05/17
Submitted on 12/05/17
Licence: Other
Share this document
claim authorship
Are you one of the authors of this document?
